Meta-Analysis
. 2018 Apr 24;9(1):1631.
doi: 10.1038/s41467-018-03274-0.

Deep whole-genome sequencing reveals recent selection signatures linked to evolution and disease risk of Japanese

Affiliations
Meta-Analysis

Deep whole-genome sequencing reveals recent selection signatures linked to evolution and disease risk of Japanese

Yukinori Okada et al. Nat Commun. .

Abstract

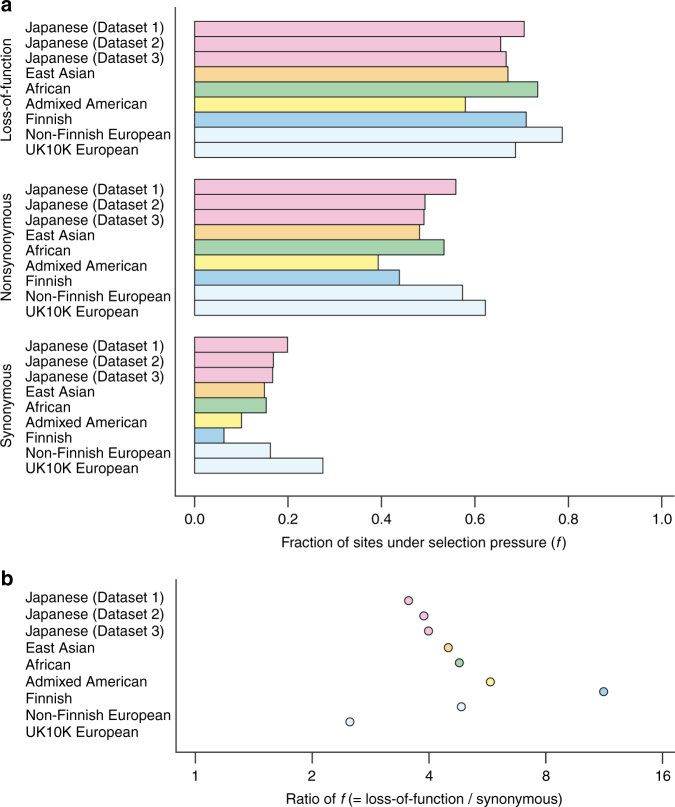
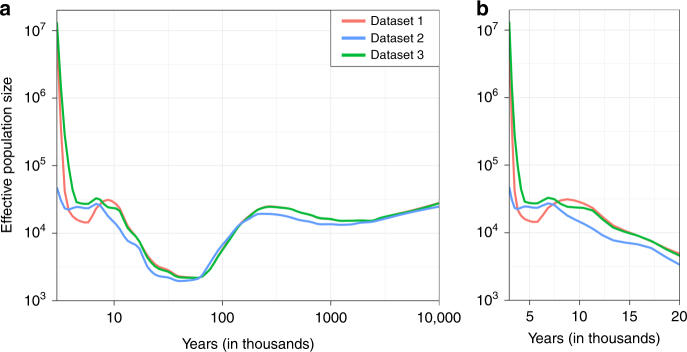
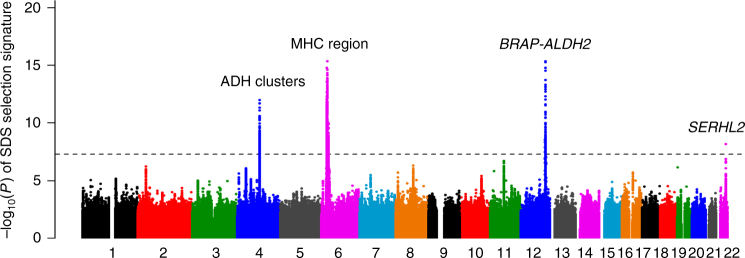
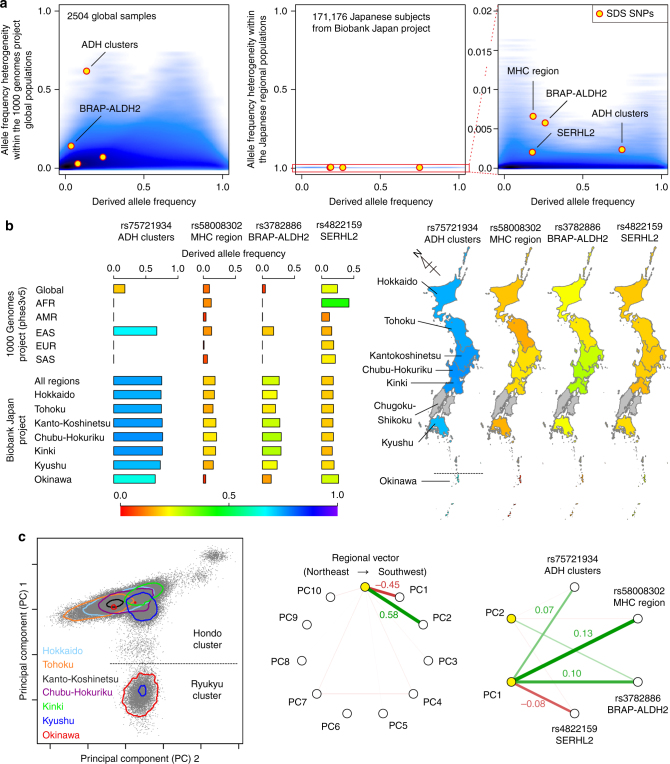
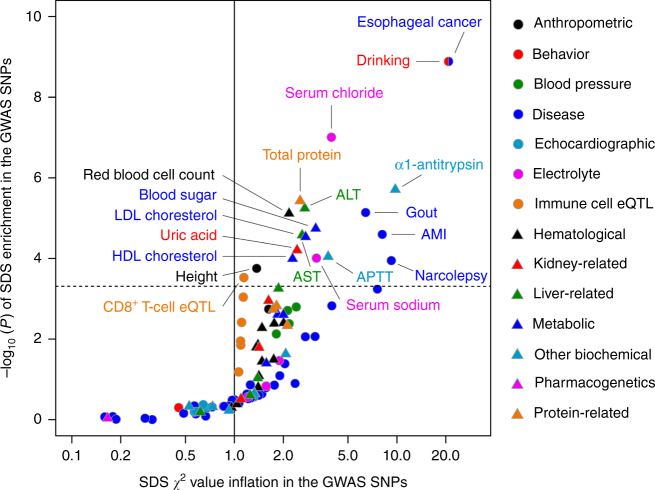
Understanding natural selection is crucial to unveiling evolution of modern humans. Here, we report natural selection signatures in the Japanese population using 2234 high-depth whole-genome sequence (WGS) data (25.9×). Using rare singletons, we identify signals of very recent selection for the past 2000-3000 years in multiple loci (ADH cluster, MHC region, BRAP-ALDH2, SERHL2). In large-scale genome-wide association study (GWAS) dataset (n = 171,176), variants with selection signatures show enrichment in heterogeneity of derived allele frequency spectra among the geographic regions of Japan, highlighted by two major regional clusters (Hondo and Ryukyu). While the selection signatures do not show enrichment in archaic hominin-derived genome sequences, they overlap with the SNPs associated with the modern human traits. The strongest overlaps are observed for the alcohol or nutrition metabolism-related traits. Our study illustrates the value of high-depth WGS to understand evolution and their relationship with disease risk.


Conflict of interest statement

The authors declare no competing interests.

Figures

Fig. 1
Fig. 1
Site frequency spectrum and fraction of sites under selection in the worldwide populations. Site frequency spectrum (SFS) estimated for the worldwide populations. In addition to the Japanese WGS datasets, data obtained from the Genome Aggregation Database (gnomAD; African, admixed American, east Asian, Finnish, and Non-Finnish European) and the UK10K project (European) are indicated,. a Fraction of sites under selection pressure ( = f) calculated separately for loss-of-of-function variants, nonsynonymous SNV, or synonymous SNV. b Ratio of f between loss-of-of-function variants and synonymous SNV
Fig. 2
Fig. 2
Longitudinal change of the effective population size of the Japanese population. Longitudinal change of the effective population size of the Japanese population estimated from the WGS data. The effective population sizes were estimated separately for the datasets 1–3, using SMC++ software. Times are indicated in a logarithm and in b linear scales. One generation was considered to be 29 years
Fig. 3
Fig. 3
Genome-wide very recent natural selection signatures of the Japanese population. A Manhattan plot of the genome-wide natural selection signatures obtained from the WGS data of 2234 Japanese individuals. The y-axis indicates the –log10(P) of a genome-wide selection signature calculated by using SDS. The horizontal gray line represents the genome-wide significance threshold (P < 5.0 × 10-8)
Fig. 4
Fig. 4
Derived allele frequency heterogeneity of the SNPs with natural selection signatures. a DAF heterogeneity of the SNPs within subpopulations of the 1000 Genomes Project global subjects, or the regional populations of the Japanese subjects from the BBJ cohort. Strength of blue color corresponds to the density of the SNPs. Circles indicate the top SNPs identified by SDS, and the top SNPs with nominally significant enrichment of DAF heterogeneity are labeled (P < 0.05). b DAF spectra of the four SNPs with genome-wide SDS selection signatures in each sub- or regional populations. DAF in each of the seven regions of Japan (Hokkaido, Tohoku, Kanto-Koshinetsu, Chubu-Hokuriku, Kinki, Kyushu, and Okinawa) are colored in the geographical map. We note that DAF in Chugoku-Shikoku was not available (colored in gray). c Correlations among the regional vector of Japan, PCs, and the SDS top SNP genotypes. PC1 separated the Japanese population into the two major clusters, Hondo and Ryukyu (left panel). Correlations between the regional vector and each of PCs (middle panel), and between top two PCs and each of the top SNP genotypes from the SDS analysis (right panel) are indicated. PC1 showed strong correlations with the regional vector and the SNP genotypes
Fig. 5
Fig. 5
Overlap between natural selection signatures and genetic risk of human phenotypes in Japanese. Enrichment of the natural selection signatures in the GWAS-associated variants of the diseases (n = 36), quantitative traits (n = 61), and immune-cell-specific eQTL (n = 6) in Japanese. For each trait, inflation of the selection χ2 value is indicated along the x-axis, and –log10(P) of enrichment is plotted along the y-axis. The horizontal gray line represents significance threshold based of Bonferroni’s correction on the numbers of the evaluated traits (P < 0.00049)

References

    1. Sabeti PC, et al. Positive natural selection in the human lineage. Science. 2006;312:1614–1620. doi: 10.1126/science.1124309. - DOI - PubMed
    1. Weir BS, Cockerham CC. Estimating F-statistics for the analysis of population structure. Evolution. 1984;38:1358–1370. - PubMed
    1. Voight BF, Kudaravalli S, Wen X, Pritchard JK. A map of recent positive selection in the human genome. PLoS Biol. 2006;4:e72. doi: 10.1371/journal.pbio.0040072. - DOI - PMC - PubMed
    1. Sabeti PC, et al. Genome-wide detection and characterization of positive selection in human populations. Nature. 2007;449:913–918. doi: 10.1038/nature06250. - DOI - PMC - PubMed
    1. Grossman SR, et al. A composite of multiple signals distinguishes causal variants in regions of positive selection. Science. 2010;327:883–886. doi: 10.1126/science.1183863. - DOI - PubMed

Publication types

Substances