. 2018 Apr 24;9(1):1623.
doi: 10.1038/s41467-018-03940-3.

Layer-specific morphological and molecular differences in neocortical astrocytes and their dependence on neuronal layers

Affiliations

Layer-specific morphological and molecular differences in neocortical astrocytes and their dependence on neuronal layers

Darin Lanjakornsiripan et al. Nat Commun. .

Abstract

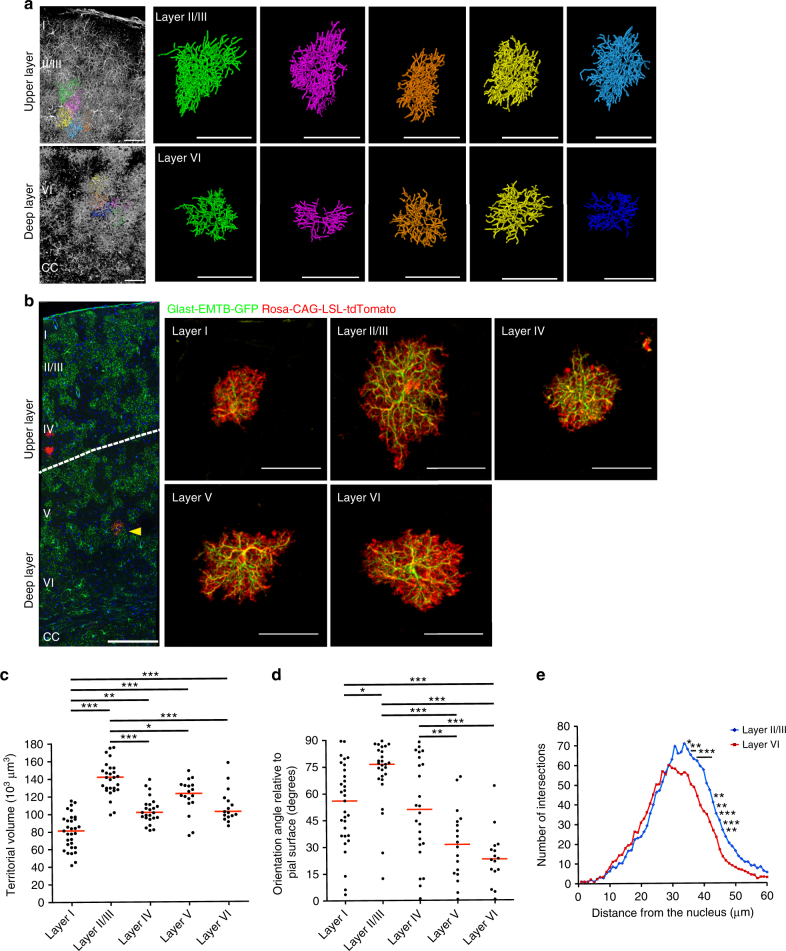
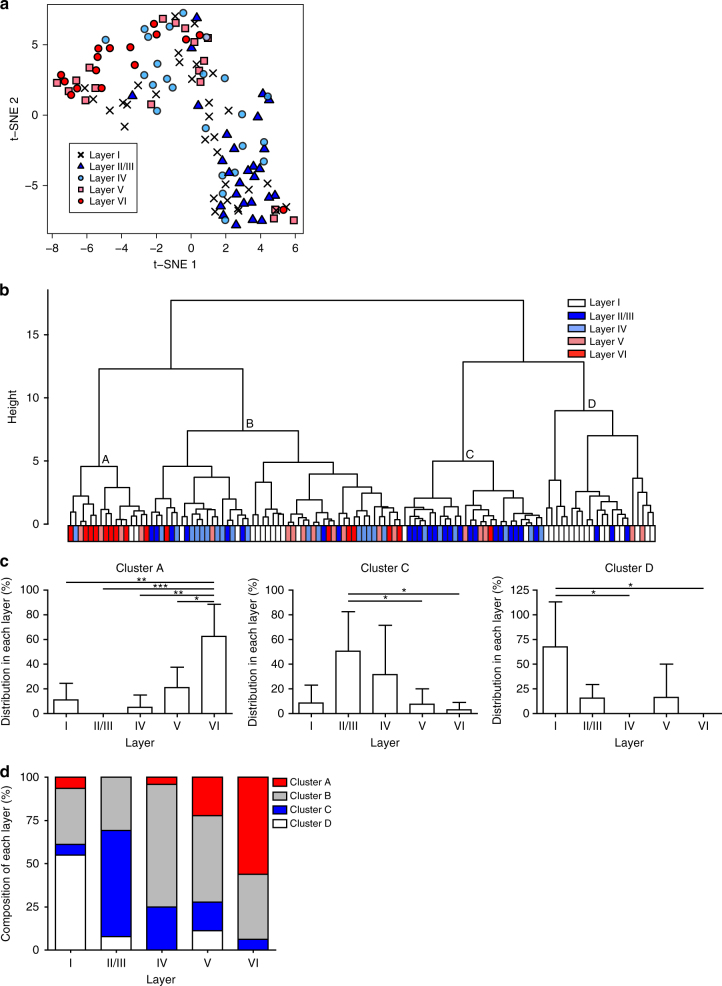
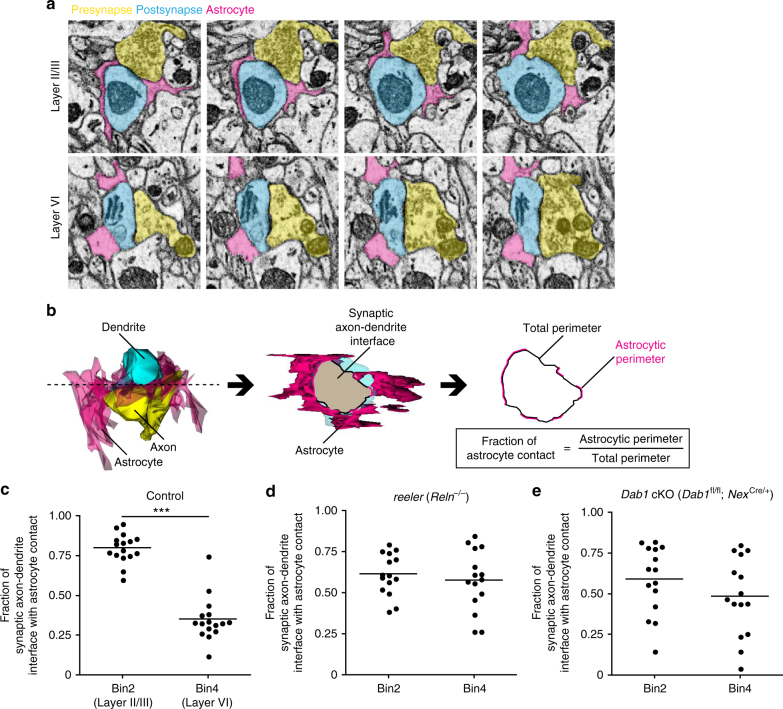
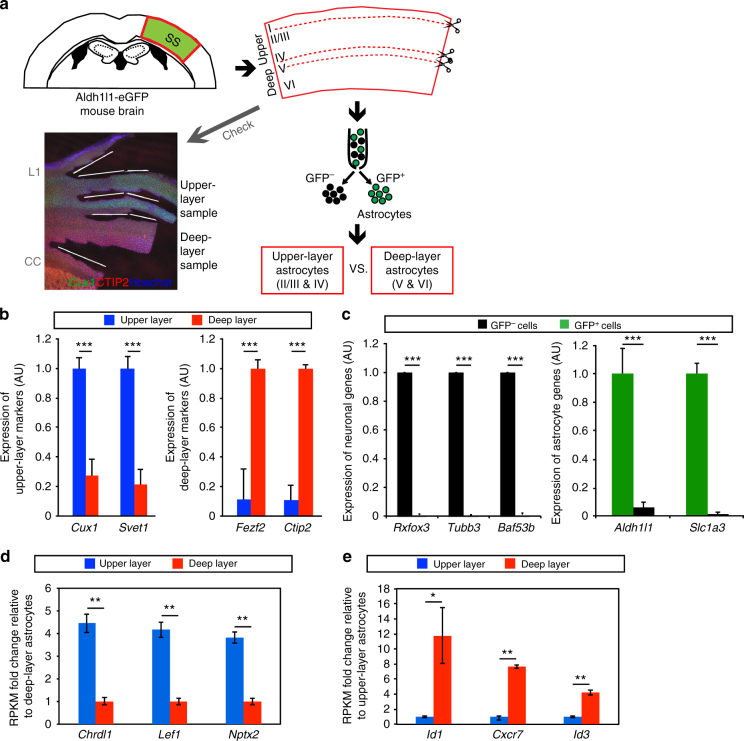
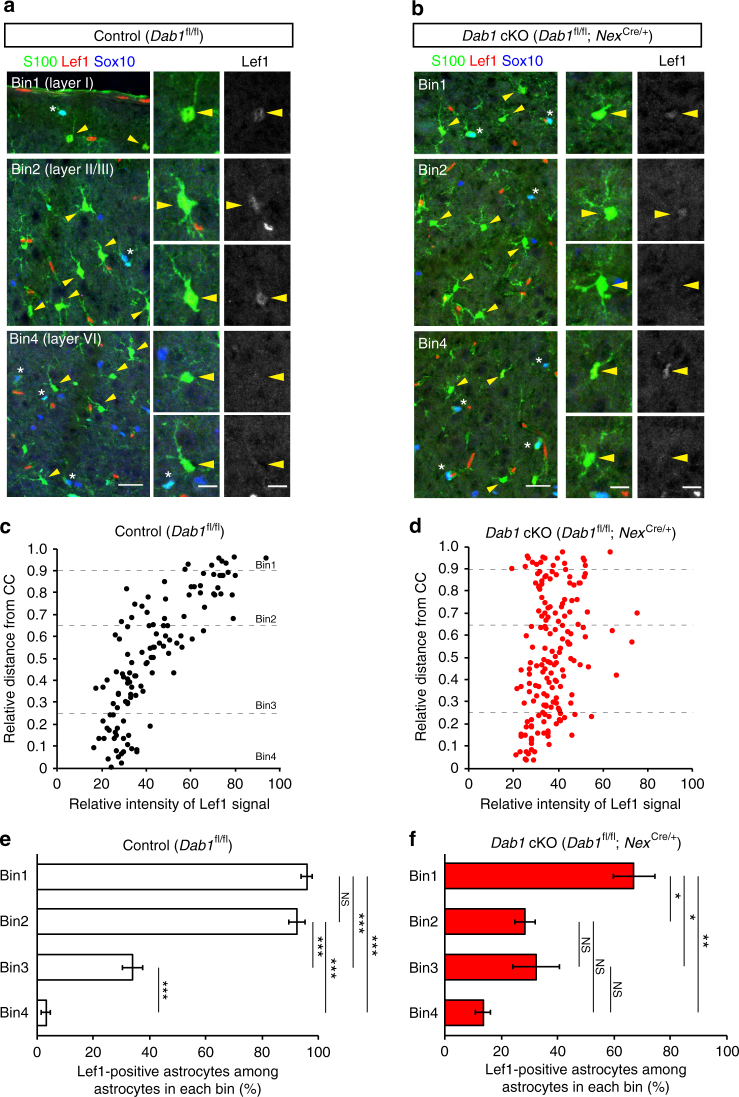
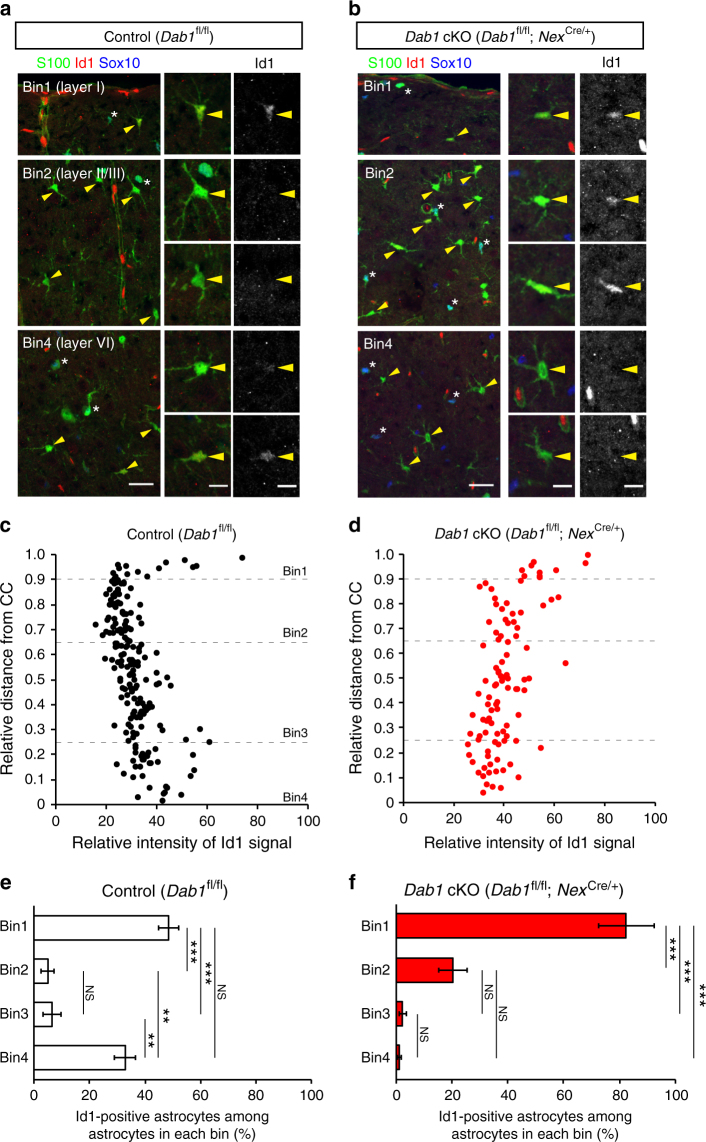
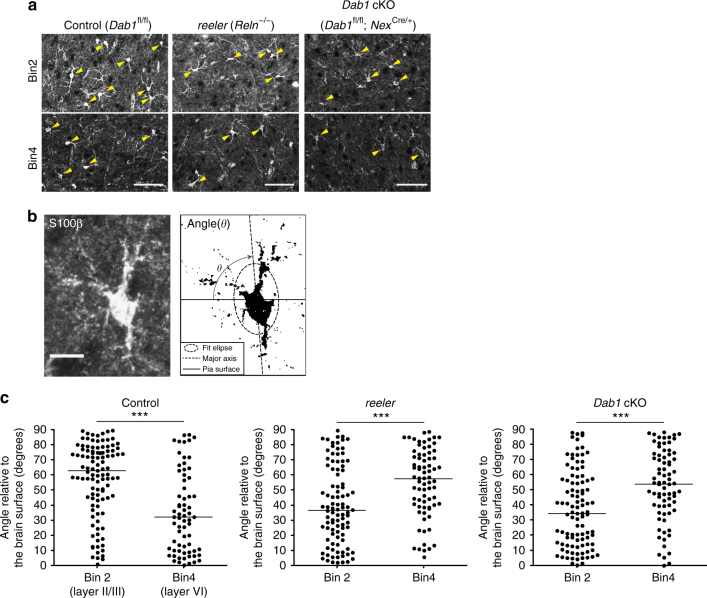
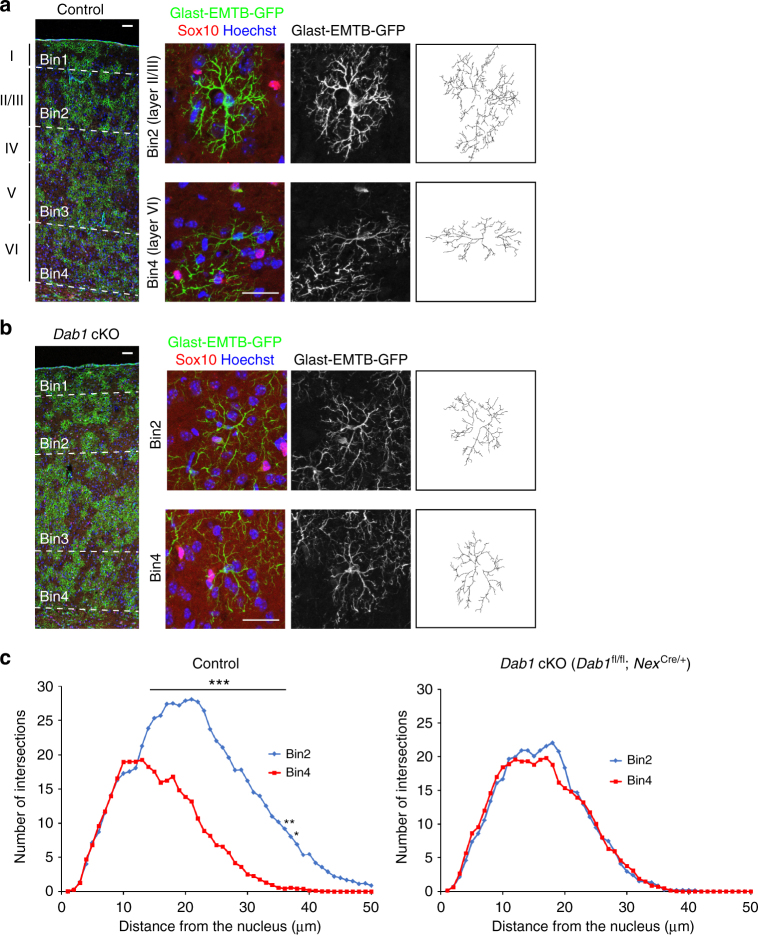
Non-pial neocortical astrocytes have historically been thought to comprise largely a nondiverse population of protoplasmic astrocytes. Here we show that astrocytes of the mouse somatosensory cortex manifest layer-specific morphological and molecular differences. Two- and three-dimensional observations revealed that astrocytes in the different layers possess distinct morphologies as reflected by differences in cell orientation, territorial volume, and arborization. The extent of ensheathment of synaptic clefts by astrocytes in layer II/III was greater than that by those in layer VI. Moreover, differences in gene expression were observed between upper-layer and deep-layer astrocytes. Importantly, layer-specific differences in astrocyte properties were abrogated in reeler and Dab1 conditional knockout mice, in which neuronal layers are disturbed, suggesting that neuronal layers are a prerequisite for the observed morphological and molecular differences of neocortical astrocytes. This study thus demonstrates the existence of layer-specific interactions between neurons and astrocytes, which may underlie their layer-specific functions.


Conflict of interest statement

The authors declare no competing interests.

Figures

Fig. 1
Fig. 1
Three-dimensional morphology of astrocytes in layers I–VI of the mouse somatosensory cortex as revealed by visualization of microtubule and whole-cell structures. a 3D reconstruction of astrocyte morphology in the Glast-EMTB-GFP mouse brain (P60) rendered transparent by the CUBIC technique. 3D structures and traces are shown in the left panels, and individual traces in the right. CC, corpus callosum. Scale bars, 250 μm (left panels), 50 μm (right panels). b Representative confocal image of sparsely labeled astrocytes in Glast-EMTB-GFP;Glast-CreERT2;Rosa-CAG-LSL-tdTomato mice (P65) injected with a low dose of tamoxifen at P60 (left), and representative 3D projection images of astrocytes in each layer (right). Arrowhead indicates GFP+tdTomato+ cell. Scale bars, 250 μm (left panel), 50 μm (right panels). c, d Quantification of territorial volume (c) and the angle of orientation relative to the brain surface (d) for astrocytes in each layer. The data are shown for 116 cells from five brains, with the red bars indicating median values. *P < 0.05, **P < 0.01, ***P < 0.001 (one-way ANOVA followed by Bonferroni’s test). e 3D Sholl analysis for microtubule structure of sparsely labeled individual astrocytes in layers II/III and VI of Glast-EMTB-GFP;Glast-CreERT2;Rosa-CAG-LSL-tdTomato mice injected with a low dose of tamoxifen at P60. The data are means (layer II/III astrocytes, n = 27 cells from five brains; layer VI astrocytes, n = 16 cells from five brains). *P < 0.05, **P < 0.01, ***P < 0.001 versus corresponding values for layer VI astrocytes (two-way ANOVA followed by Bonferroni’s test)
Fig. 2
Fig. 2
Cluster analysis based on morphological features of neocortical astrocytes. a t-SNE analysis showing separation of neocortical astrocytes into two groups, with most cells in layer II/III and those in layers V and VI localizing to different groups. b Hierarchical clustering showing that neocortical astrocytes can be separated into four clusters designated A through D, with cluster A being enriched in astrocytes of layers V and VI, cluster C in those of layer II/III, and cluster D in those of layer I. c Percentage of astrocytes in each cluster located in the different neocortical layers (cluster A, n = 16; cluster C, n = 28; cluster D, n = 22). Data are means ± s.d. for at least three mice. *P < 0.05, **P < 0.01, ***P < 0.001 (one-way ANOVA followed by Bonferroni’s test). d Percentage of astrocytes in each layer belonging to clusters A through D (layer I, n = 31; layer II/III, n = 27; layer IV, n = 24; layer V, n = 18; layer VI, n = 16). Two-sided Fisher’s exact test, P = 8.439 × 10−12
Fig. 3
Fig. 3
Difference in astrocyte-synapse structural interactions in layers II/III and VI. a Series of SBF-SEM images acquired from coronal sections of the brain of an adult wild-type mouse at ×4730 magnification. b Procedure for quantification of astrocyte ensheathment of synapses. Serial SEM images were reconstructed to measure the perimeter of synaptic axon-dendrite interface and the astrocytic perimeter. ce Quantification of astrocyte ensheathment of synapses in bin2 and bin4 (n = 16 synapses in each bin for control (c) and n = 15 synapses in each bin for reeler (d) and Dab1 cKO (e) mice). Astrocyte position in the cortical layers is expressed as relative distance from the corpus callosum (CC) to the pia: bin2, 0.65–0.9; and bin4, 0–0.25. Horizontal bars represent mean values. ***P < 0.001 (Welch’s t-test)
Fig. 4
Fig. 4
Layer-specific molecular expression in neocortical astrocytes. a Procedure for the isolation of upper-layer (ULAs) and deep-layer (DLAs) astrocytes for comparison of their gene expression levels. Layer I (L1), the boundary between layers IV and V, and the corpus callosum (CC) are discarded from the somatosensory (SS) area of the brain of young adult Aldh1l1-eGFP transgenic mice in which astrocytes are labeled with GFP and can therefore be isolated by FACS. The fluorescence image is of a coronal section stained with antibodies to Cux1 and to CTIP2, as well as with Hoechst 33342. b RT-qPCR analysis of upper-layer (Cux1, Svet1) and deep-layer (Fezf2, Ctip2) neuronal marker genes in upper-layer and deep-layer tissue samples. c RT-qPCR analysis of neuronal (left) and astrocytic (right) marker genes in isolated GFP+ or GFP cells. d, e RPKM fold change relative to deep-layer (d) and upper-layer (e) in expression analyzed by RNA-seq (n = 3 brains). Top 3 upper-layer enriched and deep-layer enriched genes are shown in d, e, respectively. See Supplementary Data 1 and 2 for full gene lists of upper-layer and deep-layer enriched genes, respectively. Data are means ± s.d. for three brains. *P < 0.05, **P < 0.01, ***P < 0.001 (paired two-tailed Student’s t-test)
Fig. 5
Fig. 5
Layer-specific expression of Lef1 in neocortical astrocytes and its disruption in Dab1 cKO mice. a, b Immunofluorescence staining for S100, Sox10, and Lef1 in coronal sections of control (Dab1fl/fl) (a) and Dab1 cKO (Dab1fl/fl;NexCre/+) (b) mice at P30. Astrocytes were identified as S100-positive, Sox10-negative cells (arrowheads); asterisks indicate double-positive cells. Individual astrocytes and Lef1 signals are shown in the right panels at higher magnification. Scale bars, 25 µm (left panels) and 10 μm (right panels). c, d Representative data of Lef1 signal intensitiesin the nucleus of individual astrocytes in a coronal section from a control (c) and a Dab1 cKO (d) mouse. Astrocyte position in the cortical layers is expressed as relative distance from the corpus callosum (CC) to the pia, with dashed lines indicating the boundaries between bins: bin1, 0.9–1.0; bin2, 0.65–0.9; bin3, 0.25–0.65; and bin4, 0–0.25. e, f Percentage of Lef1-positive astrocytes among total astrocytes in each bin of the neocortex of control (e) and Dab1 cKO (f) mice (n = 3 mice). Perivascular astrocytes are excluded from quantification. Data are means ± s.e.m. from three mice of each genotype. **P < 0.01; ***P < 0.001; NS, not significant (one-way ANOVA followed by Bonferroni’s test)
Fig. 6
Fig. 6
Layer-specific expression of Id1 in neocortical astrocytes and its disruption in Dab1 cKO mice. a, b Immunofluorescence staining for S100, Sox10, and Id1 in coronal sections of control (Dab1fl/fl) (a) and Dab1 cKO (Dab1fl/fl;NexCre/+) (b) mice at P30. Astrocytes were identified as S100-positive, Sox10-negative cells (arrowheads); asterisks indicate double-positive cells. Individual astrocytes and Id1 signals are shown in the right panels at higher magnification. Scale bars, 25 µm (left panels) and 10 μm (right panels). c, d Representative data of Id1 signal intensities in the nucleus of individual astrocytes in a coronal section from a control (c) and a Dab1 cKO (d) mouse. Astrocyte position in the cortical layers is expressed as relative distance from the corpus callosum (CC) to the pia, with dashed lines indicating the boundaries between bins: bin1, 0.9–1.0; bin2, 0.65–0.9; bin3, 0.25–0.65; and bin4, 0–0.25. e, f Percentage of Id1-positive astrocytes among total astrocytes in each bin of the neocortex of control (e) and Dab1 cKO (f) mice (n = 3 mice). Perivascular astrocytes are excluded from quantification. Data are means ± s.e.m. from three mice of each genotype. **P < 0.01; NS, not significant (one-way ANOVA followed by Bonferroni’s test)
Fig. 7
Fig. 7
Disruption of layer-specific astrocyte orientation in reeler and Dab1 cKO mice. a Immunofluorescence staining for S100β in bin2 (layer II/III) and bin4 (layer VI) of coronal brain sections from control (Dab1fl/fl), Dab1 cKO (Dab1fl/fl;NexCre/+), and reeler (Reln−/−) mice at P60–P70. Arrowheads indicate S100β-positive astrocytes. Scale bars, 50 µm. b Schematic for measurement of astrocyte orientation relative to the brain surface based on S100β immunostaining. Scale bar, 10 µm. c Quantification of the orientation angle of astrocytes (S100β-positive, Sox10-negative cells) in bin2 and bin4 of control, Dab1 cKO, and reeler mice (n = 3 mice) at P60–P70. Horizontal bars indicate median values. Control, n = 106 and 68 cells; Dab1 cKO, n = 100 and 76 cells; reeler, n = 96 and 74 cells for bin2 and bin4, respectively. ***P < 0.001 (Welch’s t-test)
Fig. 8
Fig. 8
Disruption of layer-specific astrocyte arborization in Dab1 cKO mice. a, b Immunofluorescence staining for GFP and Sox10 in coronal sections of control (Glast-EMTB-GFP;Dab1fl/fl or Glast-EMTB-GFP) (a) and Dab1 cKO (Glast-EMTB-GFP;Dab1fl/fl;NexCre/+) (b) mice at P30 (left panels). Nuclei were stained with Hoechst 33342. Scale bars, 50 μm. Right panels show representative magnified images of astrocytes and their traced processes in bin2 (layer II/III) and bin4 (layer VI). Scale bars, 25 μm. c 2D Sholl analysis for microtubule structure of individual astrocytes in coronal brain sections. Astrocytes were randomly selected for analysis. Data are means for 15 cells in bin2 and 18 cells in bin4 for control mice and for 18 cells in bin2 and 17 cells in bin4 for Dab1 cKO mice. Three brains of each genotype were analyzed. *P < 0.05, **P < 0.01, ***P < 0.001 (two-way ANOVA followed by Bonferroni’s test)

References

    1. Perea G, Navarrete M, Araque A. Tripartite synapses: astrocytes process and control synaptic information. Trends Neurosci. 2009;32:421–431. doi: 10.1016/j.tins.2009.05.001. - DOI - PubMed
    1. Chung WS, Welsh CA, Barres BA, Stevens B. Do glia drive synaptic and cognitive impairment in disease? Nat. Neurosci. 2015;18:1539–1545. doi: 10.1038/nn.4142. - DOI - PMC - PubMed
    1. Papouin, T., Dunphy, J., Tolman, M., Foley, J. C. & Haydon, P. G. Astrocytic control of synaptic function. Philos. Trans. R. Soc. Lond. B Biol. Sci. 372, 20160154 (2017). - PMC - PubMed
    1. Allen NJ, Eroglu C. Cell biology of astrocyte-synapse interactions. Neuron. 2017;96:697–708. doi: 10.1016/j.neuron.2017.09.056. - DOI - PMC - PubMed
    1. Ramon y Cajal, S. Histology of the Nervous System of Man and Vertebrates (Oxford University Press, New York, 1897).

Publication types

MeSH terms