. 2018 Apr 24;9(1):1618.
doi: 10.1038/s41467-018-04053-7.

De novo main-chain modeling for EM maps using MAINMAST

Affiliations

De novo main-chain modeling for EM maps using MAINMAST

Genki Terashi et al. Nat Commun. .

Abstract

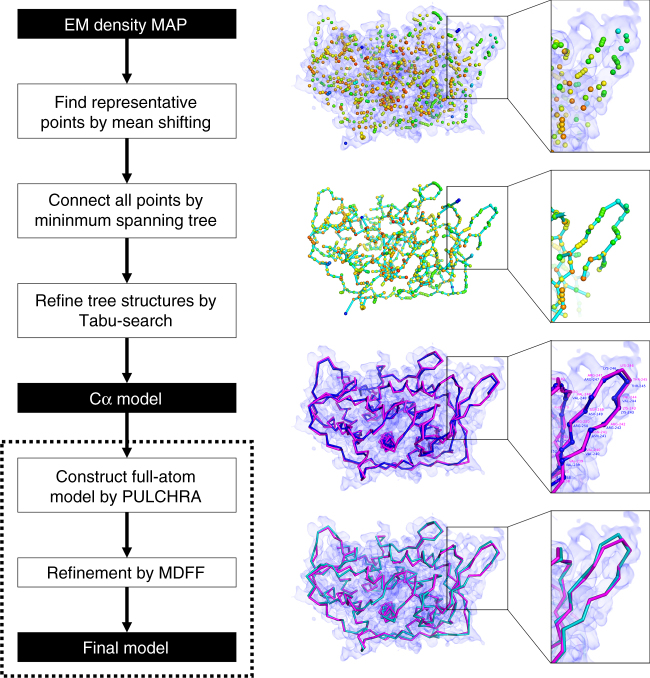
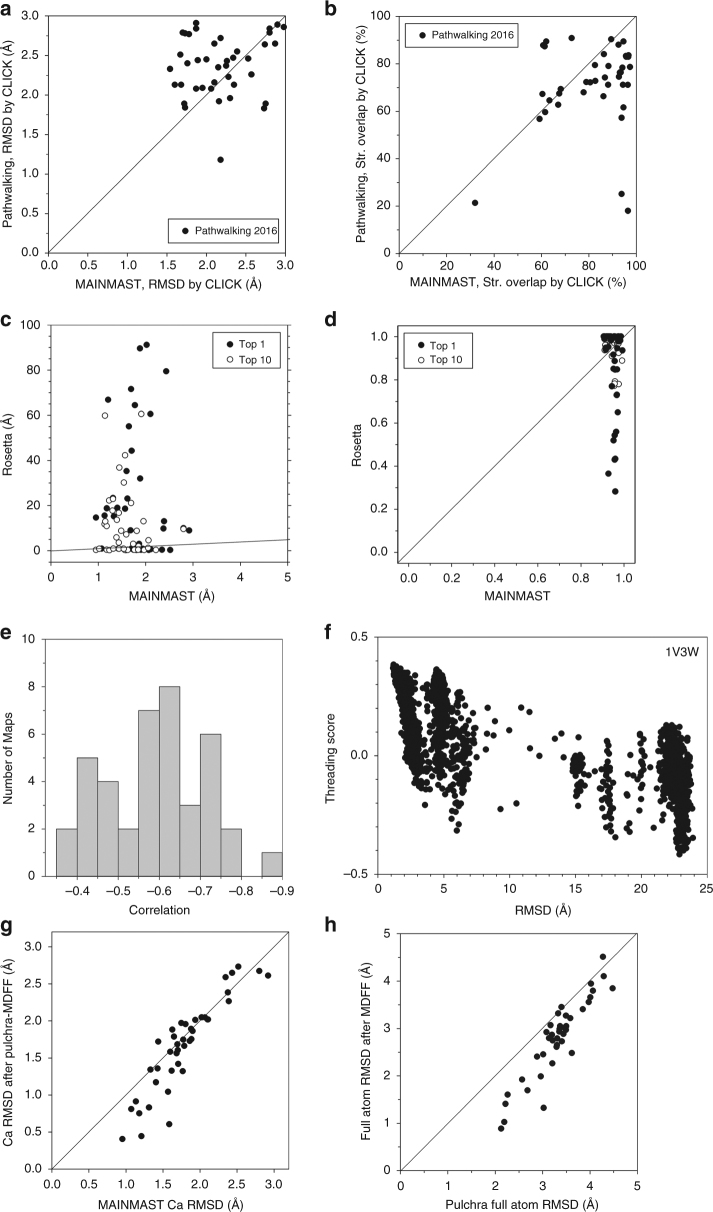
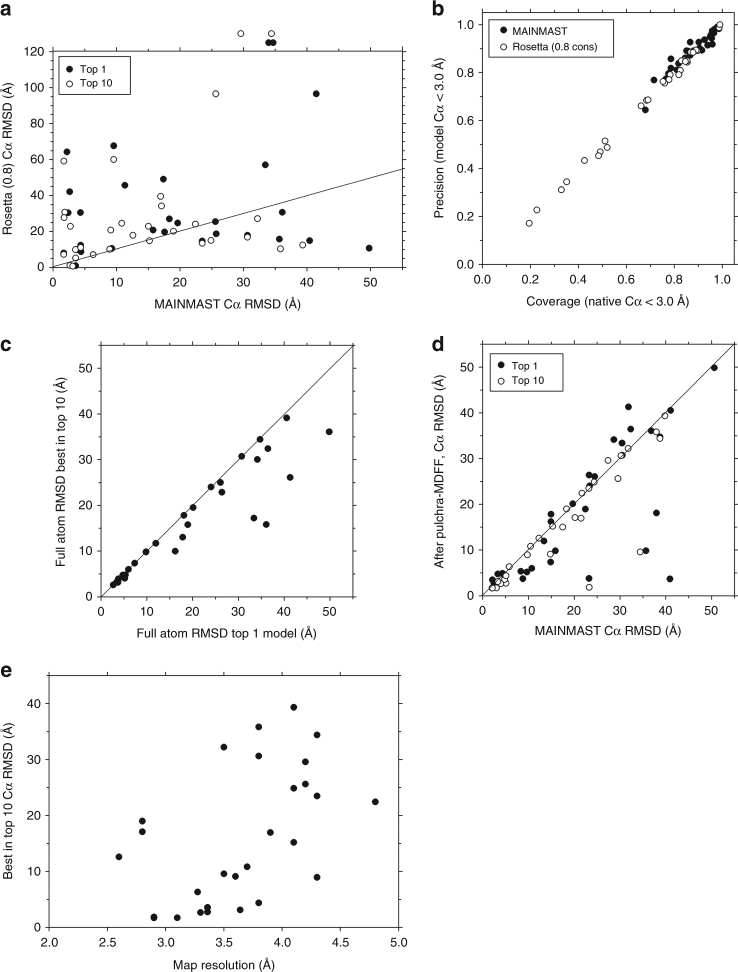
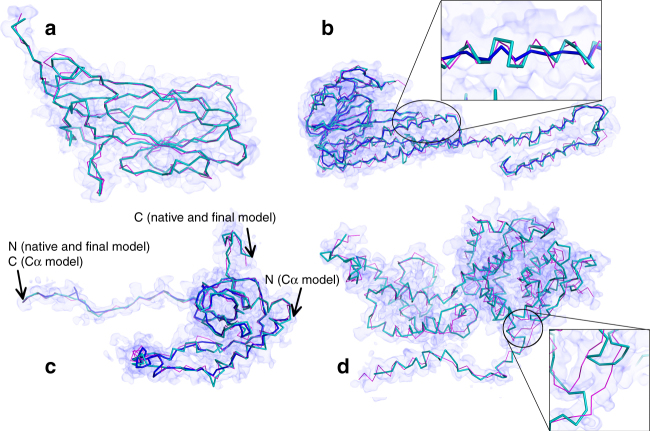
An increasing number of protein structures are determined by cryo-electron microscopy (cryo-EM) at near atomic resolution. However, tracing the main-chains and building full-atom models from EM maps of ~4-5 Å is still not trivial and remains a time-consuming task. Here, we introduce a fully automated de novo structure modeling method, MAINMAST, which builds three-dimensional models of a protein from a near-atomic resolution EM map. The method directly traces the protein's main-chain and identifies Cα positions as tree-graph structures in the EM map. MAINMAST performs significantly better than existing software in building global protein structure models on data sets of 40 simulated density maps at 5 Å resolution and 30 experimentally determined maps at 2.6-4.8 Å resolution. In another benchmark of building missing fragments in protein models for EM maps, MAINMAST builds fragments of 11-161 residues long with an average RMSD of 2.68 Å.


Conflict of interest statement

The authors declare no competing interests.

Figures

Fig. 1
Fig. 1
Flowchart of MAINMAST. Steps of the MAINMAST algorithm is illustrated with a modeling example for an EM density map of structural protein 5 of cytoplasmic polyhedrosis virus solved at a 2.9 Å resolution (EMD-6374). First, points with high local density are identified with the mean shift algorithm. The color scale of the points indicate density, blue to orange for low to high density. Identified local dense points are connected by minimum spanning tree (MST) (cyan). Using tabu-search, the initial MST is refined and a few thousands of alternative MSTs are generated. For each MST, the amino acid sequence of the query protein is mapped on the longest path in the tree by matching the volume of amino acids to the density of the local dense points (threading). Cα models from each MST are ranked with the density–volume matching (threading) score. In the third panel on the right, the blue chain represents a Cα model and the structure in magenta is the native structure. Selected Cα models are refined with a sequential application of PULCHRA and MDFF to obtain final full-atom models (turquoise)
Fig. 2
Fig. 2
Modeling results of the 40 simulated maps by MAINMAST in comparison with Pathwalking and Rosetta. a local RMSD and b structure overlap of the models by MAINMAST compared with Pathwalking models computed with the CLICK server. For the Pathwalking algorithm, data are taken from the publication in 2016. For the MAINMAST results, the model with the best threading score among the generated 2688 models were used. Structure overlap by CLICK in panel b is defined as the percentage of residues in a structure placed within 3.5 Å to residues in the other superimposed structure. c, d show comparison of the models by MAINMAST and Rosetta in terms of c the global RMSD and d the coverage, which is defined as the fraction of residues in a model that have some residues in the model within 2.0 Å. Solid /open circles, the highest scoring models/the best models among generated models were used for MAINMAST and Rosetta, respectively. Lines show y = x. e A histogram of correlation coefficients between the threading scores and RMSD of 2688 models generated by MAINMAST for the 40 EM maps. The correlation coefficient values are negative because the threading score is a high positive value for a near native model with a small RMSD. f correlation between the threading scores and RMSD values of models generated for 1V3W. The correlation coefficient is -0.767. g Comparison of Cα RMSDs of models before and after the full atom reconstruction and refinement using Pulchra and MDFF (g-scale used was 0.5) for the 40 maps. h Comparison of full-atom RMSDs of models before and after structure refinement by MDFF
Fig. 3
Fig. 3
Modeling results of the 30 experimental EM maps by MAINMAST. a Cα RMSD of the top scoring (solid circles) and the best RMSD model among the top 10 scoring models (empty circles) by MAINMAST in comparison with the Rosetta top scoring models. The refinement by Pulchra and MDFF were applied to the models. For Rosetta, results using 0.8 for the consensus fraction was used, because it showed better results than the default setting (Supplementary Fig. 3). The points above the frame indicate that Rosetta could not model these proteins while MAINMAST made full models at the RMSD values. b Comparison between MAINMAST and Rosetta (with a 0.8 consensus setting) in terms of coverage and precision of models. Coverage (precision) is defined as the fraction of Cα atoms in the native structure (the model) which are closer than 3.0 Å to any Cα atoms in the model (the native structure). c Comparison between the top scoring (Top 1) model and the best RMSD model among the top 10 scoring model for each of the 30 EM maps. d Comparison of MAINMAST models before and after the refinement by Pulchra and MDFF. Models before the refinement were selected by the threading score while the scoring function of MDFF was used after the refinement. e RMSD of the models (the best among the top 10 socring models) by MAINMAST after refinement relative to the map resolution
Fig. 4
Fig. 4
Examples of models generated by MAINMAST for experimental EM maps. The models were ranked first by the MDFF’s score. Structures in turquoise are computed by MAINMAST and structures in magenta are the native structure. a capsid protein of porcine circovirus at 2.9 Å resolution (EMD-6555). MAINMAST model: 2.4 Å RMSD. Coverage and precision were both 0.88. Coverage and precision are defined as the fraction of Cα atoms in the native and the model, respectively, which are closer than 2.0 Å to any Cα atoms of the counterpart. Rosetta models have RMSDs of 31.6 and 30.4 Å with the default and a 0.8 consensus setting, respectively. Cov: 0.36, Prec: 0.36. b magnesium channel CorA at 3.8 Å resolution (EMD-6551). MAINMAST model (turquoise), RMSD: 4.4 Å, Cov: 0.91, Prec. 0.92. blue, the main-chain model prior to PULCHRA/MDFF refinement, RMSD: 10.7 Å, Cov: 0.81, Prec: 0.84. Rosetta models, 20.4/12.3 Å RMSD, Cov: 0.75/0.79, and Prec: 0.75/0.79 with the default/a 0.8 consensus setting. c eL6 protein from yeast 60S ribosomal subunit, at 2.9 Å resolution (EMD-6478). MAINMAST model, RMSD: 2.6 Å, Cov: 0.90, Prec: 0.90; blue, the main-chain model prior to PULCHRA/MDFF, RMSD:40.9 Å, Cov: 0.73, Prec: 0.74. This large RMSD is due to the failure of scoring a model with the correct sequence orientation by the threading score. However, a model with the correct sequence orientation was selected by MDFF after refinement. Rosetta models, 25.6/42.0 Å RMSD, Cov: 0.63/0.42, and Prec: 0.63/0.42 with the default/a 0.8 consensus settings. d helical Measles virus nucleocapsid protein at a 4.3 Å resolution (EMD-2867). MAINMAST model, RMSD: 9.3 Å, Cov: 0.68, Prec: 0.68; Rosetta models, RMSD: 21.3/10.6 Å, Cov: 0.68/0.72, Prec: 0.68/0.72 with the default/a 0.8 consensus setting
Fig. 5
Fig. 5
Models with confidence level in colors. a F420-reducing hydrogenase α subunit at 3.36 Å resolution (EMD-2513). The top-scoring MAINMAST full-atom model after the refinement had an RMSD of 3.8 Å, a coverage of 0.92, and a precision of 0.91 while the Cα model before the refinement was at an RMSD of 4.3 Å, a coverage of 0.88, and a precision of 0.88. The color code shows confidence of residue positions, which was computed by the degree of consensus among top 100 MDFF score models with blue to orange for low to high confidence regions. When only the residues that had consensus positions (within 3.5 Å) for over 50 models were considered (orange regions; 129 out of 385 residues), the RMSD was 2.1 Å. b rotavirus VP6 capsid protein at 2.6 Å resolution (EMD-6272). MAINMAST modeled it at 17.6 Å RMSD, Cov: 0.87, and prec: 0.86. Consensus residue positions over 50 models (orange regions) had an RMSD of 4.6 Å (180 out of 397 residues)
Fig. 6
Fig. 6
Average accuracy of residue positions relative to the degree of consensus among top 100 models for the 30 real EM maps. Cα positions of top 1 scoring model of 28 experimental EM maps were compared from those from top 2 -99 models, which were ranked by the MDFF score. Two maps, EMD-3073 and EMD-8116 were excluded because the top 1 protein models generated for these two maps were exceptionally bad (RMSD: 40.42 Å and 49.78 Å, respectively). Consensus on the x-axis shows the fraction of the models that have a residue within 3.5 Å. Black circles, the average error of each Cα positions (the bar on the left) of top 1 scoring model relative to the consensus fraction. Triangles, the total number of residues in the 30 models (the bar on the right) that have a certain consensus value. It is evident that the quality of regions with a consensus of 0.5 or higher are modeled well, on average within less than 3.0 Å

Similar articles

Cited by

References

    1. Kuhlbrandt W. Cryo-EM enters a new era. Elife. 2014;3:e03678. doi: 10.7554/eLife.03678. - DOI - PMC - PubMed
    1. Nogales E. The development of cryo-EM into a mainstream structural biology technique. Nat. Methods. 2016;13:24–27. doi: 10.1038/nmeth.3694. - DOI - PMC - PubMed
    1. Bai XC, McMullan G, Scheres SH. How cryo-EM is revolutionizing structural biology. Trends Biochem Sci. 2015;40:49–57. doi: 10.1016/j.tibs.2014.10.005. - DOI - PubMed
    1. Velankar S, et al. PDBe: improved accessibility of macromolecular structure data from PDB and EMDB. Nucleic Acids Res. 2016;44:D385–D395. doi: 10.1093/nar/gkv1047. - DOI - PMC - PubMed
    1. Brown A, et al. Tools for macromolecular model building and refinement into electron cryo-microscopy reconstructions. Acta Crystallogr. D. Biol. Crystallogr. 2015;71:136–153. doi: 10.1107/S1399004714021683. - DOI - PMC - PubMed

Publication types