

Molecular basis of autotrophic vs mixotrophic growth in Chlorella sorokiniana
- PMID: 29691462
- PMCID: PMC5915390
- DOI: 10.1038/s41598-018-24979-8
Molecular basis of autotrophic vs mixotrophic growth in Chlorella sorokiniana
Abstract
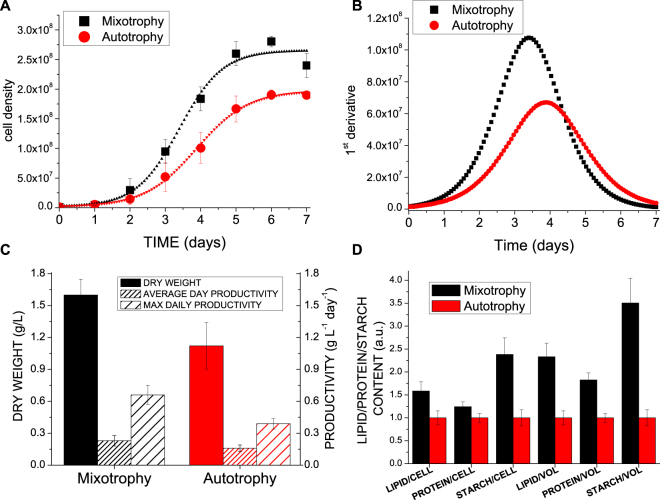
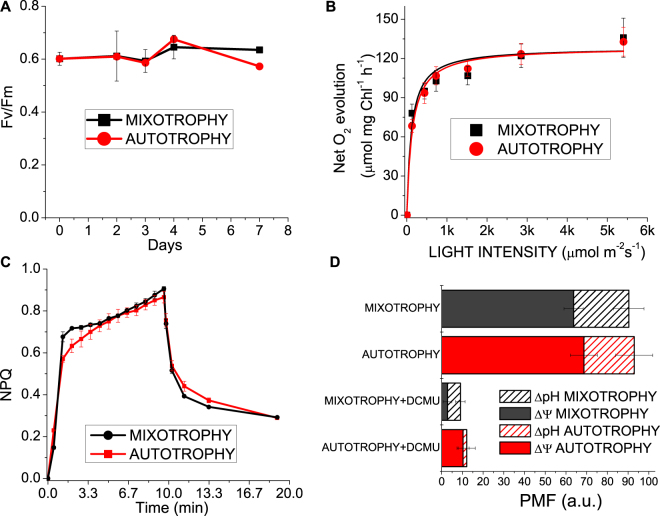
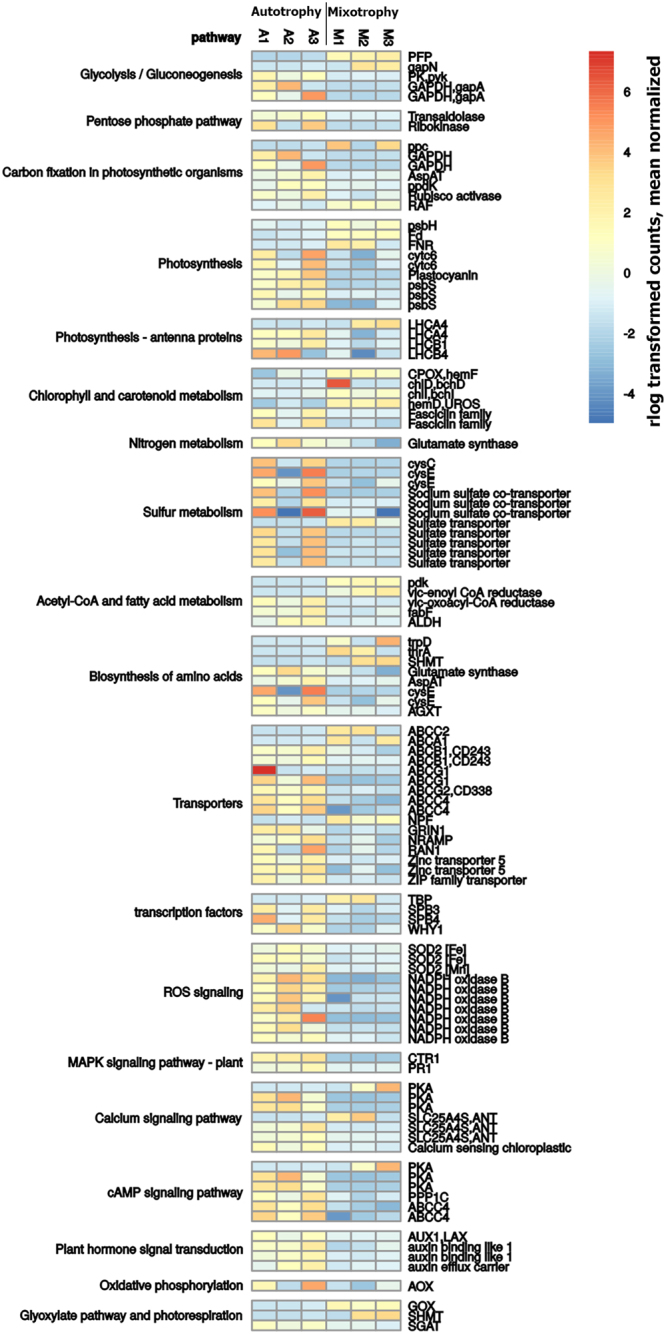
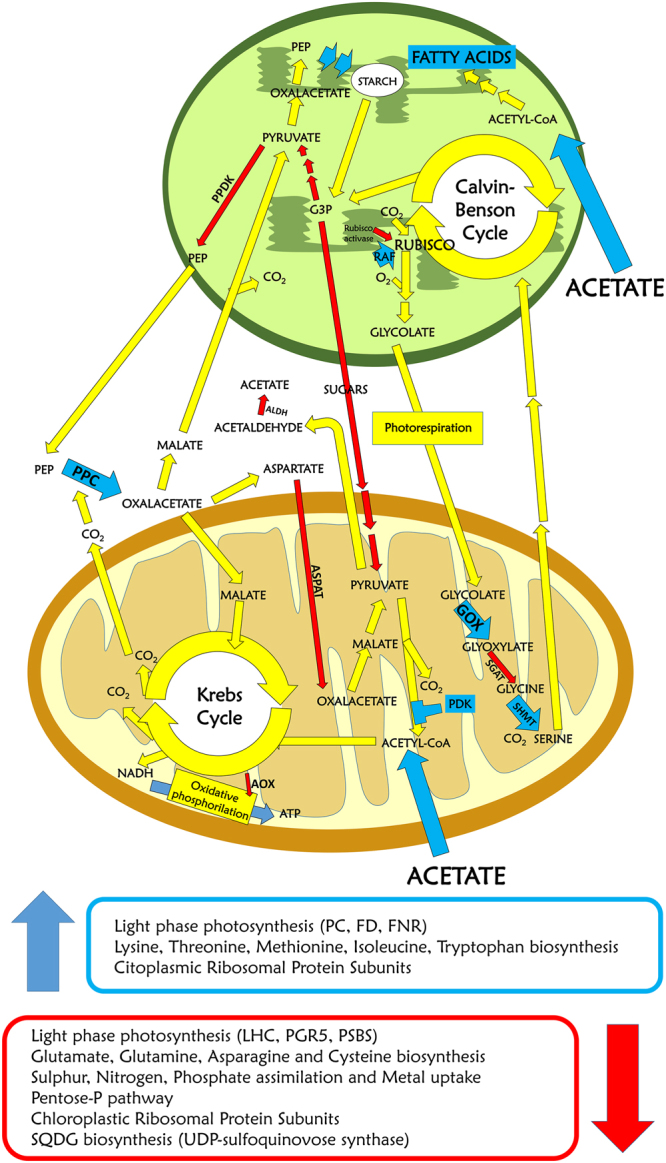
In this work, we investigated the molecular basis of autotrophic vs. mixotrophic growth of Chlorella sorokiniana, one of the most productive microalgae species with high potential to produce biofuels, food and high value compounds. To increase biomass accumulation, photosynthetic microalgae are commonly cultivated in mixotrophic conditions, adding reduced carbon sources to the growth media. In the case of C. sorokiniana, the presence of acetate enhanced biomass, proteins, lipids and starch productivity when compared to autotrophic conditions. Despite decreased chlorophyll content, photosynthetic properties were essentially unaffected while differential gene expression profile revealed transcriptional regulation of several genes mainly involved in control of carbon flux. Interestingly, acetate assimilation caused upregulation of phosphoenolpyruvate carboxylase enzyme, enabling potential recovery of carbon atoms lost by acetate oxidation. The obtained results allowed to associate the increased productivity observed in mixotrophy in C. sorokiniana with a different gene regulation leading to a fine regulation of cell metabolism.
Conflict of interest statement
The authors declare no competing interests.
Figures
Similar articles
-
Physiological and Ecological Aspects of Chlorella sorokiniana (Trebouxiophyceae) Under Photoautotrophic and Mixotrophic Conditions.Microb Ecol. 2018 Oct;76(3):791-800. doi: 10.1007/s00248-018-1170-8. Epub 2018 Mar 8. Microb Ecol. 2018. PMID: 29520451
-
The effect of mixotrophy on microalgal growth, lipid content, and expression levels of three pathway genes in Chlorella sorokiniana.Appl Microbiol Biotechnol. 2011 Aug;91(3):835-44. doi: 10.1007/s00253-011-3399-8. Epub 2011 Jun 23. Appl Microbiol Biotechnol. 2011. PMID: 21698379
-
Photorespiration participates in the assimilation of acetate in Chlorella sorokiniana under high light.New Phytol. 2016 Feb;209(3):987-98. doi: 10.1111/nph.13659. Epub 2015 Oct 6. New Phytol. 2016. PMID: 26439434
-
Improving carbohydrate production of Chlorella sorokiniana NIES-2168 through semi-continuous process coupled with mixotrophic cultivation.Biotechnol J. 2016 Aug;11(8):1072-81. doi: 10.1002/biot.201500270. Epub 2016 Jun 24. Biotechnol J. 2016. PMID: 27312599
-
Growth rate, organic carbon and nutrient removal rates of Chlorella sorokiniana in autotrophic, heterotrophic and mixotrophic conditions.Bioresour Technol. 2013 Sep;144:8-13. doi: 10.1016/j.biortech.2013.06.068. Epub 2013 Jun 27. Bioresour Technol. 2013. PMID: 23850820
Cited by
-
Enhanced β-carotene and Biomass Production by Induced Mixotrophy in Dunaliella salina across a Combined Strategy of Glycerol, Salinity, and Light.Metabolites. 2021 Dec 13;11(12):866. doi: 10.3390/metabo11120866. Metabolites. 2021. PMID: 34940624 Free PMC article.
-
Sequential Continuous Mixotrophic and Phototrophic Cultivation Might Be a Cost-Effective Strategy for Astaxanthin Production From the Microalga Haematococcus lacustris.Front Bioeng Biotechnol. 2021 Oct 5;9:740533. doi: 10.3389/fbioe.2021.740533. eCollection 2021. Front Bioeng Biotechnol. 2021. PMID: 34676203 Free PMC article.
-
Adaptation to life on land at high O2 via transition from ferredoxin-to NADH-dependent redox balance.Proc Biol Sci. 2019 Aug 28;286(1909):20191491. doi: 10.1098/rspb.2019.1491. Epub 2019 Aug 21. Proc Biol Sci. 2019. PMID: 31431166 Free PMC article.
-
Trophic state alters the mechanism whereby energetic coupling between photosynthesis and respiration occurs in Euglena gracilis.New Phytol. 2021 Nov;232(4):1603-1617. doi: 10.1111/nph.17677. Epub 2021 Sep 1. New Phytol. 2021. PMID: 34392544 Free PMC article.
-
Mixotrophic Growth of Chlorella sorokiniana on Acetate and Butyrate: Interplay Between Substrate, C:N Ratio and pH.Front Microbiol. 2021 Jul 2;12:703614. doi: 10.3389/fmicb.2021.703614. eCollection 2021. Front Microbiol. 2021. PMID: 34276636 Free PMC article.
References
Publication types
MeSH terms
Substances
Grants and funding
LinkOut - more resources
Full Text Sources
Other Literature Sources
