

Genome-wide association for testis weight in the diversity outbred mouse population
- PMID: 29691636
- PMCID: PMC6396879
- DOI: 10.1007/s00335-018-9745-8
Genome-wide association for testis weight in the diversity outbred mouse population
Abstract
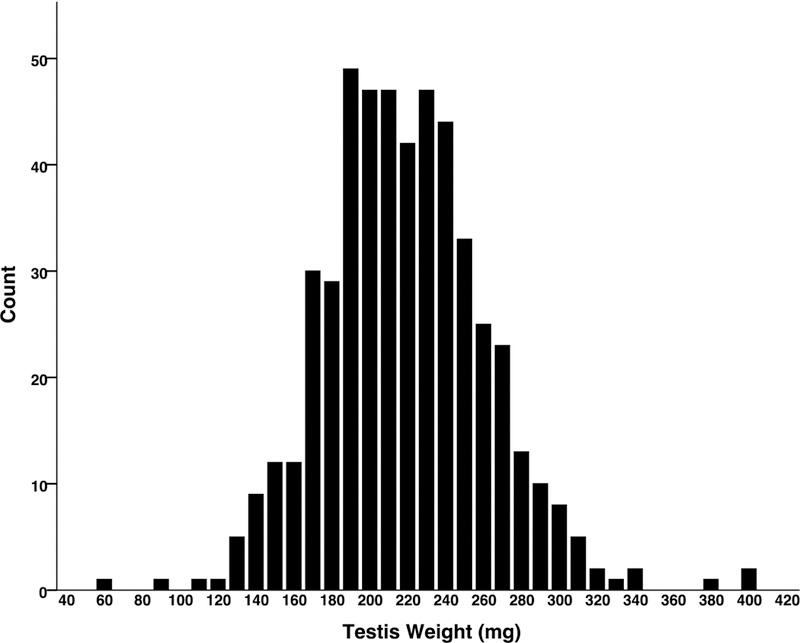
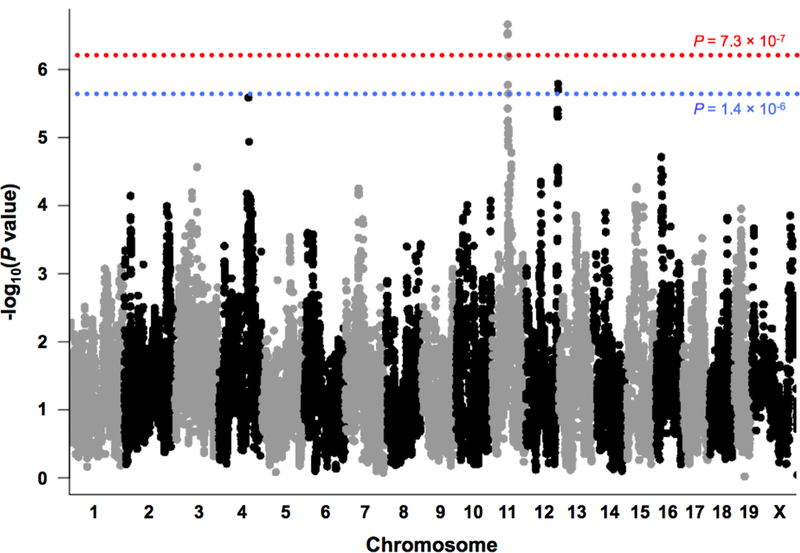
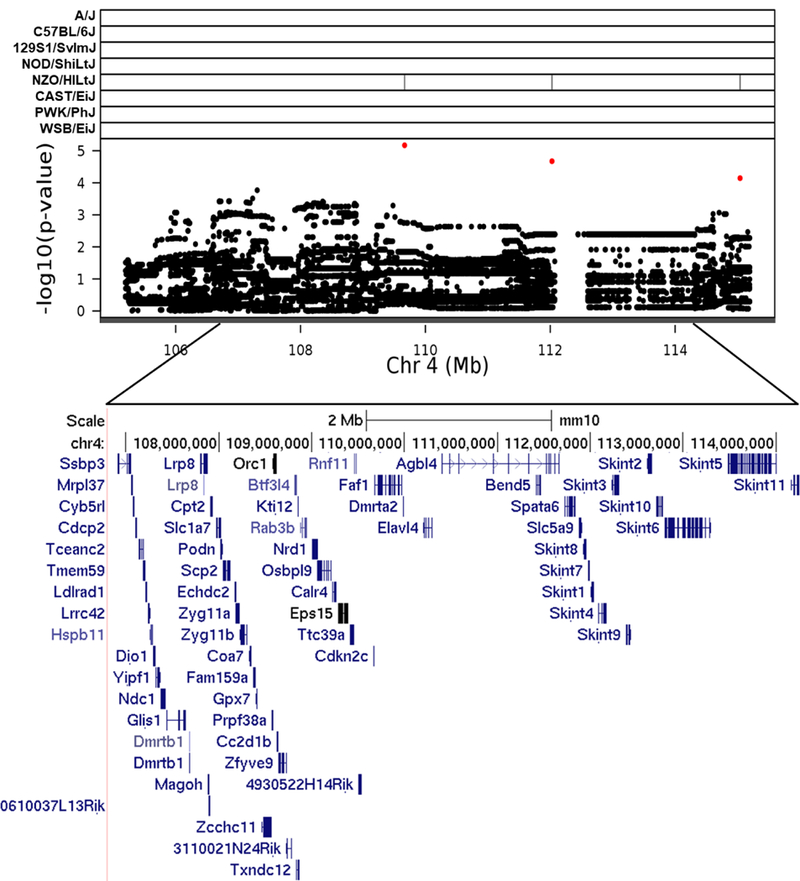
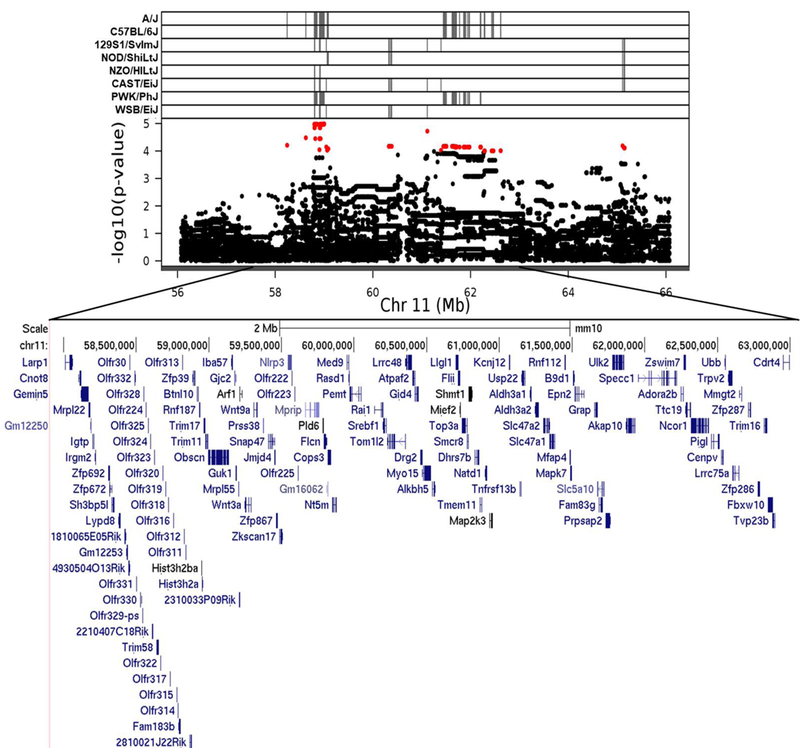
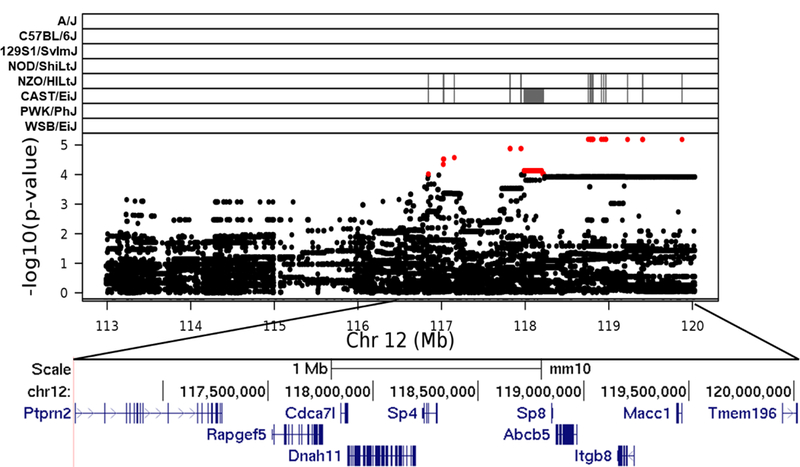
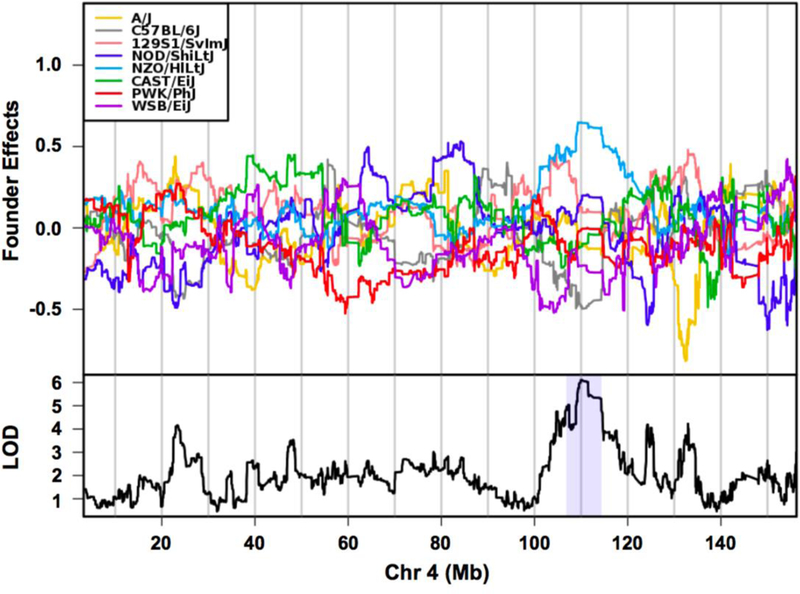
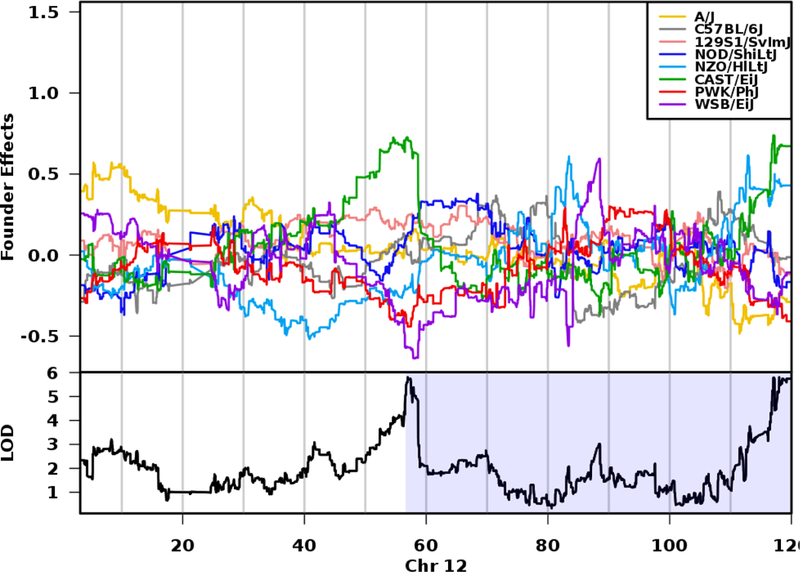
Testis weight is a genetically mediated trait associated with reproductive efficiency across numerous species. We sought to evaluate the genetically diverse, highly recombinant Diversity Outbred (DO) mouse population as a tool to identify and map quantitative trait loci (QTLs) associated with testis weight. Testis weights were recorded for 502 male DO mice and the mice were genotyped on the GIGAMuga array at ~ 143,000 SNPs. We performed a genome-wide association analysis and identified one significant and two suggestive QTLs associated with testis weight. Using bioinformatic approaches, we developed a list of candidate genes and identified those with known roles in testicular size and development. Candidates of particular interest include the RNA demethylase gene Alkbh5, the cyclin-dependent kinase inhibitor gene Cdkn2c, the dynein axonemal heavy chain gene Dnah11, the phospholipase D gene Pld6, the trans-acting transcription factor gene Sp4, and the spermatogenesis-associated gene Spata6, each of which has a human ortholog. Our results demonstrate the utility of DO mice in high-resolution genetic mapping of complex traits, enabling us to identify developmentally important genes in adult mice. Understanding how genetic variation in these genes influence testis weight could aid in the understanding of mechanisms of mammalian reproductive function.
Conflict of interest statement
Conflict of Interest
On behalf of all authors, the corresponding author states that there is no conflict of interest.
Figures

Similar articles
-
Commercially available outbred mice for genome-wide association studies.PLoS Genet. 2010 Sep 2;6(9):e1001085. doi: 10.1371/journal.pgen.1001085. PLoS Genet. 2010. PMID: 20838427 Free PMC article.
-
Genome-wide association mapping of ethanol sensitivity in the Diversity Outbred mouse population.Alcohol Clin Exp Res. 2022 Jun;46(6):941-960. doi: 10.1111/acer.14825. Epub 2022 Apr 17. Alcohol Clin Exp Res. 2022. PMID: 35383961 Free PMC article.
-
Genome-wide association study of behavioral, physiological and gene expression traits in outbred CFW mice.Nat Genet. 2016 Aug;48(8):919-26. doi: 10.1038/ng.3609. Epub 2016 Jul 4. Nat Genet. 2016. PMID: 27376237 Free PMC article.
-
Trait Mapping Approaches Through Association Analysis in Plants.Adv Biochem Eng Biotechnol. 2018;164:83-108. doi: 10.1007/10_2017_50. Adv Biochem Eng Biotechnol. 2018. PMID: 29511776 Review.
-
Strategies for mapping and cloning quantitative trait genes in rodents.Nat Rev Genet. 2005 Apr;6(4):271-86. doi: 10.1038/nrg1576. Nat Rev Genet. 2005. PMID: 15803197 Review.
Cited by
-
High-throughput sleep phenotyping produces robust and heritable traits in Diversity Outbred mice and their founder strains.Sleep. 2020 May 12;43(5):zsz278. doi: 10.1093/sleep/zsz278. Sleep. 2020. PMID: 32074270 Free PMC article.
-
17α-estradiol does not adversely affect sperm parameters or fertility in male mice: implications for reproduction-longevity trade-offs.Geroscience. 2023 Aug;45(4):2109-2120. doi: 10.1007/s11357-022-00601-8. Epub 2022 Jun 11. Geroscience. 2023. PMID: 35689785 Free PMC article.
-
Genes underlying the evolution of tetrapod testes size.BMC Biol. 2021 Aug 18;19(1):162. doi: 10.1186/s12915-021-01107-z. BMC Biol. 2021. PMID: 34407824 Free PMC article.
-
Genetic Diversity, Selection Signatures, and Genome-Wide Association Study Identify Candidate Genes Related to Litter Size in Hu Sheep.Int J Mol Sci. 2024 Aug 29;25(17):9397. doi: 10.3390/ijms25179397. Int J Mol Sci. 2024. PMID: 39273345 Free PMC article.
-
Reproductive genomics of the mouse: implications for human fertility and infertility.Development. 2023 Feb 15;150(4):dev201313. doi: 10.1242/dev.201313. Epub 2023 Feb 13. Development. 2023. PMID: 36779988 Free PMC article.
References
-
- Awata S, Heg D, Munehara H, & Kohda M (2006). Testis size depends on social status and the presence of male helpers in the cooperatively breeding cichlid Julidochromis ornatus. Behavioral Ecology, 17(3), 372–379.
-
- Beffert U, Farsian FN, Masiulis I, Hammer RE, Yoon SO, Giehl KM, & Herz J (2006). ApoE receptor 2 controls neuronal survival in the adult brain. Current biology, 16(24), 2446–2452. - PubMed
-
- Bolor H, Wakasugi N, Zhao WD, & Ishikawa A (2006). Detection of quantitative trait loci causing abnormal spermatogenesis and reduced testis weight in the small testis (Smt) mutant mouse. Experimental animals, 55(2), 97–108. - PubMed
Publication types
MeSH terms
Grants and funding
LinkOut - more resources
Full Text Sources
Other Literature Sources
Molecular Biology Databases
