

Early-life regional and temporal variation in filaggrin-derived natural moisturizing factor, filaggrin-processing enzyme activity, corneocyte phenotypes and plasmin activity: implications for atopic dermatitis
- PMID: 29691836
- PMCID: PMC6175251
- DOI: 10.1111/bjd.16691
Early-life regional and temporal variation in filaggrin-derived natural moisturizing factor, filaggrin-processing enzyme activity, corneocyte phenotypes and plasmin activity: implications for atopic dermatitis
Abstract
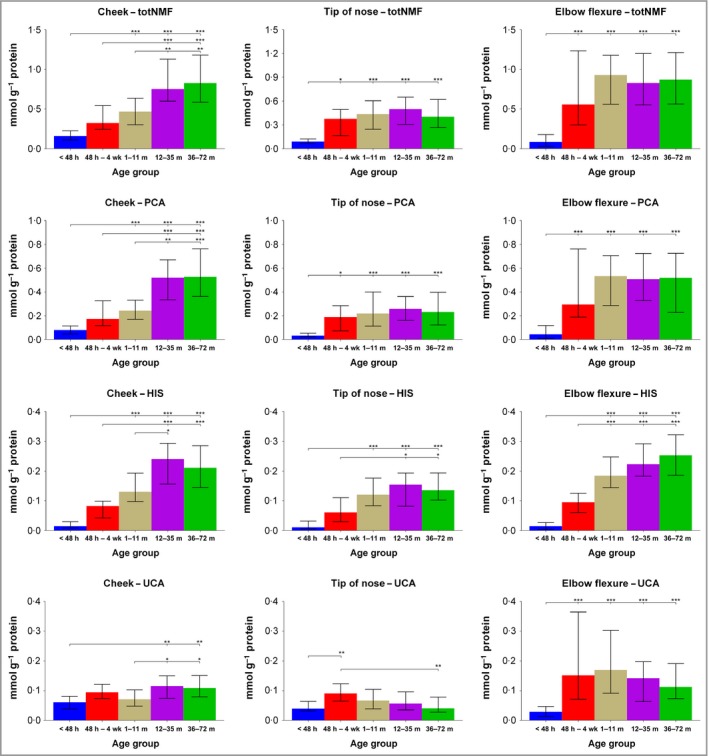
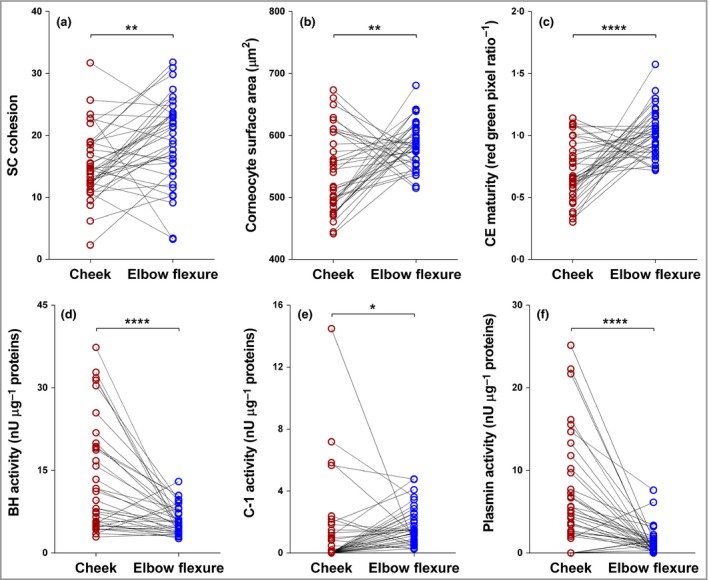
Background: Filaggrin is central to the pathogenesis of atopic dermatitis (AD). The cheeks are a common initiation site of infantile AD. Regional and temporal expression of levels of filaggrin degradation products [natural moisturizing factors (NMFs)], activities of filaggrin-processing enzymes [bleomycin hydrolase (BH) and calpain-1 (C-1)] and plasmin, and corneocyte envelope (CE) maturity in early life are largely unknown.
Objectives: We conducted a cross-sectional, observational study investigating regional and age-dependent variations in NMF levels, activity of proteases and CE maturity in stratum corneum (SC) from infants to determine whether these factors could explain the observed predilection sites for AD in early life.
Methods: We measured NMF using a tape-stripping method at seven sites in the SC of 129 children (aged < 12 months to 72 months) and in three sites in 56 neonates and infants (< 48 h to 3 months). In 37 of these neonates and infants, corneocyte size, maturity, BH, C-1 and plasmin activities were determined.
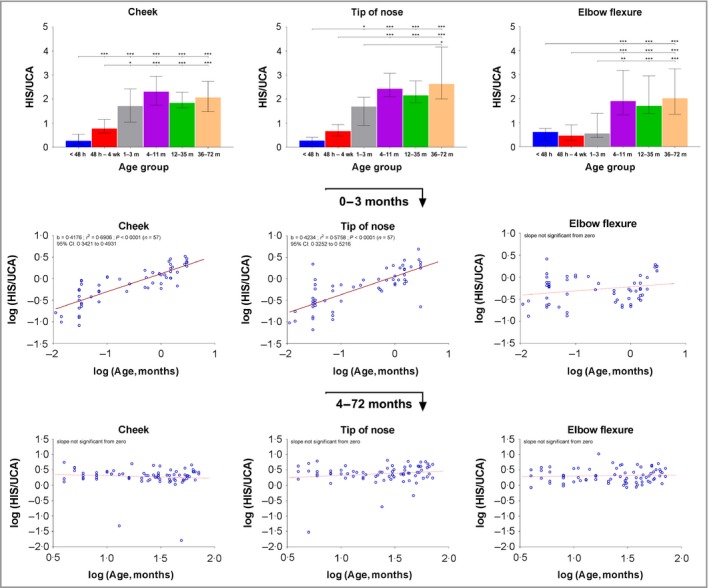
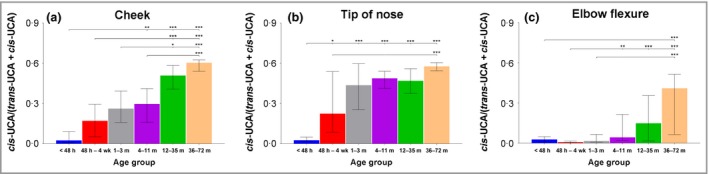
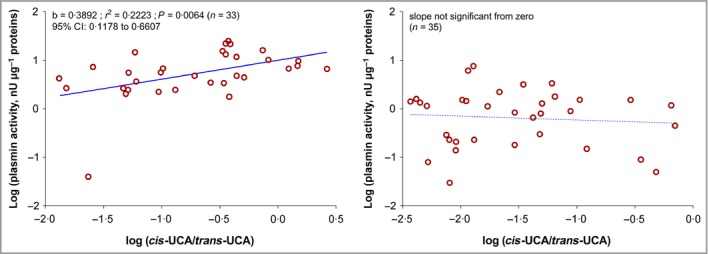
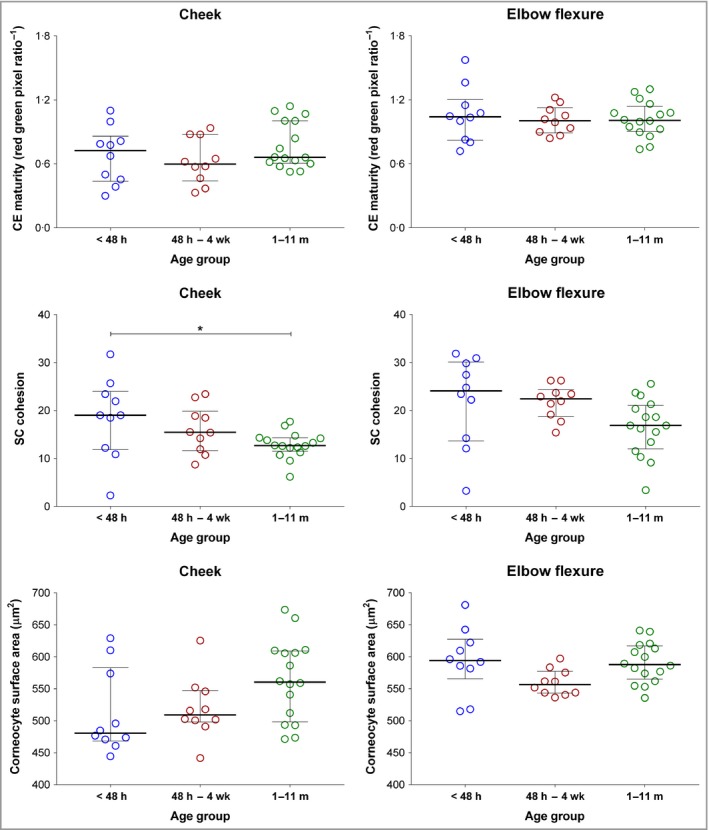
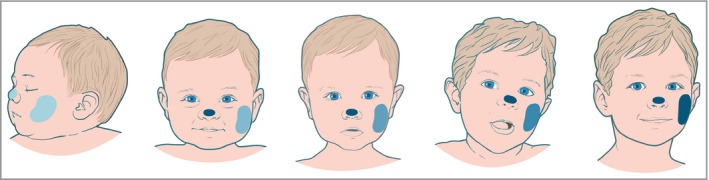
Results: NMF levels are low at birth and increase with age. Cheek SC, compared with elbow flexure and nasal tip, has the lowest NMF in the first year of life and is the slowest to reach stable levels. Cheek corneocytes remain immature. Plasmin, BH and C-1 activities are all elevated by 1 month of age in exposed cheek skin, but not in elbow skin.
Conclusions: Regional and temporal differences in NMF levels, CE maturity and protease activities may explain the predilection for AD to affect the cheeks initially and are supportive of this site as key for allergen priming in early childhood. These observations will help design early intervention and treatment strategies for AD.
© 2018 The Authors British Journal of Dermatology published by John Wiley & Sons Ltd on behalf of British Association of Dermatologists.
Figures
Comment in
-
The trade-off: evolutionary benefits of epidermal filaggrin deficiency on cheek skin came at the price of the atopic dermatitis epidemic.Br J Dermatol. 2018 Aug;179(2):235-236. doi: 10.1111/bjd.16806. Br J Dermatol. 2018. PMID: 30141546 No abstract available.
References
-
- Irvine AD, McLean WH, Leung DY. Filaggrin mutations associated with skin and allergic diseases. N Engl J Med 2011; 365:1315–27. - PubMed
-
- Weidinger S, Novak N. Atopic dermatitis. Lancet 2016; 387:1109–22. - PubMed
-
- Halkjaer LB, Loland L, Buchvald FF et al Development of atopic dermatitis during the first 3 years of life: the Copenhagen prospective study on asthma in childhood cohort study in high‐risk children. Arch Dermatol 2006; 142:561–6. - PubMed
-
- Yamamoto K. Studies on autosensitization dermatitis. Keio J Med 1961; 10:59–78. - PubMed
-
- Ludriksone L, Garcia Bartels N, Kanti V et al Skin barrier function in infancy: a systematic review. Arch Dermatol Res 2014; 306:591–9. - PubMed
Publication types
MeSH terms
Substances
LinkOut - more resources
Full Text Sources
Other Literature Sources
Miscellaneous
