. 2018 Apr 24;11(527):eaaq1616.
doi: 10.1126/scisignal.aaq1616.

A defect in KCa3.1 channel activity limits the ability of CD8+ T cells from cancer patients to infiltrate an adenosine-rich microenvironment

Affiliations

A defect in KCa3.1 channel activity limits the ability of CD8+ T cells from cancer patients to infiltrate an adenosine-rich microenvironment

Ameet A Chimote et al. Sci Signal. .

Abstract

The limited ability of cytotoxic T cells to infiltrate solid tumors hampers immune surveillance and the efficacy of immunotherapies in cancer. Adenosine accumulates in solid tumors and inhibits tumor-specific T cells. Adenosine inhibits T cell motility through the A2A receptor (A2AR) and suppression of KCa3.1 channels. We conducted three-dimensional chemotaxis experiments to elucidate the effect of adenosine on the migration of peripheral blood CD8+ T cells from head and neck squamous cell carcinoma (HNSCC) patients. The chemotaxis of HNSCC CD8+ T cells was reduced in the presence of adenosine, and the effect was greater on HNSCC CD8+ T cells than on healthy donor (HD) CD8+ T cells. This response correlated with the inability of CD8+ T cells to infiltrate tumors. The effect of adenosine was mimicked by an A2AR agonist and prevented by an A2AR antagonist. We found no differences in A2AR expression, 3',5'-cyclic adenosine monophosphate abundance, or protein kinase A type 1 activity between HNSCC and HD CD8+ T cells. We instead detected a decrease in KCa3.1 channel activity, but not expression, in HNSCC CD8+ T cells. Activation of KCa3.1 channels by 1-EBIO restored the ability of HNSCC CD8+ T cells to chemotax in the presence of adenosine. Our data highlight the mechanism underlying the increased sensitivity of HNSCC CD8+ T cells to adenosine and the potential therapeutic benefit of KCa3.1 channel activators, which could increase infiltration of these T cells into tumors.


Figures

Fig. 1
Fig. 1. HNSCC CD8+ T cells exhibit reduced chemotaxis in the presence of adenosine
(A and B) Trajectories of CD8+ T cells migrating along either a CXCL12 gradient (green triangles) or a combination gradient of CXCL12 with adenosine (ADO, blue triangles) in a representative HD (A) and HNSCC patient (B). Trajectories of at least 15–20 cells are shown for each condition and the starting point of each cell trajectory is artificially set to the same origin. The red triangles represent Y-COM. (C and D) Y-COM values for cells migrating along either a CXCL12 gradient or a combination gradient of CXCL12 with adenosine in HDs (C; n=7 donors) and HNSCC patients (D; n=16 patients). (E) Percentage inhibition in the Y-COM values in the presence of CXCL12 and adenosine (values shown in C and D) in HD (n=7 donors) and HNSCC (n=16 patients). Horizontal red line represents mean values for each group. Data in C and D were analyzed by paired Student’s t-test and in panel E by Mann-Whitney rank sum test.
Fig. 2
Fig. 2. Tumor infiltration is dependent on the sensitivity of circulating CD8+ T cells to adenosine
(A) Immunohistochemistry of CD8 (top) and CD73 (bottom) expression (brown signal) in representative HNSCC tumor tissues showing low and high infiltration by CD8+ T cells and low and high CD73 expression (Table S1). Scale bar = 100 µm. (B) Bar graph showing the number of CD8+ T cells (cells/mm2) within the tumor region in 16 HNSCC tumors. Please note that donor HNC-52 has a mean CD8+ T cell infiltration value of 5 cells/mm2. The broken red line represents the median value for the 16 HNSCC patients. The tumors with CD8+ T cell infiltration above the median value were considered to be “well-infiltrated” (Referred as “High” in Table S1), whereas the tumors with CD8+ T cell infiltration below the median value were considered to be “poorly-infiltrated” (Referred as “Low” in Table S1). The bars represent mean ± SEM. (C) Correlation between CD8+ T cell infiltration and percentage reduction of the Y-COM values in the presence of CXCL12 and adenosine (values shown in Fig. 1E) in 9 HNSCC patients that were scored as CD73high (see Table S1). Correlation was measured by Spearman rank order correlation test (p = 0.0301, correlation coefficient, ρ = −0.700).
Fig. 3
Fig. 3. A2AR mediates the suppressive effect of adenosine on the chemotaxis of HNSCC CD8+ T cells
(A) Y-COM values for HNSCC CD8+ T cells migrating along either a CXCL12 gradient (n=6 patients), a combination gradient of CXCL12 with CGS21680 (n=6 patients), or CXCL12 with adenosine (ADO, n=4 patients). (B) Percentage inhibition in the Y-COM values for each individual experiment shown in (A) after incubation with CGS21680 or adenosine. Horizontal red lines represent mean values for each group. (C) Y-COM values for HNSCC CD8+ T cells pretreated with or without 1 µM SCH58261 migrating toward CXCL12 in the presence of adenosine. Untreated CD8+ T cells in a CXCL12 gradient were used as controls (n=5 patients). (D) Percentage inhibition in the Y-COM values by adenosine for each of the donors shown in (C) with or without SCH58261 pretreatment. Horizontal red line represents mean values for each group. Data in A and C were analyzed by one-way repeated measures ANOVA (p=0.010 for A, and p=0.001 for C); in B and D by t-test.
Fig. 4
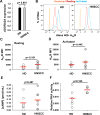
Fig. 4. A2AR expression and A2AR signaling are not altered in HNSCC CD8+ T cells
(A) ADORA2A expression in activated HD and HNSCC CD8+ T cells was quantified by RT-qPCR. Data are the fold-change in ADORA2A expression relative to GAPDH expression. The data were normalized to the mean ADORA2A expression in HD. Data are mean ± SEM for from 4 HD and 5 HNSCC patients. (B) Representative flow cytometry histograms showing A2AR expression in resting and activated CD8+ T cells from HD and HNSCC. (C–D) Mean fluorescence intensity (MFI) of A2AR measured in resting (C) and activated (D) CD8+ T cells from HD (n=6 donors) and HNSCC patients (n=7 patients). (E) cAMP concentration in CD8+ T cells from HD (n=7 donors) and HNSCC patients (n=7 patients). (F) Relative PKA activity in CD8+ T cells from HD (n=3 donors) and HNSCC patients (n=4 patients). Horizontal red line represents mean values for each group. Data in C, D and F were analyzed by Mann-Whitney rank sum test; data in A and E were analyzed by t-test.
Fig. 5
Fig. 5. KCa3.1 channel activity is reduced in HNSCC CD8+ T cells
(A) Representative KCa3.1 currents in CD8+ T cells recorded in whole-cell voltage clamp configuration from a HD and HNSCC patient. Currents were normalized for the maximum current at +40 mV to ease comparison of the KCa3.1 conductance at hyperpolarizing voltages. (B) KCa3.1 conductance (normalized to cell capacitance, G/C) measured in activated CD8+ T cells from HD (n=30 cells, 6 donors) and HNSCC patients (n= 21 cells, 4 patients). (C) Kv1.3 channel current density measured in activated CD8+ T cells from HD (n=25 cells, 5 donors) and HNSCC patients (n= 21 cells, 4 patients). For B and C, the data are normalized to values measured in activated CD8+ T cells from HD and the bars represent mean ± SEM. (D) Representative flow cytometry histograms showing KCa3.1 expression in resting and activated CD8+ T cells from HD and HNSCC patients. (E) Mean fluorescence intensity (MFI) of KCa3.1 measured in resting and activated CD8+ T cells from HD (n=6 donors) and HNSCC patients (n=7 patients). (F) KCa3.1 MFI in activated CD8+ T cells from HD (n=6 donors) and HNSCC (n= 7 patients). Horizontal red line represents mean values for each group. Data in B, C and F were analyzed by Mann-Whitney rank sum test; E by paired t-test.
Fig. 6
Fig. 6. Activation of KCa3.1 channels restores the chemotaxis of HNSCC CD8+ T cells in the presence of adenosine
(A) KCa3.1 channel conductance in the presence or absence of 100 µM 1-EBIO was measured in activated CD8+ T cells from HD (n=17 cells, 4 donors) and HNSCC patients (n= 24 cells, 5 patients). The data were normalized to untreated (no 1-EBIO) activated cells from HD. The data are mean ± SEM. (B) Y-COM values calculated for HNSCC CD8+ T cells migrating along either a CXCL12 gradient or a combination gradient of CXCL12 with adenosine with or without preincubation with 20 µM 1-EBIO (n=5 patients). (C) Percentage inhibition in the Y-COM values (B) of the cells pretreated with 1-EBIO. Horizontal red line represents mean values for each group. Data in A were analyzed by two-way ANOVA; whereas data in B were analyzed with one-way repeated measures ANOVA (p=0.009) and C with paired t-test.

References

    1. Fang J, Li X, Ma D, Liu X, Chen Y, Wang Y, Lui VWY, Xia J, Cheng B, Wang Z. Prognostic significance of tumor infiltrating immune cells in oral squamous cell carcinoma. BMC Cancer. 2017;17:375. - PMC - PubMed
    1. De Meulenaere A, Vermassen T, Aspeslagh S, Zwaenepoel K, Deron P, Duprez F, Rottey S, Ferdinande L. Prognostic markers in oropharyngeal squamous cell carcinoma: focus on CD70 and tumour infiltrating lymphocytes. Pathology. 2017;49:397–404. - PubMed
    1. Balermpas P, Rödel F, Weiss C, Rödel C, Fokas E. Tumor-infiltrating lymphocytes favor the response to chemoradiotherapy of head and neck cancer. OncoImmunology. 2014;3:e27403. - PMC - PubMed
    1. Kershaw MH, Westwood JA, Darcy KP. Gene-engineered T cells for cancer therapy. Nat Rev Cancer. 2013;13:525–541. - PubMed
    1. Beavis PA, Milenkovski N, Henderson MA, John LB, Allard B, Loi S, Kershaw MH, Stagg J, Darcy PK. Adenosine Receptor 2A Blockade Increases the Efficacy of Anti-PD-1 through Enhanced Antitumor T-cell Responses. Cancer Immunol Res. 2015;3:506–517. - PubMed

Publication types

MeSH terms

Substances