

Comparison of MDCT, MRI and MRI with diffusion-weighted imaging in evaluation of focal renal lesions: The defender, challenger, and winner!
- PMID: 29692523
- PMCID: PMC5894314
- DOI: 10.4103/ijri.IJRI_40_17
Comparison of MDCT, MRI and MRI with diffusion-weighted imaging in evaluation of focal renal lesions: The defender, challenger, and winner!
Abstract
Purpose: To compare the diagnostic performance of multidetector computed tomography (MDCT), magnetic resonance imaging (MRI), and MRI with diffusion-weighted imaging (DWI) in the characterization of focal renal lesions. We also compared MDCT and MRI in the staging of renal cell carcinoma (RCC).
Materials and methods: One hundred and twenty adult patients underwent MDCT (40-row and 128-row scanners), MRI (at 1.5 T), and DWI (at b-values of 0 and 500 s/mm2) for characterization of 225 renal lesions. There were 65 malignant neoplasms (44 RCCs), 25 benign neoplasms, 25 abscesses, 45 pseudotumors, 15 hemorrhagic cysts, and 50 benign cysts. A composite gold standard including histology, typical imaging criteria, and follow-up imaging was employed. To determine the diagnostic performance of imaging modalities, area-under-curve (AUC) was calculated by receiver-operating-characteristic analysis and compared. Fisher's exact test was used to compare the diagnostic accuracies and confidence levels with MDCT, MRI, and MRI + DWI. Cross-tabulation was used to assess the precision of MDCT and MRI in RCC staging.
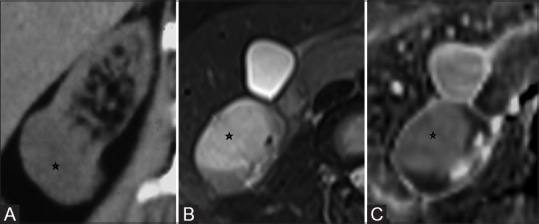
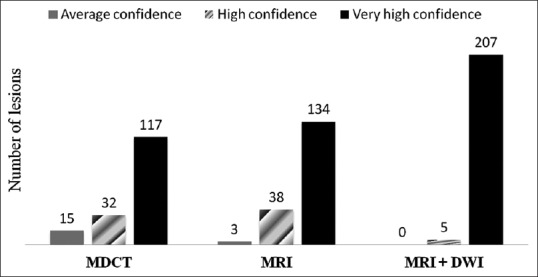
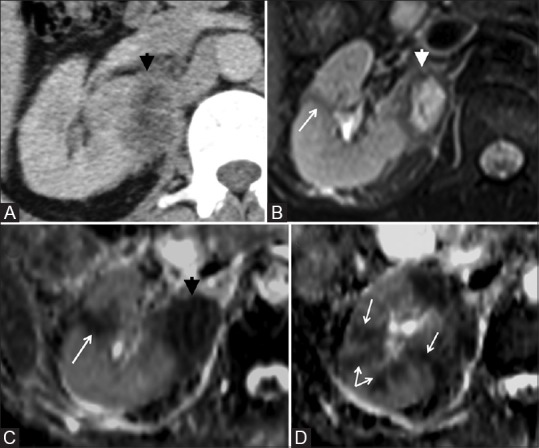
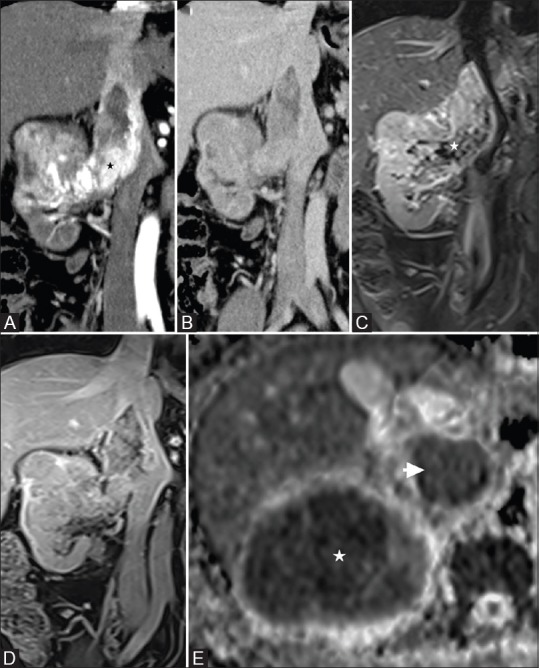
Results: AUC for MDCT (0.834) and MRI (0.841) in the classification of benign and malignant lesions were within corresponding 95% confidence interval (CI) (P = 0.88) whereas MRI + DWI had significantly better performance (AUC 0.968, P = 0.0002 and 0.0004, respectively). Both CT and MRI had low specificity (66.9% and 68.8%, respectively), which increased substantially with DWI (93.8%) owing to correct diagnosis of pseudotumors. MRI was superior to CT in diagnosing necrotic RCC and hemorrhagic cysts. MRI + DWI had the highest accuracy (94.2%) in assigning the definitive diagnosis and 97.6% lesions were diagnosed with very high confidence, significantly better than CT and MRI. Both CT and MRI had the same accuracy (86.1%) in RCC staging and evaluation of intravascular thrombi.
Conclusions: Characterization of renal lesions was most accurate with MRI + DWI. The latter is also the most suitable modality in diagnosing pseudotumors and evaluating patients with renal dysfunction. CT and MRI were equivalent in RCC staging.
Keywords: Contrast media; MRI; diffusion-weighted MRI; focal renal lesion; multidetector CT; renal cell carcinoma.
Conflict of interest statement
There are no conflicts of interest.
Figures

Similar articles
-
Diagnosis of peritoneal dissemination: comparison of 18F-FDG PET/CT, diffusion-weighted MRI, and contrast-enhanced MDCT.AJR Am J Roentgenol. 2011 Feb;196(2):447-53. doi: 10.2214/AJR.10.4687. AJR Am J Roentgenol. 2011. PMID: 21257899
-
Prospective comparison of 3T MRI with diffusion-weighted imaging and MDCT for the preoperative TNM staging of gastric cancer.J Magn Reson Imaging. 2015 Mar;41(3):814-21. doi: 10.1002/jmri.24586. Epub 2014 Feb 14. J Magn Reson Imaging. 2015. PMID: 24677322
-
Magnetic resonance with diffusion-weighted imaging improves assessment of focal liver lesions in patients with potentially resectable pancreatic cancer on CT.Eur Radiol. 2018 Aug;28(8):3484-3493. doi: 10.1007/s00330-017-5258-1. Epub 2018 Jan 19. Eur Radiol. 2018. PMID: 29352379
-
18F-FDG PET/CT and whole-body MRI diagnostic performance in M staging for non-small cell lung cancer: a systematic review and meta-analysis.Eur Radiol. 2020 Jul;30(7):3641-3649. doi: 10.1007/s00330-020-06703-1. Epub 2020 Mar 3. Eur Radiol. 2020. PMID: 32125513
-
Diagnostic test accuracy of ADC values for identification of clear cell renal cell carcinoma: systematic review and meta-analysis.Eur Radiol. 2020 Jul;30(7):4023-4038. doi: 10.1007/s00330-020-06740-w. Epub 2020 Mar 6. Eur Radiol. 2020. PMID: 32144458 Free PMC article.
Cited by
-
Differential Diagnostic Challenges in the COVID-19 Pandemic: Renal Abscess After SARS-CoV-2 Infection in a Young Adolescent.Am J Case Rep. 2022 Mar 13;23:e935190. doi: 10.12659/AJCR.935190. Am J Case Rep. 2022. PMID: 35279666 Free PMC article.
-
Renal Cell Carcinoma Ablation: Preprocedural, Intraprocedural, and Postprocedural Imaging.Radiol Imaging Cancer. 2019 Nov 29;1(2):e190002. doi: 10.1148/rycan.2019190002. eCollection 2019 Nov. Radiol Imaging Cancer. 2019. PMID: 33778679 Free PMC article. Review.
-
Case Report: Robot-assisted laparoscopic nephron-sparing surgery for a renal abscess mimicking a tumor.Front Oncol. 2022 Oct 31;12:1027571. doi: 10.3389/fonc.2022.1027571. eCollection 2022. Front Oncol. 2022. PMID: 36387115 Free PMC article.
-
Hemorrhagic Renal Cyst, a Case Report.J Educ Teach Emerg Med. 2020 Jan 15;5(1):V1-V3. doi: 10.21980/J8C92V. eCollection 2020 Jan. J Educ Teach Emerg Med. 2020. PMID: 37465604 Free PMC article.
-
An overview of non-invasive imaging modalities for diagnosis of solid and cystic renal lesions.Med Biol Eng Comput. 2020 Jan;58(1):1-24. doi: 10.1007/s11517-019-02049-z. Epub 2019 Nov 21. Med Biol Eng Comput. 2020. PMID: 31748942 Review.
References
-
- Hallscheidt PJ, Bock M, Riedasch G, Zuna I, Schoenberg SO, Soder M, et al. Diagnostic accuracy of staging renal cell carcinomas using multidetector-row computed tomography and magnetic resonance imaging: A prospective study with histopathologic correlation. J Comput Assist Tomogr. 2004;28:333–9. - PubMed
-
- Prasad SR, Dalrymple NC, Surabhi VR. Cross-sectional imaging evaluation of renal masses. Radiol Clin North Am. 2008;46:95–111. - PubMed
-
- Walter C, Kruessell M, Gindele A, Brochhagen HG, Gossmann A, Landwehr P. Imaging of renal lesions: Evaluation of fast MRI and helical CT. Br J Radiol. 2003;76:696–703. - PubMed
-
- Hallscheidt PJ, Fink C, Haferkamp A, Bock M, Luburic A, Zuna I, et al. Preoperative staging of renal cell carcinoma with inferior vena cava thrombus using multidetector CT and MRI: Prospective study with histopathological correlation. J Comput Assist Tomogr. 2005;29:64–8. - PubMed
LinkOut - more resources
Full Text Sources
Other Literature Sources