

Hemolysis area: A new parameter of erythrocyte osmotic fragility for screening of thalassemia trait
- PMID: 29692590
- PMCID: PMC5896191
- DOI: 10.4103/JLP.JLP_136_17
Hemolysis area: A new parameter of erythrocyte osmotic fragility for screening of thalassemia trait
Abstract
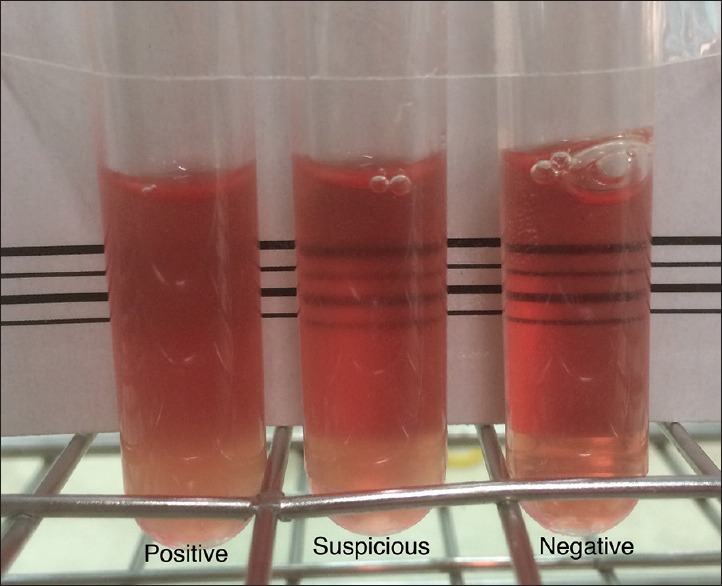
Background: One-tube osmotic fragility test (OFT) is widely used for screening thalassemia traits. Interobserver variation may occur with 0.36% NaCl-based OFT due to the naked eye result reading style.
Purpose: The purpose of this study was to establish and evaluate the novel numerical OFT-based parameter, so-called hemolysis area (HA), in screening thalassemia traits.
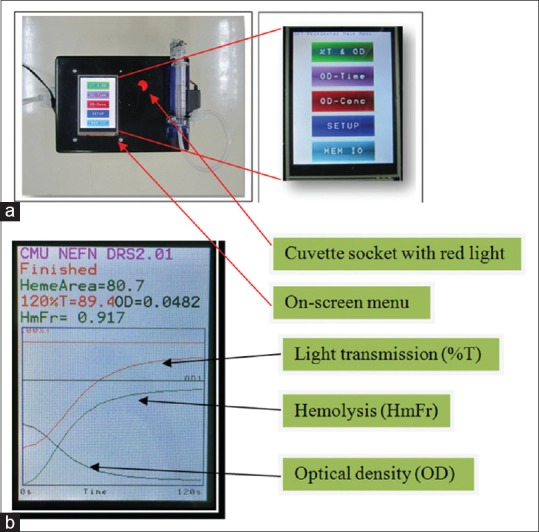
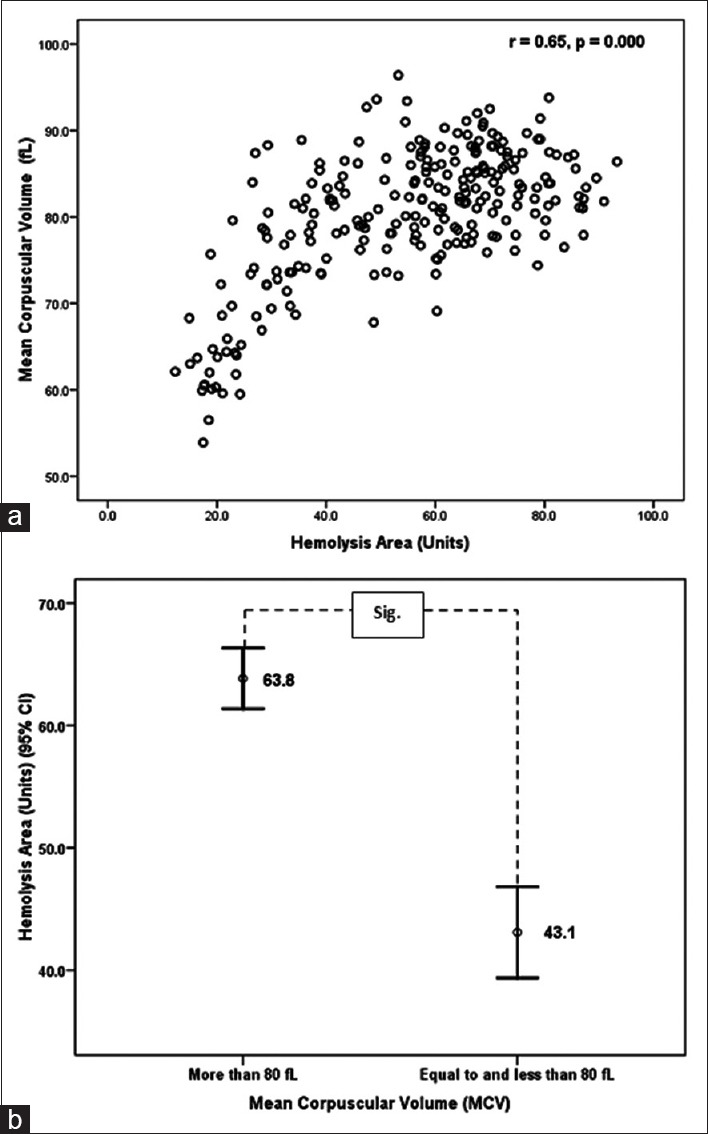
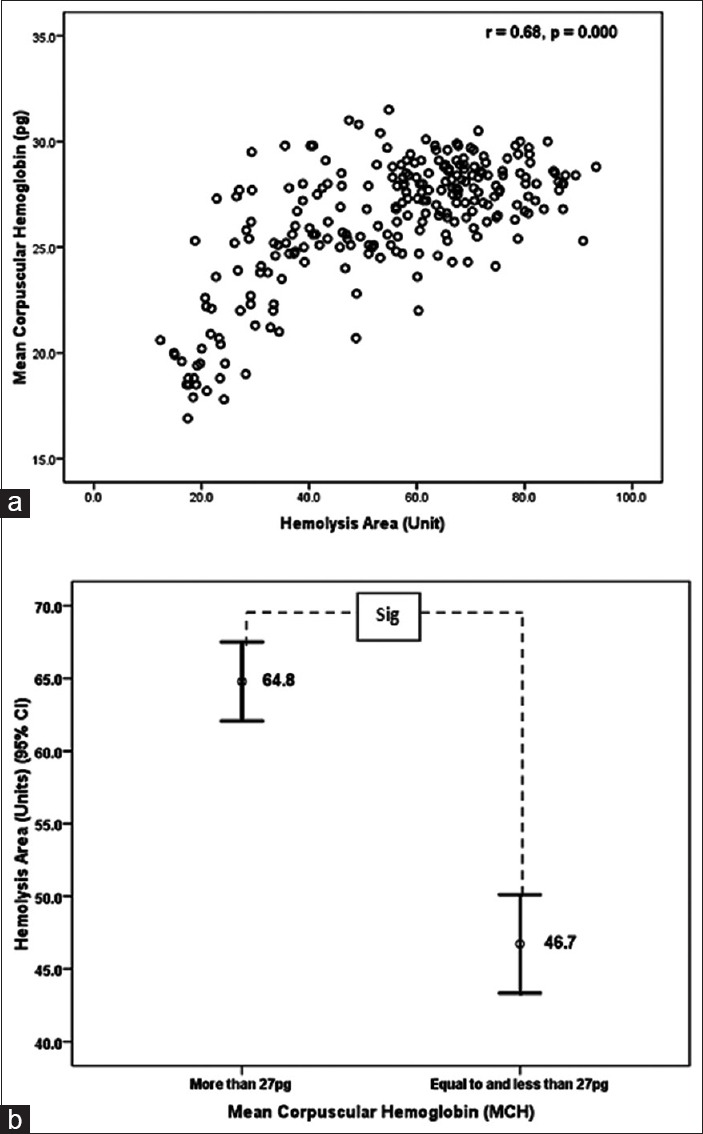
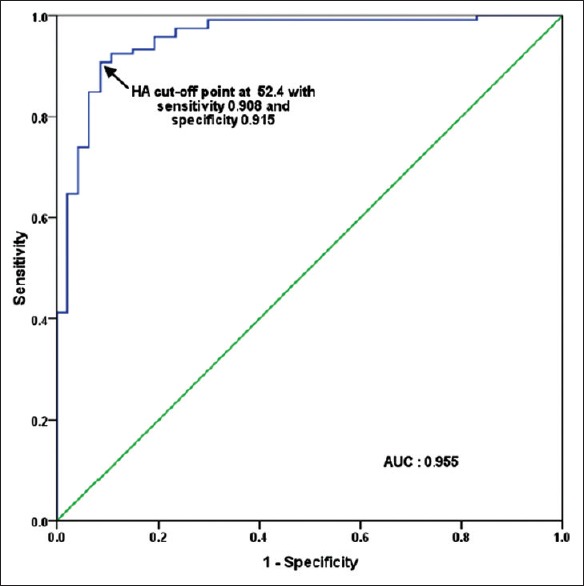
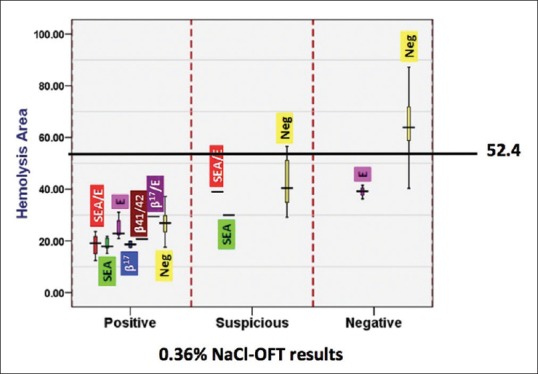
Materials and methods: The portable spectrophotometer was invented capable of calculating the HA values. The HA values were then compared among 69, 156, and 19 blood samples having positive, negative, and suspicious 0.36% NaCl-based OFT results, respectively; 109 and 135 blood samples having mean corpuscular volume (MCV) ≤80 fL and >80 fL, respectively; and 138 and 106 blood samples having mean corpuscular hemoglobin (MCH) ≤27 pg and >27 pg, respectively. In addition, the HA values were compared in 166 blood samples having different globin gene genotypes. Finally, the HA cutoff value was determined by receiver operation curve (ROC) analysis.
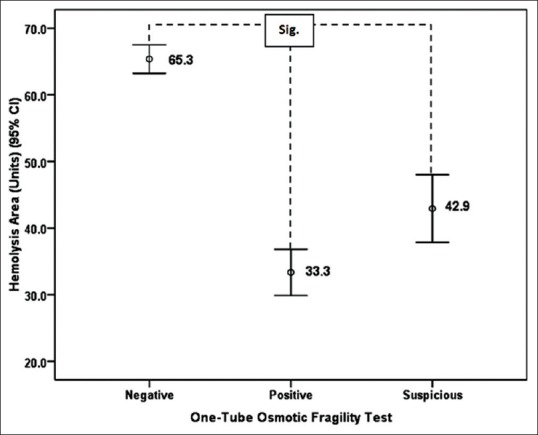
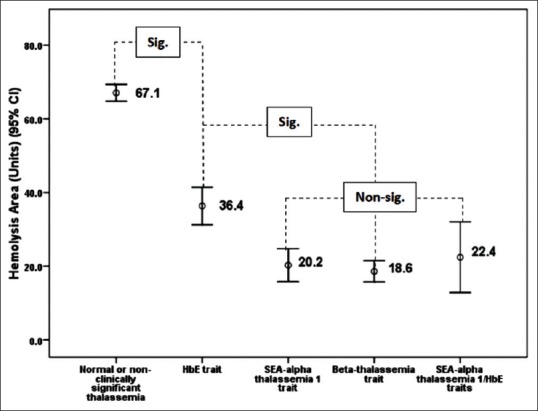
Results: The HA values in samples having positive, suspicious, and negative 0.36% NaCl-based OFT were 33.3 ± 14.4, 42.9 ± 10.5, and 65.3 ± 13.4, respectively; in sample having MCV ≤80 fL and >80 fL were 43.1 ± 19.6 and 63.8 ± 14.5, respectively; and in samples having MCH ≤27 pg and >27 pg were 46.7 ± 20.1 and 64.8 ± 14.2, respectively. The HA values in normal, hemoglobin E, SEA-α thalassemia 1, and β-thalassemia traits were 67.1 ± 12.6, 36.4 ± 13.9, 20.2 ± 4.8, and 18.6 ± 1.1, respectively. All were significantly different. ROC analysis established 52.4 as the HA cutoff that had comparable effectiveness to the conventional screening tests.
Conclusion: The new HA value was effective and could be an alternative choice for screening thalassemia traits.
Keywords: Hemolysis; kinetics; osmotic fragility test; thalassemia heterozygote; thalassemia screen.
Conflict of interest statement
There are no conflicts of interest.
Figures
Similar articles
-
[Values of MCV,MCH,ROFT and HbA2 for Screening α-Thalassemia in Guangdong Area].Zhongguo Shi Yan Xue Ye Xue Za Zhi. 2020 Oct;28(5):1679-1682. doi: 10.19746/j.cnki.issn.1009-2137.2020.05.041. Zhongguo Shi Yan Xue Ye Xue Za Zhi. 2020. PMID: 33067973 Chinese.
-
A comparison of the accuracy of the corpuscular fragility and mean corpuscular volume tests for the alpha-thalassemia 1 and beta-thalassemia traits.Int J Gynaecol Obstet. 2009 Oct;107(1):26-9. doi: 10.1016/j.ijgo.2009.05.012. Epub 2009 Jul 9. Int J Gynaecol Obstet. 2009. PMID: 19591999
-
The Hb E (HBB: c.79G>A), Mean Corpuscular Volume, Mean Corpuscular Hemoglobin Cutoff Points in Double Heterozygous Hb E/- -SEA α-Thalassemia-1 Carriers are Dependent on Hemoglobin Levels.Hemoglobin. 2017 Jan;41(1):38-43. doi: 10.1080/03630269.2017.1295984. Epub 2017 Apr 16. Hemoglobin. 2017. PMID: 28413893
-
Erythrocyte Indices and Hemoglobin Analysis for α-Thalassemia Screening in an Area with High Carrying Rate.Indian J Hematol Blood Transfus. 2022 Apr;38(2):352-358. doi: 10.1007/s12288-021-01449-2. Epub 2021 May 27. Indian J Hematol Blood Transfus. 2022. PMID: 35496953 Free PMC article.
-
[Comparison of the effect of three β-thalassemia prenatal screening strategies using in Guangdong province].Zhonghua Fu Chan Ke Za Zhi. 2015 Jun;50(6):434-40. Zhonghua Fu Chan Ke Za Zhi. 2015. PMID: 26311551 Chinese.
Cited by
-
Alteration in the number, morphology, function, and metabolism of erythrocytes in high-altitude polycythemia.Front Physiol. 2024 Feb 15;15:1359357. doi: 10.3389/fphys.2024.1359357. eCollection 2024. Front Physiol. 2024. PMID: 38426208 Free PMC article.
-
Multiple-ancestry genome-wide association study identifies 27 loci associated with measures of hemolysis following blood storage.J Clin Invest. 2021 Jul 1;131(13):e146077. doi: 10.1172/JCI146077. J Clin Invest. 2021. PMID: 34014839 Free PMC article.
References
-
- Flint J, Harding RM, Boyce AJ, Clegg JB. The population genetics of the haemoglobinopathies. In: Rodgers GP, editor. Bailliere's Clinical Haematology, International Practice and Research: Sickle Cell Disease and Thalassaemia. Vol. 11. London: Bailliere Tindall; 1998. pp. 1–51. - PubMed
-
- Hill AV. Molecular epidemiology of the thalassaemias (including haemoglobin E) Baillieres Clin Haematol. 1992;5:209–38. - PubMed
-
- Weatherall DJ, Clegg JB. Thalassemia – A global public health problem. Nat Med. 1996;2:847–9. - PubMed
-
- Weatherall DJ. Phenotype-genotype relationships in monogenic disease: Lessons from the thalassaemias. Nat Rev Genet. 2001;2:245–55. - PubMed
LinkOut - more resources
Full Text Sources
Other Literature Sources