. 2018 Mar 5:2018:8424502.
doi: 10.1155/2018/8424502. eCollection 2018.

Murine Nephrotoxic Nephritis as a Model of Chronic Kidney Disease

Affiliations

Murine Nephrotoxic Nephritis as a Model of Chronic Kidney Disease

M K E Ougaard et al. Int J Nephrol. .

Abstract

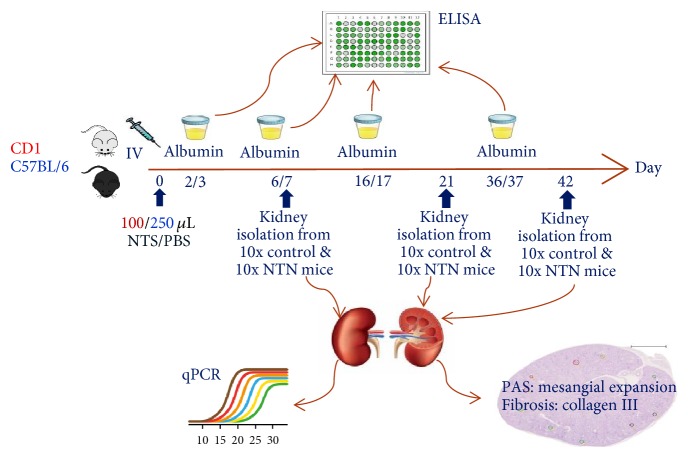
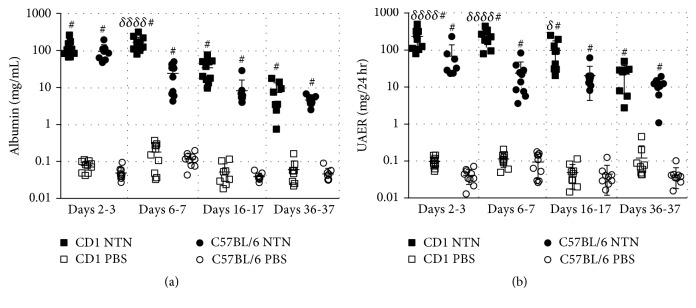
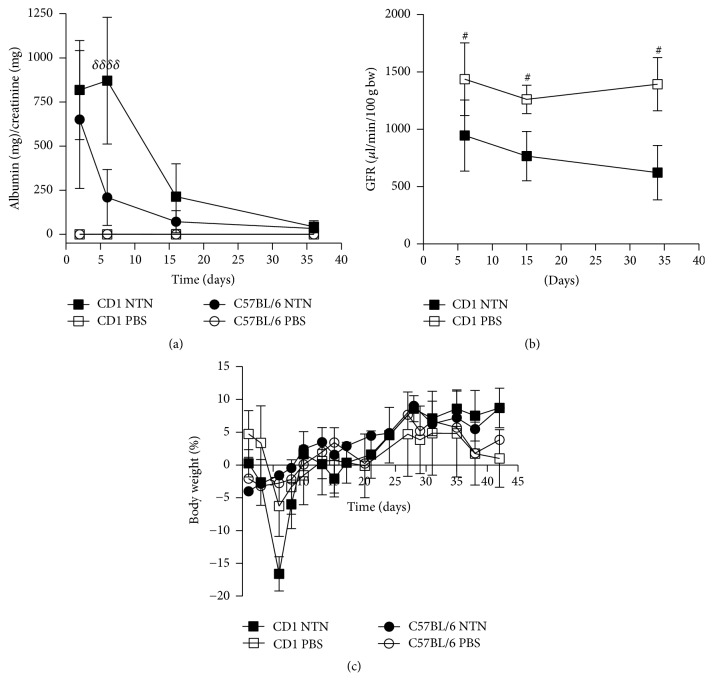
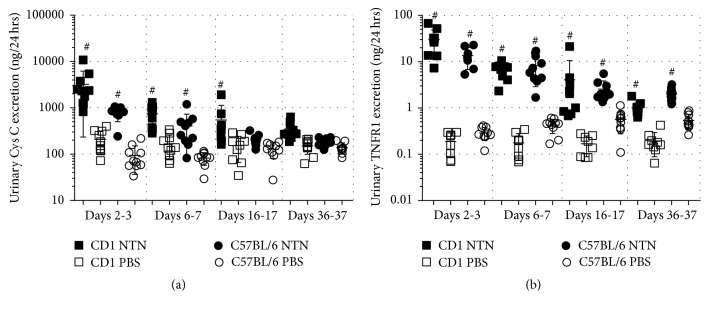
Using the nonaccelerated murine nephrotoxic nephritis (NTN) as a model of chronic kidney disease (CKD) could provide an easily inducible model that enables a rapid test of treatments. Originally, the NTN model was developed as an acute model of glomerulonephritis, but in this study we evaluate the model as a CKD model and compare CD1 and C57BL/6 female and male mice. CD1 mice have previously showed an increased susceptibility to CKD in other CKD models. NTN was induced by injecting nephrotoxic serum (NTS) and evaluated by CKD parameters including albuminuria, glomerular filtration rate (GFR), mesangial expansion, and renal fibrosis. Both strains showed significant albuminuria on days 2-3 which remained significant until the last time point on days 36-37 supporting dysfunctional filtration also observed by a significantly declined GFR on days 5-6, 15-17, and 34-37. Both strains showed early progressive mesangial expansion and significant renal fibrosis within three weeks suggesting CKD development. CD1 and C57BL/6 females showed a similar disease progression, but female mice seemed more susceptible to NTS compared to male mice. The presence of albuminuria, GFR decline, mesangial expansion, and fibrosis showed that the NTN model is a relevant CKD model both in C57BL/6 and in CD1 mice.


Figures

Figure 1
Figure 1
Study set up in C57BL/6 and CD1 mice.
Figure 2
Figure 2
CD1 mice are more susceptible to NTS measured by albuminuria compared to C57BL/6 mice. (a) Scatter plot showing the 24 h urinary albumin excretion rate (UAER) of CD1 mice over time. (b) Scatter plot showing the 24 h urinary albumin excretion rate (UAER) of C57BL/6 mice over time. Data are shown as mean ± SD. #P < 0.0001 NTS groups (n = 5-6) versus PBS group (n = 5-6) by one-way ANOVA.
Figure 3
Figure 3
NTS induces significant and chronic increase in UAER and urine albumin concentration. (a) Scatter plot showing the 24 h urinary albumin excretion rate (UAER) on days 2-3, 6-7, 16-17, and 36-37. (b) Scatter plot showing urinary albumin concentration on days 2-3, 6-7, 16-17, and 36-37. Data are shown as mean ± SD. #P < 0.0001 NTN groups versus PBS groups and δP < 0.05, δδδδP < 0.0001 CD1 NTN versus B6 NTN groups by two-way ANOVA (n = 10).
Figure 4
Figure 4
NTS induces albuminuria, GFR decline, and transient weight loss. (a) Graph showing the average urinary albumin/creatine ratio (mg/mg) on days 2-3, 6-7, 16-17, and 36-37. (b) Graph showing the mean glomerular filtration rate (μl/min/100 g body weight (bw)) in CD1 mice on days 5-6, 15–17, and 34–37. (c) Graph showing the average percentage change in body weight over time. Data are shown as mean ± SD. #P < 0.05 CD1 NTN versus CD1 PBS by one-way ANOVA (n = 10); δδδδP < 0.0001 CD1 NTN versus B6 NTN groups by two-way ANOVA (n = 10).
Figure 5
Figure 5
NTS induces significant urinary excretion of Cystatin C and TNFR1. (a) Scatter plot showing the 24 h urinary Cystatin C excretion rate over time measured by ELISA. (b) Scatter plot showing 24 h urinary TNFR1 excretion rate over time measured by ELISA. Data are shown as mean ± SD. #P < 0.01 NTN groups versus PBS groups by two-way ANOVA (n = 10).
Figure 6
Figure 6
NTS induces systemic inflammation and elevation of GFR marker. (a) Scatter plot showing the SAP plasma concentration on days 7, 14, 21, 28, and 42 measured by ELISA. (b) Scatter plot of Cystatin C plasma concentration days 7, 14, 21, 28, and 42 measured by ELISA. (c) Scatter plot showing mRNA expression in whole kidney tissue of C3 and MCP-1 (CCL2) on days 7, 21, and 42, expressed as fold change. Data are shown as mean ± SD. #P < 0.001 NTN groups versus PBS groups by two-way ANOVA (n = 10).
Figure 7
Figure 7
NTS causes chronic and progressive glomerular mesangial expansion in C57BL/6 and CD1 mice. (a) Representative glomeruli showing scores 0, 1, 2, and 3 of mesangial expansion. (b) Scatter plot showing the mean glomerular mesangial expansion (ME) score on days 7, 21, and 42. Data are shown as mean ± SD. #P < 0.0001 NTN groups versus PBS groups; ∗∗∗P < 0.001 NTN group day 7 versus NTN group day 21; ∗∗∗∗P < 0.0001 NTN group day 21 versus NTN group day 42 by two-way ANOVA and using Kruskal-Wallis multiple testing (n = 10).
Figure 8
Figure 8
NTS induces chronic renal fibrosis. (a) Representative images of tubulointerstitial fibrotic area visualised by immunohistochemical collagen III staining. (b) Semiquantification of collagen III positive area of the cortex area. (c) Scatter plot showing mRNA expression in whole kidney tissue of Col3a1 as fold change. (d) Fibronectin (Fn1) mRNA expression as fold change. (e) PAI-1 (Serpine-1) mRNA expression as fold change. Data are shown as mean ± SD. #P < 0.0001 NTN groups versus PBS groups; ∗∗∗P < 0.001 NTN day 7 versus NTN day 21; ∗∗∗∗P < 0.0001 NTN day 7 versus NTN day 21; and δδP < 0.01, δδδδP < 0.0001 CD1 NTN versus B6 NTN groups by two-way ANOVA (n = 10).

References

    1. Fogo A. B. Mechanisms of progression of chronic kidney disease. Pediatric Nephrology. 2007;22(12):2011–2022. doi: 10.1007/s00467-007-0524-0. - DOI - PMC - PubMed
    1. Becker G. J., Hewitson T. D. Animal models of chronic kidney disease: useful but not perfect. Nephrology Dialysis Transplantation . 2013;28(10):2432–2438. doi: 10.1093/ndt/gft071. - DOI - PubMed
    1. Eddy A. A., López-Guisa J. M., Okamura D. M., Yamaguchi I. Investigating mechanisms of chronic kidney disease in mouse models. Pediatric Nephrology. 2012;27(8):1233–1247. doi: 10.1007/s00467-011-1938-2. - DOI - PMC - PubMed
    1. Fogo A. B. Animal models of FSGS: Lessons for pathogenesis and treatment. Seminars in Nephrology. 2003;23(2):161–171. doi: 10.1053/snep.2003.50015. - DOI - PubMed
    1. Huang L., Scarpellini A., Funck M., Verderio E. A., Johnson T. S. Development of a chronic kidney disease model in C57BL/6 mice with relevance to human pathology. Nephron Extra. 2013;3(1):12–29. doi: 10.1159/000346180. - DOI - PMC - PubMed