

Combining ODR and Blood Vessel Tracking for Artery-Vein Classification and Analysis in Color Fundus Images
- PMID: 29692950
- PMCID: PMC5912799
- DOI: 10.1167/tvst.7.2.23
Combining ODR and Blood Vessel Tracking for Artery-Vein Classification and Analysis in Color Fundus Images
Abstract
Purpose: This study aims to develop a fully automated algorithm for artery-vein (A-V) and arteriole-venule classification and to quantify the effect of hypertension on A-V caliber and tortuosity ratios of nonproliferative diabetic retinopathy (NPDR) patients.
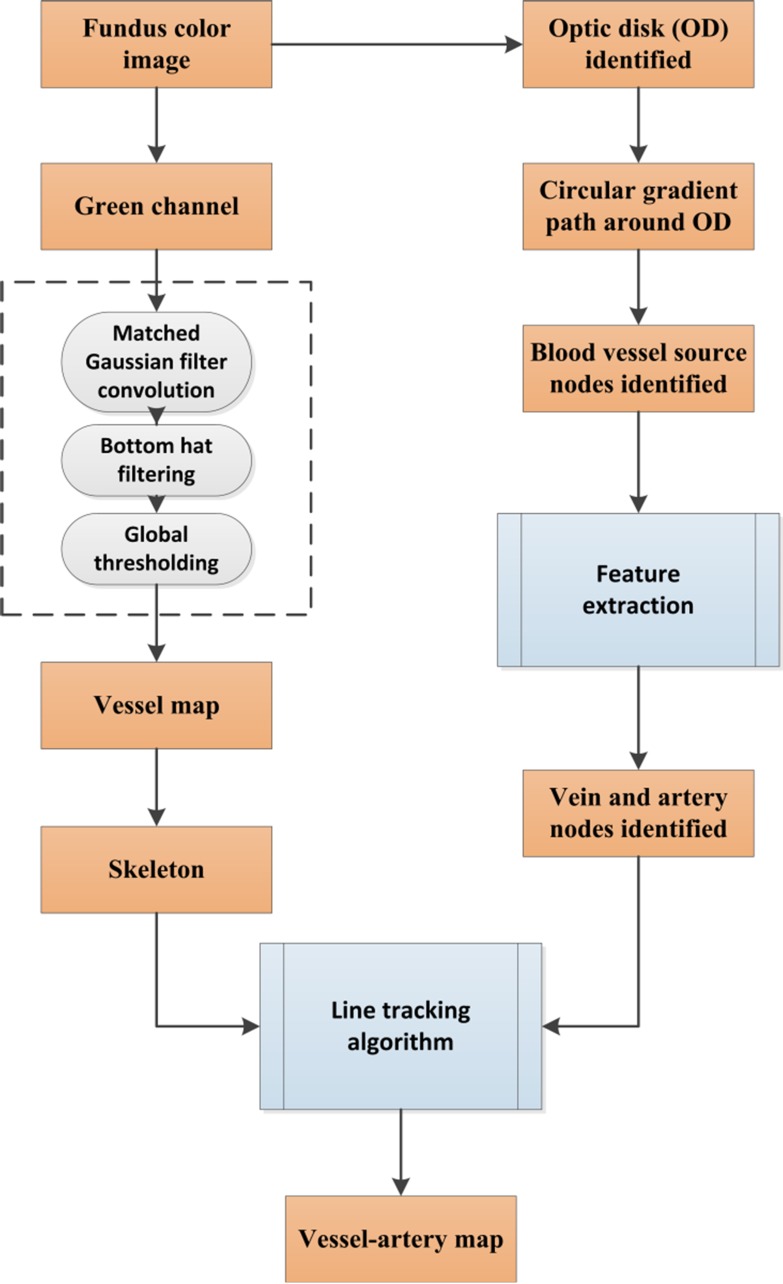
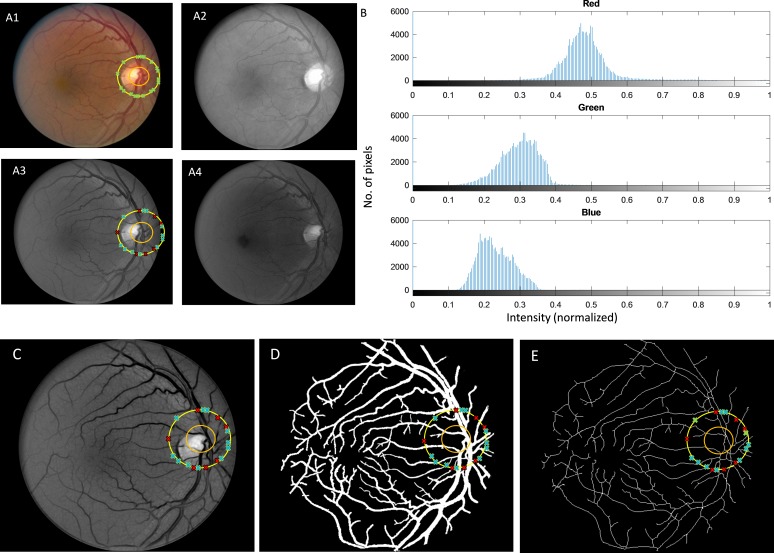
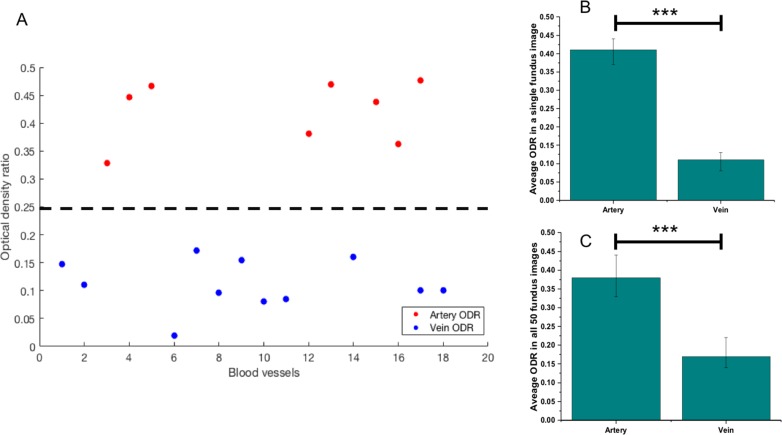
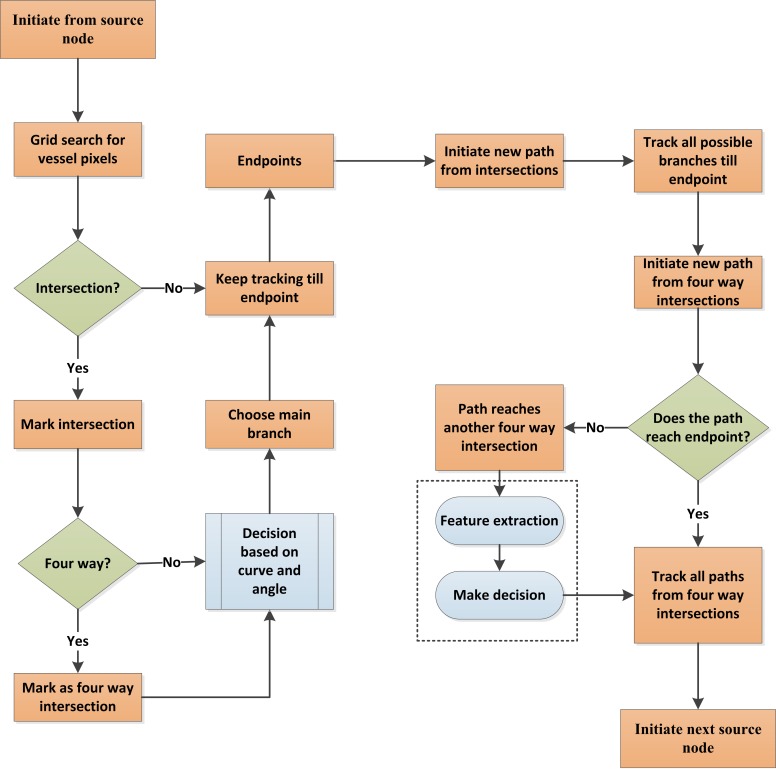
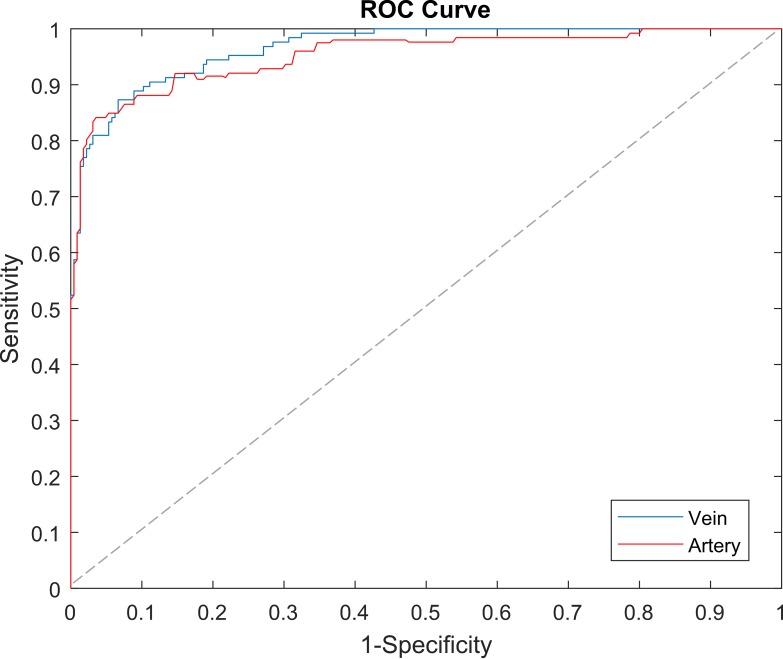
Methods: We combine an optical density ratio (ODR) analysis and blood vessel tracking (BVT) algorithm to classify arteries and veins and arterioles and venules. An enhanced blood vessel map and ODR analysis are used to determine the blood vessel source nodes. The whole vessel map is then tracked beginning from the source nodes and classified as vein (venule) or artery (arteriole) using vessel curvature and angle information. Fifty color fundus images from NPDR patients are used to test the algorithm. Sensitivity, specificity, and accuracy metrics are measured to validate the classification method compared to ground truths.
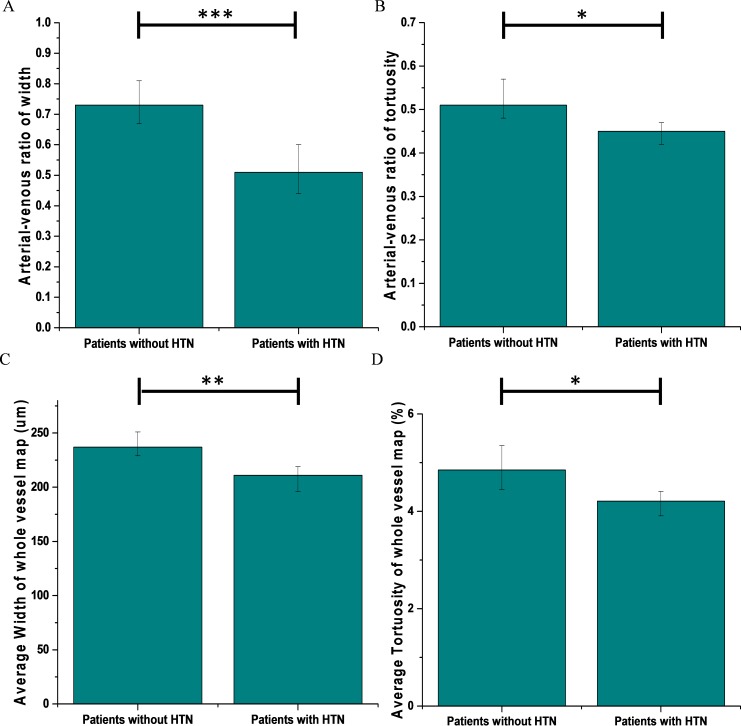
Results: The combined ODR-BVT method demonstrates 97.06% accuracy in identifying blood vessels as vein or artery. Sensitivity and specificity of A-V identification are 97.58%, 97.81%, and 95.89%, 96.68%, respectively. Comparative analysis revealed that the average A-V caliber and tortuosity ratios of NPDR patients with hypertension have 48% and 15.5% decreases, respectively, compared to that of NPDR patients without hypertension.
Conclusions: Automated A-V classification has been achieved by combined ODR-BVT analysis. Quantitative analysis of color fundus images verified robust performance of the A-V classification. Comparative quantification of A-V caliber and tortuosity ratios provided objective biomarkers to differentiate NPDR groups with and without hypertension.
Translational relevance: Automated A-V classification can facilitate quantitative analysis of retinal vascular distortions due to diabetic retinopathy and other eye conditions and provide increased sensitivity for early detection of eye diseases.
Keywords: blood vessel tracking; diabetic retinopathy; optical density ratio; vein–artery classification.
Figures

References
-
- Wong TY, Klein R, Klein BE, Tielsch JM, Hubbard L, Nieto FJ. . Retinal microvascular abnormalities and their relationship with hypertension, cardiovascular disease, and mortality. Surv Ophthalmol. 2001; 46: 59– 80. - PubMed
-
- Wong TY, Knudtson MD, Klein R, Klein BE, Meuer SM, Hubbard LD. . Computer-assisted measurement of retinal vessel diameters in the Beaver Dam Eye Study: methodology, correlation between eyes, and effect of refractive errors. Ophthalmology. 2004; 111: 1183– 1190. - PubMed
-
- Patton N, Aslam TM, MacGillivray T,et al. . Retinal image analysis: concepts, applications and potential. Prog Retin Eye Res. 2006; 25: 99– 127. - PubMed
-
- Ikram MK, Witteman JC, Vingerling JR, Breteler MM, Hofman A, de Jong PT. . Retinal vessel diameters and risk of hypertension. Hypertension. 2006; 47: 189– 194. - PubMed
Grants and funding
LinkOut - more resources
Full Text Sources
Other Literature Sources
