

Feasibility of Optical Coherence Tomography (OCT) for Intra-Operative Detection of Blood Flow during Gastric Tube Reconstruction
- PMID: 29693606
- PMCID: PMC5982600
- DOI: 10.3390/s18051331
Feasibility of Optical Coherence Tomography (OCT) for Intra-Operative Detection of Blood Flow during Gastric Tube Reconstruction
Abstract
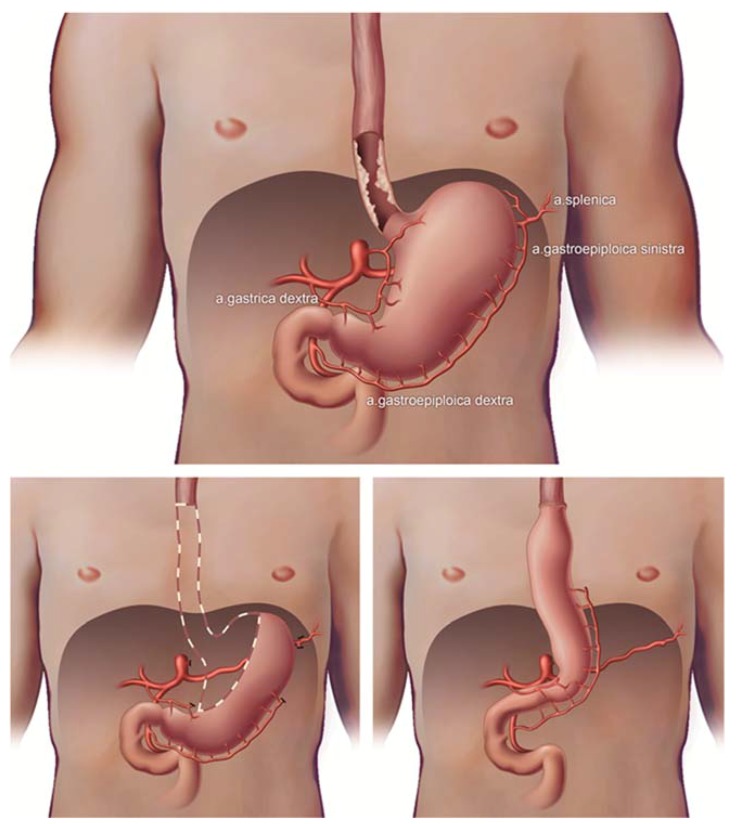
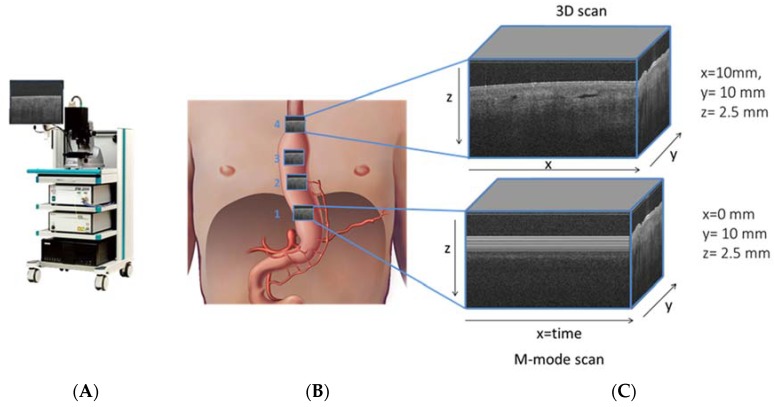
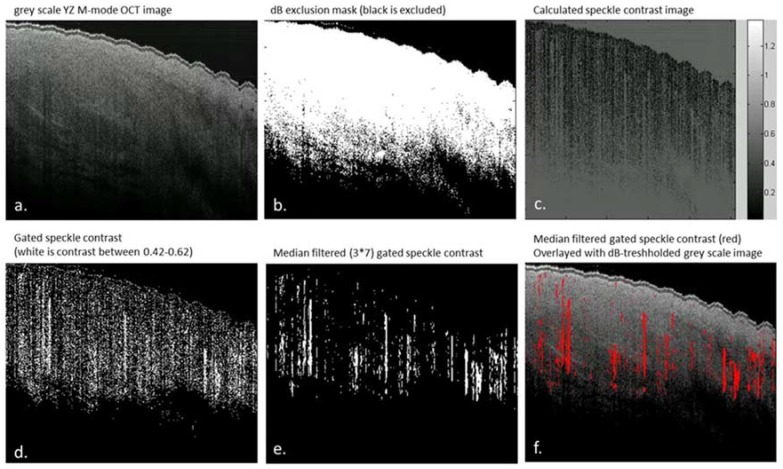
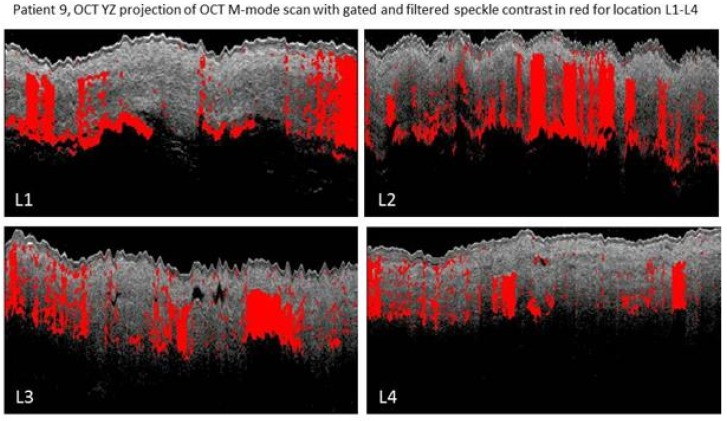
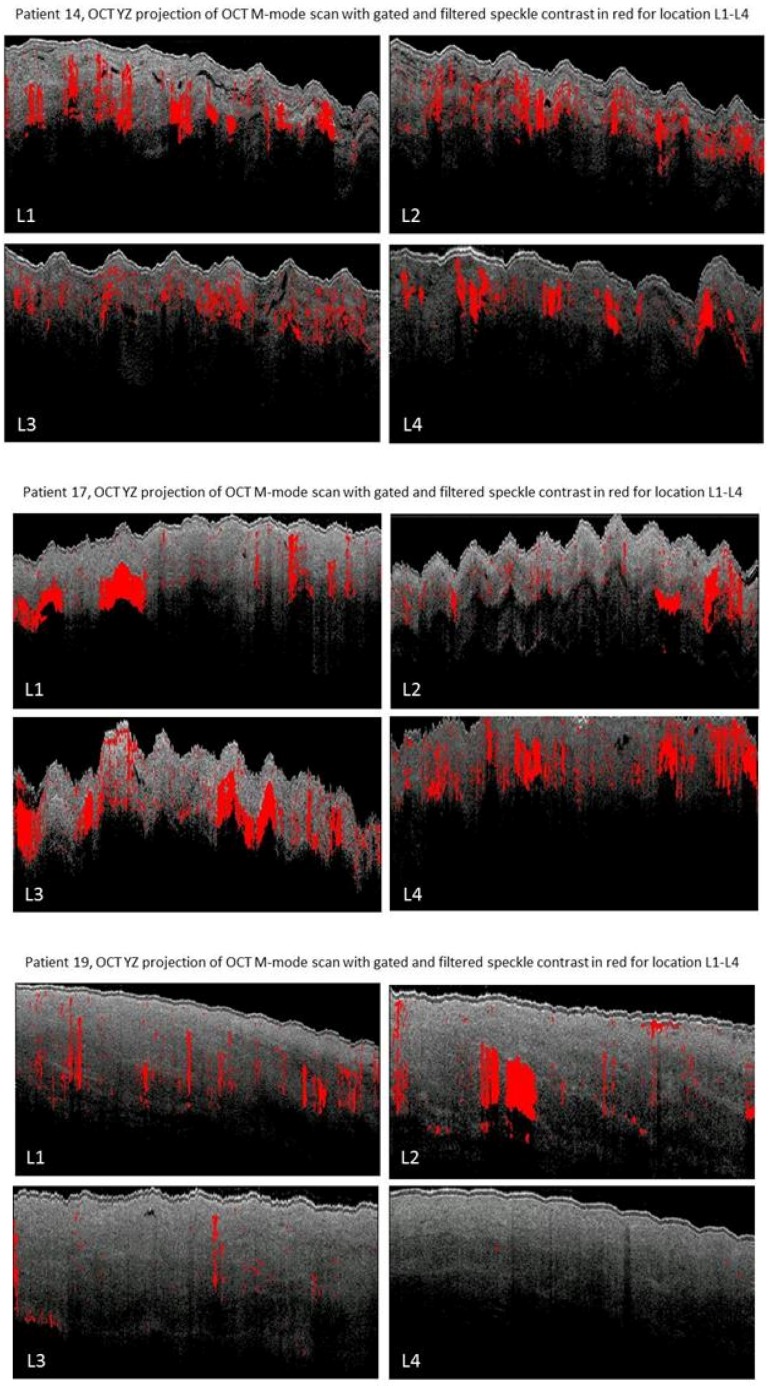
In this study; an OCT-based intra-operative imaging method for blood flow detection during esophagectomy with gastric tube reconstruction is investigated. Change in perfusion of the gastric tube tissue can lead to ischemia; with a high morbidity and mortality as a result. Anastomotic leakage (incidence 5⁻20%) is one of the most severe complications after esophagectomy with gastric tube reconstruction. Optical imaging techniques provide for minimal-invasive and real-time visualization tools that can be used in intraoperative settings. By implementing an optical technique for blood flow detection during surgery; perfusion can be imaged and quantified and; if needed; perfusion can be improved by either a surgical intervention or the administration of medication. The feasibility of imaging gastric microcirculation in vivo using optical coherence tomography (OCT) during surgery of patients with esophageal cancer by visualizing blood flow based on the speckle contrast from M-mode OCT images is studied. The percentage of pixels exhibiting a speckle contrast value indicative of flow was quantified to serve as an objective parameter to assess blood flow at 4 locations on the reconstructed gastric tube. Here; it was shown that OCT can be used for direct blood flow imaging during surgery and may therefore aid in improving surgical outcomes for patients.
Keywords: OCT; esophagectomy; flow; gastric tube; monitoring; optical imaging; perfusion; speckle; surgery.
Conflict of interest statement
The authors declare no conflict of interest.
Figures

Similar articles
-
Optical techniques for perfusion monitoring of the gastric tube after esophagectomy: a review of technologies and thresholds.Dis Esophagus. 2018 Jun 1;31(6). doi: 10.1093/dote/dox161. Dis Esophagus. 2018. PMID: 29701760 Review.
-
Can we predict necrosis intra-operatively? Real-time optical quantitative perfusion imaging in surgery: study protocol for a prospective, observational, in vivo pilot study.Pilot Feasibility Stud. 2017 Nov 25;3:65. doi: 10.1186/s40814-017-0204-1. eCollection 2017. Pilot Feasibility Stud. 2017. PMID: 29209513 Free PMC article.
-
Laser speckle contrast imaging identifies ischemic areas on gastric tube reconstructions following esophagectomy.Medicine (Baltimore). 2016 Jun;95(25):e3875. doi: 10.1097/MD.0000000000003875. Medicine (Baltimore). 2016. PMID: 27336874 Free PMC article.
-
Effect of ephedrine on gastric conduit perfusion measured by laser speckle contrast imaging after esophagectomy: a prospective in vivo cohort study.Dis Esophagus. 2018 Oct 1;31(10). doi: 10.1093/dote/doy031. Dis Esophagus. 2018. PMID: 29668909
-
Near-infrared fluorescence imaging with indocyanine green to assess the blood supply of the reconstructed gastric conduit to reduce anastomotic leakage after esophagectomy: a literature review.Surg Today. 2023 Apr;53(4):399-408. doi: 10.1007/s00595-022-02474-y. Epub 2022 Feb 19. Surg Today. 2023. PMID: 35182253 Review.
Cited by
-
Parametric imaging of attenuation by optical coherence tomography: review of models, methods, and clinical translation.J Biomed Opt. 2020 Apr;25(4):1-34. doi: 10.1117/1.JBO.25.4.040901. J Biomed Opt. 2020. PMID: 32246615 Free PMC article. Review.
-
A case of stent-graft implantation for postpancreaticoduodenectomy hemorrhage in a patient with a reconstructed gastric tube.Radiol Case Rep. 2020 Oct 22;15(12):2710-2713. doi: 10.1016/j.radcr.2020.10.021. eCollection 2020 Dec. Radiol Case Rep. 2020. PMID: 33117472 Free PMC article.
-
Optical Coherence Tomography Angiography of the Intestine: How to Prevent Motion Artifacts in Open and Laparoscopic Surgery?Life (Basel). 2023 Mar 6;13(3):705. doi: 10.3390/life13030705. Life (Basel). 2023. PMID: 36983861 Free PMC article.
-
Research progress on the application of optical coherence tomography in the field of oncology.Front Oncol. 2022 Jul 25;12:953934. doi: 10.3389/fonc.2022.953934. eCollection 2022. Front Oncol. 2022. PMID: 35957903 Free PMC article. Review.
-
Prospects of Intraoperative Multimodal OCT Application in Patients with Acute Mesenteric Ischemia.Diagnostics (Basel). 2021 Apr 15;11(4):705. doi: 10.3390/diagnostics11040705. Diagnostics (Basel). 2021. PMID: 33920827 Free PMC article.
References
-
- Futier E., Robin E., Jabaudon M., Guerin R., Petit A., Bazin J.-E., Constantin J.-M., Vallet B. Central venous O2 saturation and venous-to-arterial CO2 difference as complementary tools for goal-directed therapy during high-risk surgery. Crit. Care. 2010;14:R193. doi: 10.1186/cc9310. - DOI - PMC - PubMed
-
- Biere S.S., van Berge Henegouwen M.I., Maas K.W., Bonavina L., Rosman C., Garcia J.R., Gisbertz S.S., Klinkenbijl J.H., Hollmann M.W., de Lange E.S., et al. Minimally invasive versus open oesophagectomy for patients with oesophageal cancer: A multicentre, open-label, randomised controlled trial. Lancet. 2012;379:1887–1892. doi: 10.1016/S0140-6736(12)60516-9. - DOI - PubMed
-
- Veelo D.P., Gisbertz S.S., Hannivoort R.A., Van Dieren S., Geerts B.F., Henegouwen M.I.V.B., Hollmann M.W. The effect of on-demand vs deep neuromuscular relaxation on rating of surgical and anaesthesiologic conditions in patients undergoing thoracolaparoscopic esophagectomy ( DEPTH trial): Study protocol for a randomized controlled trial. Trials. 2015;331 doi: 10.1186/s13063-015-0849-0. - DOI - PMC - PubMed
MeSH terms
LinkOut - more resources
Full Text Sources
Other Literature Sources
