. 2018 May;3(5):563-569.
doi: 10.1038/s41564-018-0151-5. Epub 2018 Apr 23.

A high-frequency phenotypic switch links bacterial virulence and environmental survival in Acinetobacter baumannii

Affiliations

A high-frequency phenotypic switch links bacterial virulence and environmental survival in Acinetobacter baumannii

Chui Yoke Chin et al. Nat Microbiol. 2018 May.

Abstract

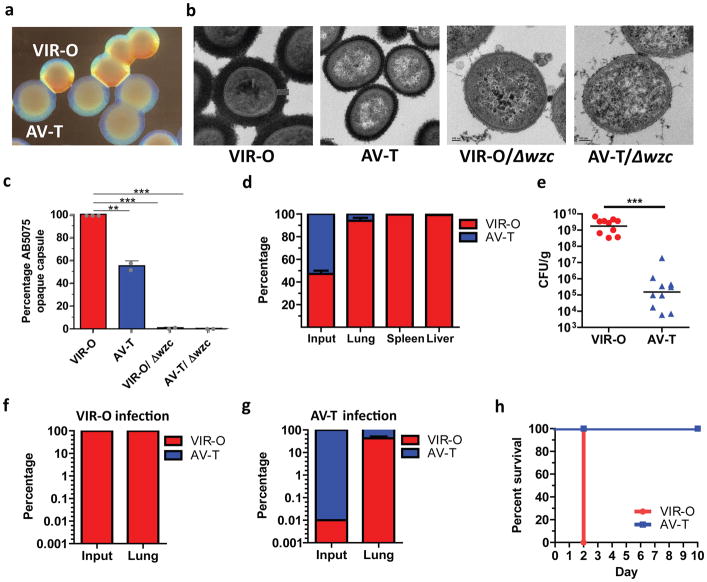
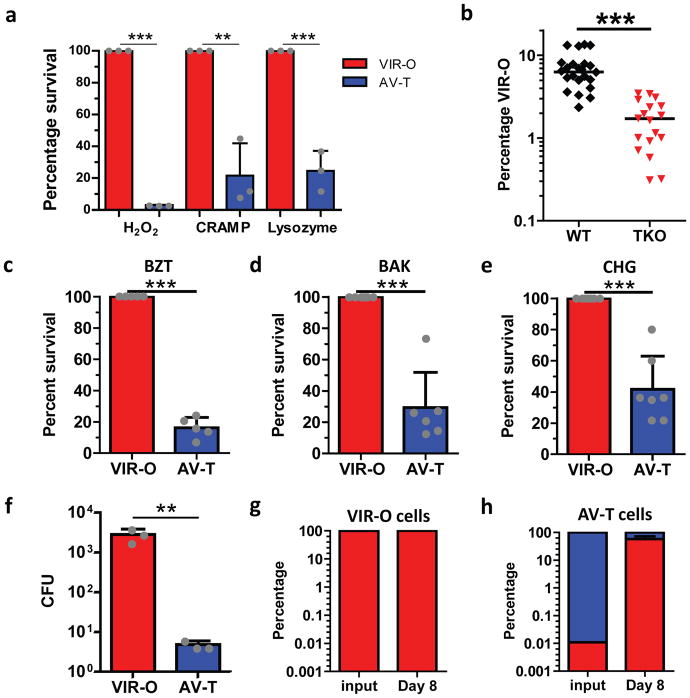
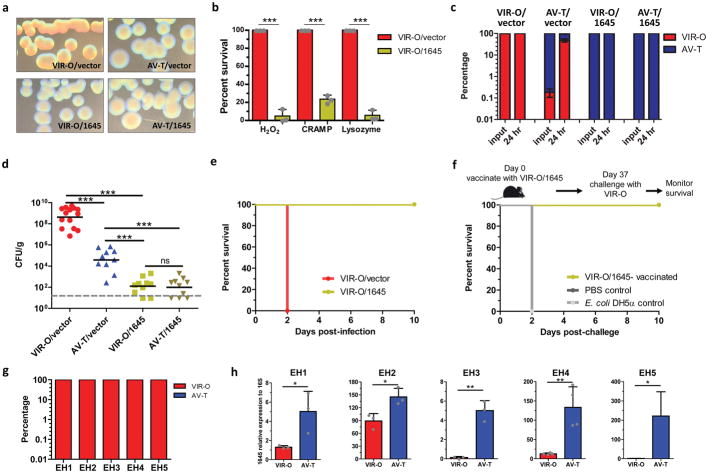
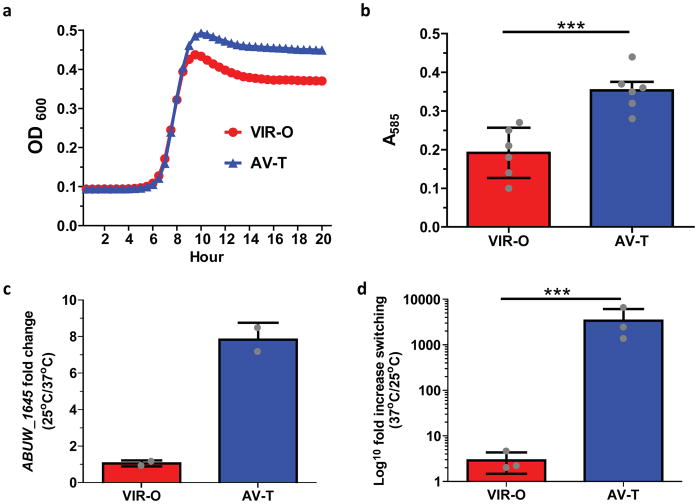
Antibiotic-resistant infections lead to 700,000 deaths per year worldwide 1 . The roles of phenotypically diverse subpopulations of clonal bacteria in the progression of diseases are unclear. We found that the increasingly pathogenic and antibiotic-resistant pathogen Acinetobacter baumannii harbours a highly virulent subpopulation of cells responsible for disease. This virulent subpopulation possesses a thicker capsule and is resistant to host antimicrobials, which drive its enrichment during infection. Importantly, bacteria harvested from the bloodstream of human patients belong exclusively to this virulent subpopulation. Furthermore, the virulent form exhibits increased resistance to hospital disinfectants and desiccation, indicating a role in environmental persistence and the epidemic spread of disease. We identified a transcriptional 'master regulator' of the switch between avirulent and virulent cells, the overexpression of which abrogates virulence. Furthermore, the overexpression strain is capable of vaccinating mice against lethal challenge. This work highlights a phenotypic subpopulation of bacteria that drastically alters the outcome of infection, and illustrates how knowledge of the regulatory mechanisms controlling such phenotypic switches can be harnessed to attenuate bacteria and develop translational interventions.


Conflict of interest statement

Competing Interests. The authors declare no competing interests.

Figures

Figure 1
Figure 1. A highly virulent opaque (VIR-O) population is responsible for causing disease during in vivo pulmonary infection of mice
(a), Representative A. baumannii strain AB5075 wild-type virulent opaque (VIR-O) and avirulent translucent (AV-T) colonies. (b) Strains were stained for capsule with ruthenium red and imaged by transmission electron microscopy. Representative images are shown for each strain. Scale bars in each image represent 100 nanometers. (c) Capsule abundance of the indicated strains was determined by capsule extraction and quantitation on SDS-PAGE gels stained with Alcian blue. Values were obtained from three biological replicates and error bars represent standard deviation of the mean. p-values (**p < 0.005; ***p < 0.0005) were determined using one-way ANOVA. (d), Mice were infected with a 1:1 mixture of VIR-O (red) and AV-T (blue) strains (n=5/group). At 24 hours post-infection, organs were harvested and plated to assess the percentage of VIR-O and AV-T cells present. (e), Mice were infected with VIR-O and AV-T (n=5/group). Presented data were pooled from two separate experiments and repeated at least 10 times. At 24 hours post-infection, lungs were harvested and plated for colony forming units (e). Bacteria recovered from the (f) VIR-O and (g) AV-T-infected lungs were assessed for the percentage of VIR-O and AV-T cells present, respectively. (h), Survival of mice infected with VIR-O and AV-T (n=5/group). This experiment was repeated 3 times. Error bars represent standard deviation of the mean in (d, f and g); Error bars represent geometric mean and significance was determined using a two-tailed Mann-Whitney test (***p < 0.0005) in (e).
Figure 2
Figure 2. The host antimicrobial, hospital disinfectant and desiccation-resistant VIR-O cells are selected during in vivo infection
(a), VIR-O (red) or AV-T (blue) were treated with H2O2, CRAMP or lysozyme, and percent survival relative to VIR-O was calculated. The reported values represent the mean of three replicates with standard deviations. Repeated experiments gave similar results. (b), Wild-type (WT, black) or triple knockout (TKO; red) mice lacking the gp91 subunit of the NADPH oxidase, lysozyme and CRAMP were infected with AV-T (n= 4 to 8/group). At 8 hours post-infection, lungs were harvested and plated to assess the percentage of VIR-O cells present. Presented data were pooled from three separate experiments and repeated at least 5 times for a total of 18–23 mice/per group. (c–e), VIR-O or AV-T was treated with the indicated amounts of disinfectants: (c) benzethonium chloride (BZT) 0.01%, (d) benzalkonium chloride (BAK) 0.004% and (e) chlorhexidine gluconate (CHG) 0.008%, and percent survival relative to VIR-O was calculated. Presented data were pooled from three separate experiments and a total of 5 replicates were used for (c), 6 replicates for (d) and 7 replicates for (e). (f–h), VIR-O and AV-T survival after desiccation. (f), Bacteria were rehydrated and plated on day 8 of desiccation to determine viability. Values represent the mean of three replicates. Recovered bacteria from the (g) VIR-O cells and (h) AV-T cells were assessed for the percentage of VIR-O and AV-T cells present. Error bars represent standard deviation of the mean and Student’s two-tailed t-test (**p < 0.005; ***p < 0.0005) in (a) and (c–h); Error bars represent geometric mean and a two-tailed Mann-Whitney test was to determine significance (***p < 0.0005) in (b).
Figure 3
Figure 3. ABUW_1645 is a global regulator in mediating phenotypic switching, virulence and resistance to host defenses
(a), Representative colonies of VIR-O or AV-T cells overexpressing ABUW_1645 or with empty vector. (b), VIR-O/vector (red) and VIR-O/1645 (green) were treated with lysozyme, H2O2 or CRAMP, and percent survival relative to VIR-O/vector was calculated. The reported values represent the mean of three independent replicates with standard deviations. Repeated experiments gave similar results. (c, d), Mice were infected with VIR-O/vector (red), AV-T/vector (blue), VIR-O/1645 (green) or AV-T/1645 (gold) strains (10 mice/group). At 24 hours post-infection, lungs were harvested and plated for colony forming units (d) and assessed for the percentage of VIR-O and AV-T cells present (c). (e), Survival of mice infected with VIR-O/vector and VIR-O/1645 (n=5/group). This experiment was repeated two times with identical results. (f), Survival of VIR-O/1645 and E. coli-vaccinated mice after lethal challenge (n=5/group). This experiment was repeated two times with identical results. (g) Blood cultures from A. baumannii-infected patients were plated directly on 0.5× LB agar plates to assess the percentage of VIR-O and AV-T cells present. (h) For each isolate, AV-T variants were isolated from the VIR-O colonies and the expression of ABUW_1645 was determined in each variant by quantitative real-time PCR. Data represents the mean from three replicates and error bars represent standard deviations of the mean. Student’s two-tailed t-test (*p < 0.05; **p <0.005; ***p < 0.0005) was used in (b and h). A two-tailed Mann-Whitney test was used in (d)(***p < 0.0005). ns, not significant.
Figure 4
Figure 4. AV-T specific phenotypes
(a) Growth curves of VIR-O and AV-T in Chamberlain’s minimal media. Values represent (b) Biofilm formation of VIR-O and AV-T cells grown for 24 hours at 25°C. Values represent the average of 6 replicates for each strain. Student’s two-tailed t-test was used to determine significance ***p < 0.0005) (c) Ratio of ABUW_1645 expression in VIR-O and AV-T cells at low (25°C) and high temperature (37°C). Values represent the averages of two independent biological replicates. (d) Phenotypic switching of VIR-O and AV-T cells at low (25°C) and high temperature (37°C) in LB media harvested at an optical density A600 of 1.6. Values represent three biological replicates. A two-tailed paired t-test (***p < 0.001) was used in (d). All error bars in panels (b–d) represent standard deviations.

Similar articles

Cited by

References

    1. O’Neill J. Review on Antimicrobial Resistance: Tackling drug resistant infections globally. London: 2014. https://amr-review.org/sites/default/files/AMR%20Review%20Paper%20-%20Ta....
    1. Bergogne-Berezin E, Towner KJ. Acinetobacter spp. as nosocomial pathogens: microbiological, clinical, and epidemiological features. Clinical microbiology reviews. 1996;9:148–165. - PMC - PubMed
    1. Antunes LC, Visca P, Towner KJ. Acinetobacter baumannii: evolution of a global pathogen. Pathogens and disease. 2014;71:292–301. doi: 10.1111/2049-632x.12125. - DOI - PubMed
    1. Dijkshoorn L, Nemec A, Seifert H. An increasing threat in hospitals: multidrug-resistant Acinetobacter baumannii. Nature reviews. Microbiology. 2007;5:939–951. doi: 10.1038/nrmicro1789. - DOI - PubMed
    1. Joly-Guillou ML. Clinical impact and pathogenicity of Acinetobacter. Clinical microbiology and infection : the official publication of the European Society of Clinical Microbiology and Infectious Diseases. 2005;11:868–873. doi: 10.1111/j.1469-0691.2005.01227.x. - DOI - PubMed

Publication types