. 2018 May 9;14(18):3471-3477.
doi: 10.1039/c8sm00126j.

Flocking transitions in confluent tissues

Affiliations

Flocking transitions in confluent tissues

Fabio Giavazzi et al. Soft Matter. .

Abstract

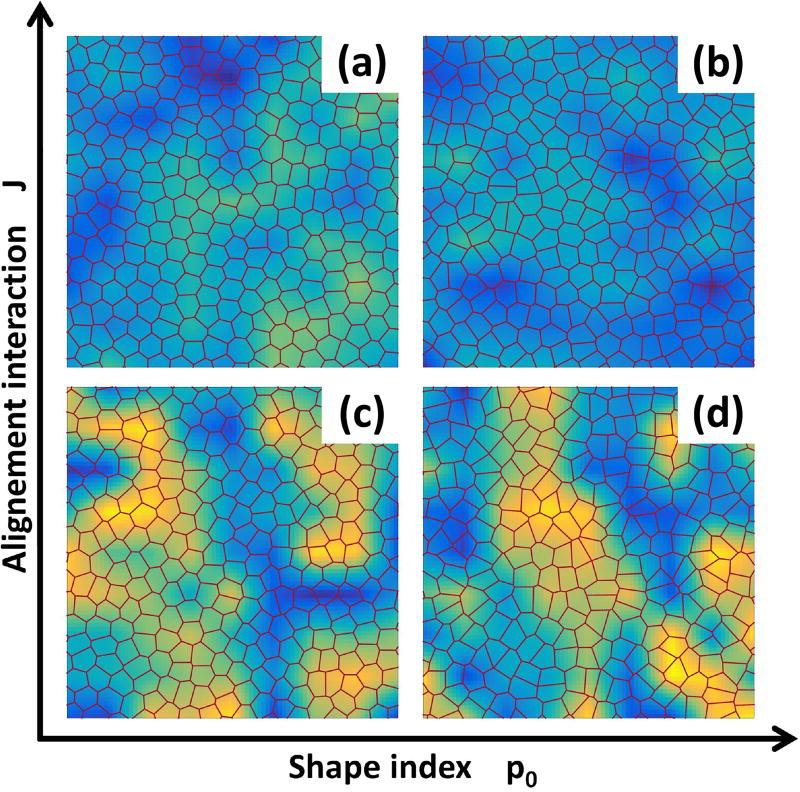
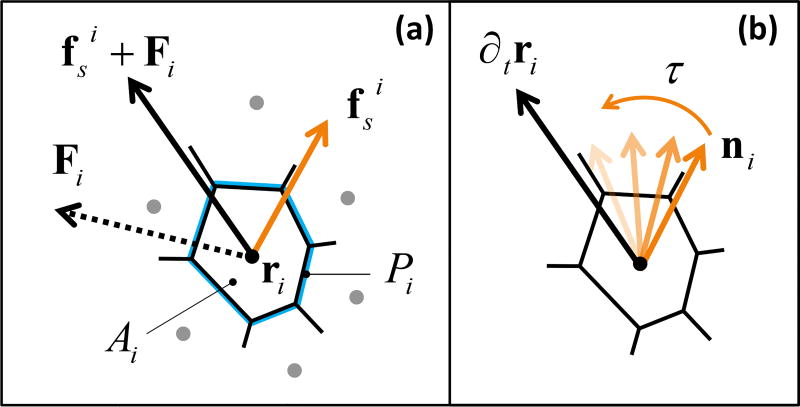
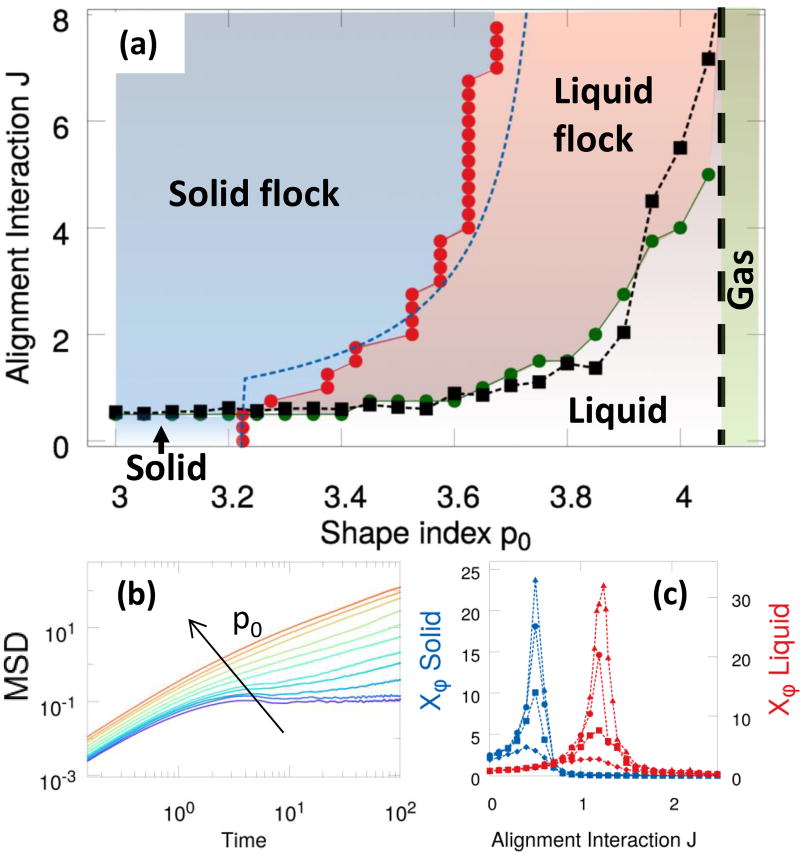
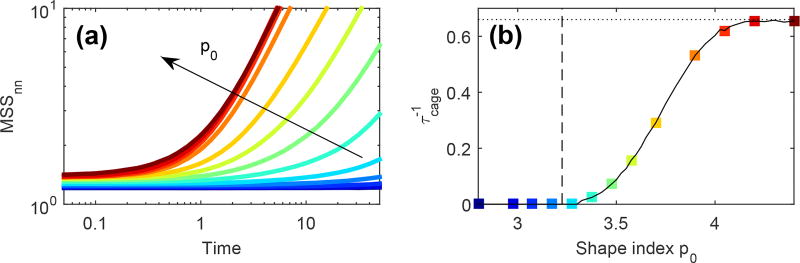
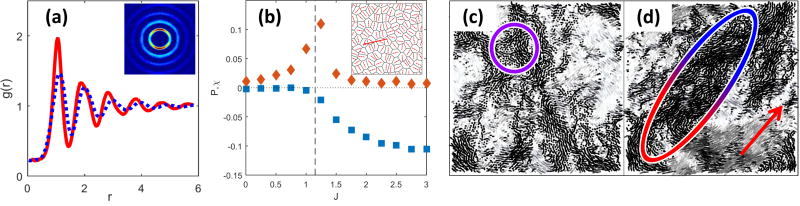
Collective cell migration in dense tissues underlies important biological processes, such as embryonic development, wound healing and cancer invasion. While many aspects of single cell movements are now well established, the mechanisms leading to displacements of cohesive cell groups are still poorly understood. To elucidate the emergence of collective migration in mechanosensitive cells, we examine a self-propelled Voronoi (SPV) model of confluent tissues with an orientational feedback that aligns a cell's polarization with its local migration velocity. While shape and motility are known to regulate a density-independent liquid-solid transition in tissues, we find that aligning interactions facilitate collective motion and promote solidification, with transitions that can be predicted by extending statistical physics tools such as effective temperature to this far-from-equilibrium system. In addition to accounting for recent experimental observations obtained with epithelial monolayers, our model predicts structural and dynamical signatures of flocking, which may serve as gateway to a more quantitative characterization of collective motility.


Conflict of interest statement

Conflicts of interest

There are no conflicts of interest to declare.

Figures

Fig. 1
Fig. 1
Four distinct dynamical phases. Strong alignment interaction yield solid-like (a) and liquid-like (b) flocking states. For weak polar coupling between cells the system is either in a stationary solid (c) or stationary liquid (d) phase. The heat map represents the cosine of the angle of the instantaneous velocity field with respect the horizontal axis: a uniform color indicates coherent migration in a given direction.
Fig. 2
Fig. 2
Schematic representation of the model. (a) Each cell is a polygon obtained by the Voronoi tessellation of initially random cell positions ri, characterized by the area Ai and the perimeter Pi of the polygon. The cell experiences a force Fi = −∇E due to its neighbors and an internal propulsive force fsi along the direction ni of its polarization (Eq. 2). (b) An active orientation mechanism reorients each cell’s propulsive force towards its migration velocity over a characteristic response time τ = J−1 (Eq. 3).
Fig. 3
Fig. 3
Phase diagram. (a) Different phases in the (p0,J) plane. The solid/liquid transition line (red circles) is obtained from the vanishing of Deff and the flocking transition line (green circles) corresponds to the peak in the susceptibility χφ. The dashed blue curve is the theoretical prediction Jc(v0,p0) given in (4). The black squares (the dashed line is a guide to the eye) are the estimate for Jflock(p0) in terms of the numerically calculated cage lifetime τcage at J = 0. The vertical dashed black line marks the transition to a gas-like state, observed for p0 ≳ 4.2, where flocking cannot occur. (b) The mean square displacement for J = 2.0 for a range of p0 ∈ [3.4,4] across the liquid/solid transition (curves from red to violet). (c) The susceptibility χφ for p0 = 3.1 (blue symbols, solid) and p0 = 3.7 (red symbols, liquid) and sizes N = 100, 400, 1600, 3200, diamonds, squares, circles, and triangles, respectively.
Fig. 4
Fig. 4
Identifying the caging timescale in the absence of alignment. (a) The neighbors mean-square separation MSSnn(t) as a function of the the time increment t becomes constant as p0 is decreased across the liquid-solid transition, showing the onset of caging. (b) The inverse cage lifetime τcage1 at J = 0 as a function of p0 calculated as described in the text. The vertical line denotes the critical value p0 of the J = 0 rigidity transition, while the horizontal dotted line is the asymptotic value τfree1 attained by τcage1 in the gas phase.
Fig. 5
Fig. 5
Structural and dynamical anisotropy of the flocking liquid. (a) Radial distribution function g(r,r) for a flocking liquid (p0 = 3.5, J = 2), evaluated along (g(0,r), red solid line) and perpendicular (g(r,0), blue dotted line) the direction of flocking. The inset shows an intensity plot of the 2D g(r), with the horizontal axis chosen along the flocking direction. (b) Order parameter P (blue squares) as a function of J for p0 = 3.7. In the non-flocking state P = 0, while at the flocking transition, identified by the peak in the susceptibility χ (orange triangles), P becomes negative, indicating a tendency of the cells to elongate in the direction normal to that of mean motion. Inset: representative snapshot of a flocking liquid (J = 2, p0 = 3.7); the small arrows indicate the orientation of the principal axis of each cell and the large arrow is in the direction of flocking. (c,d) Maps of the displacements Δri averaged over a time τα = 102 for (b) J = 0 and (c) J = 2 in a system of 4900 cells. Ellipses are guides to the eye for highlighting the anisotropy of the collective rearrangements in the flocking state. The red arrow indicates the average migration direction. (e,f) Spatial correlations C(x,0) (red triangles) and C(0,x) (blue circles) along axes longitudinal (x) and perpendicular (x) to the direction of mean motion of a given sample for J = 0 (e) and J = 2 (f), averaged over 102 samples (see ESI for details).

References

    1. Marjanovic N, Weinberg R, Chaffer C. Clinical chemistry. 2013;59:168. - PMC - PubMed
    1. Nieto M. Science. 2013;342:1234850. - PubMed
    1. Clark AG, Vignjevic DM. Current Opinion in Cell Biology. 2015;36:13–22. - PubMed
    1. Haeger A, Wolf K, Zegers M, Friedl P. Trends Cell Biology. 2015;25(9):556–66. - PubMed
    1. Thompson E, Newgreen D, Tarin D. Cancer Research. 2015;65(14):5991–5. - PubMed