. 2018 Apr 25;13(4):e0195904.
doi: 10.1371/journal.pone.0195904. eCollection 2018.

The timing of growth faltering has important implications for observational analyses of the underlying determinants of nutrition outcomes

Affiliations

The timing of growth faltering has important implications for observational analyses of the underlying determinants of nutrition outcomes

Harold Alderman et al. PLoS One. .

Abstract

Background: Growth faltering largely occurs in the first 23 months after birth and is thought to be largely determined by various harmful or protective socioeconomic conditions. Children 23 months or younger, however, have only been partially exposed to these conditions, implying that statistical associations between these conditions and child growth may be substantially smaller in samples that include younger children.

Objectives: To test the prediction that associations between child anthropometric outcomes and various socioeconomic conditions are systematically different for older and younger children.

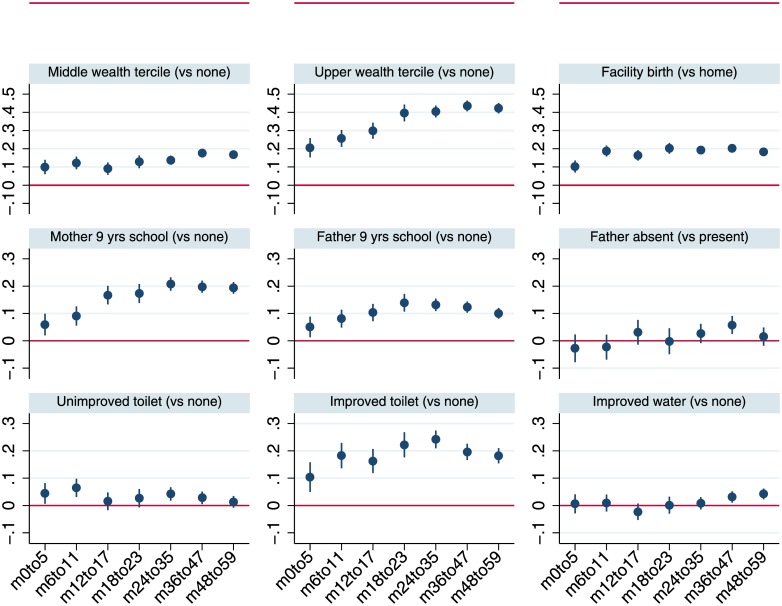
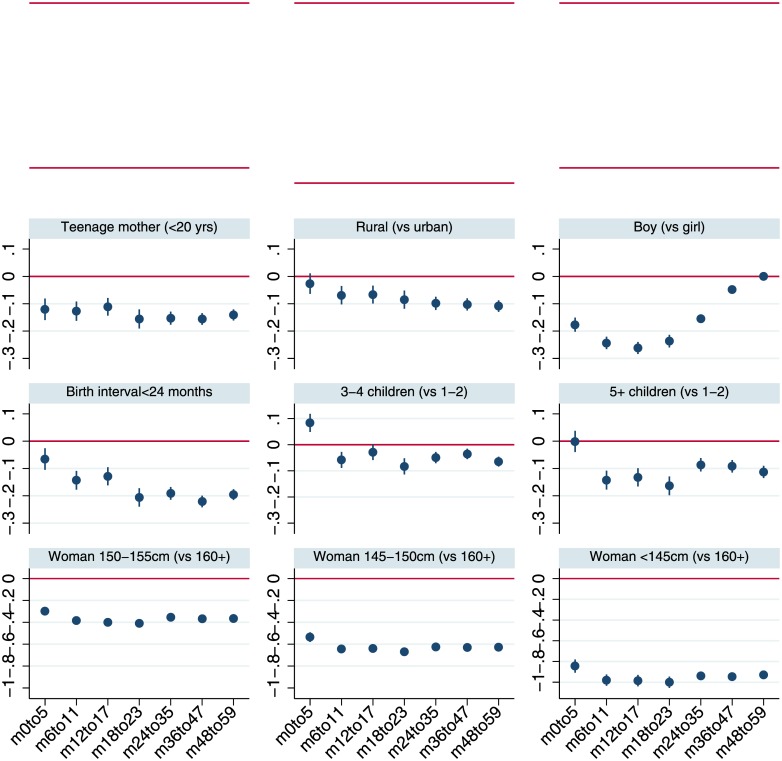
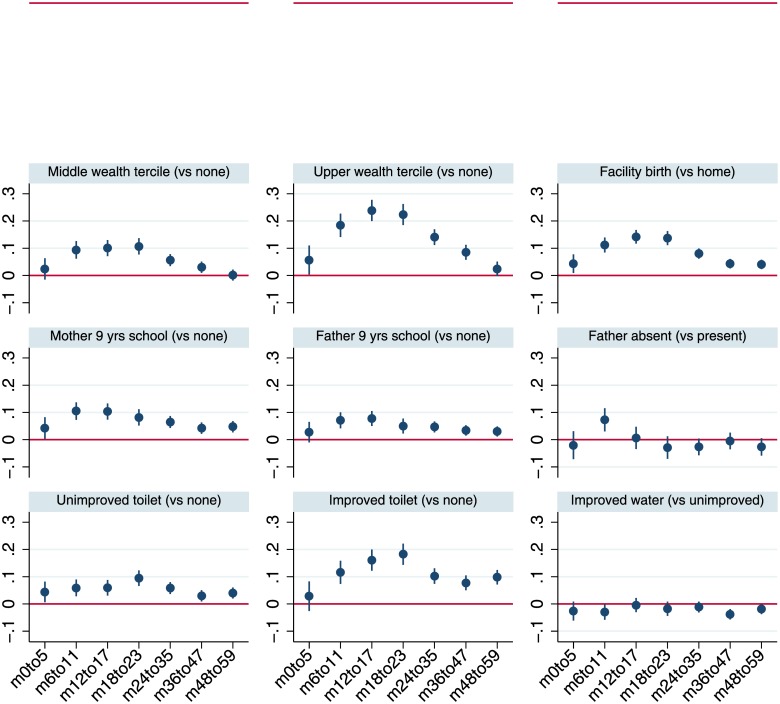
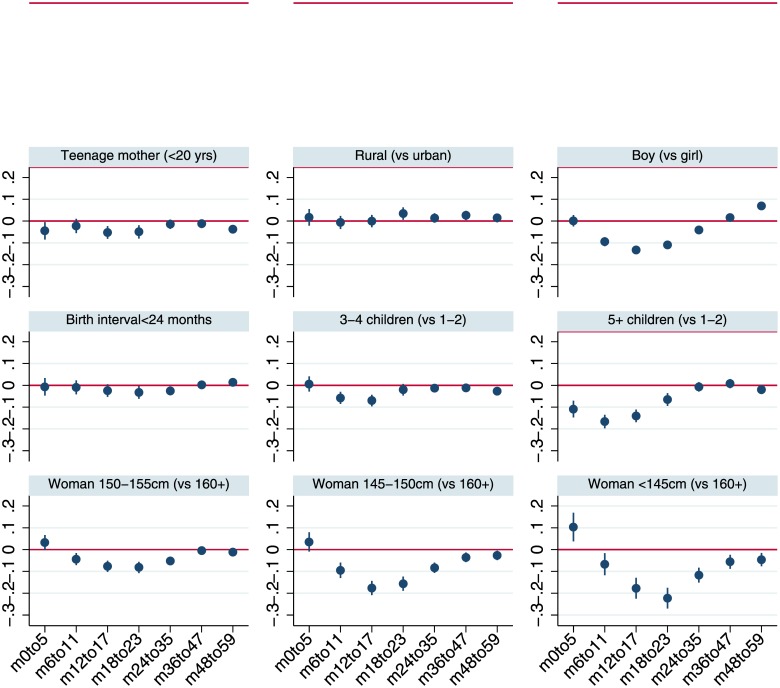
Methods: We analyzed data for 699,421 children aged 0-59 months, drawn from 125 DHS implemented between 1992 and 2014 in 57 countries. The outcome variables were height-for-age Z scores (HAZ) and stunting (HAZ<-2), and weight-for-height z scores (WHZ) and wasting (WHZ<-2). Independent variables included household wealth, parental education, maternal height, demographic factors, and exposure to WASH and health services. We used age-disaggregated regressions to examine how the associations between dependent and independent variables vary across different child age ranges.

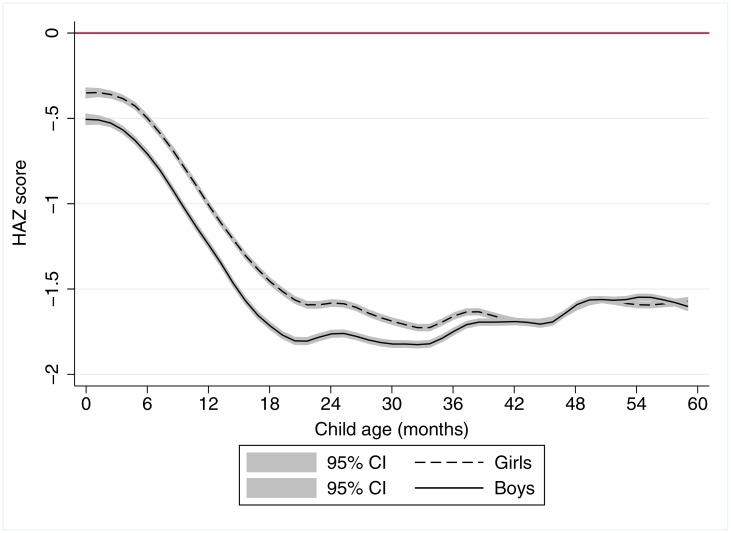
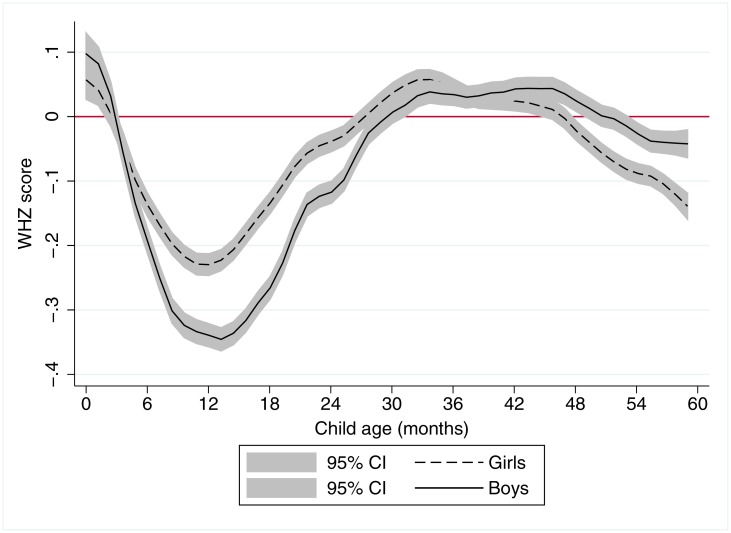
Results: Non-parametric regression results reaffirmed that most linear growth faltering and wasting takes place prior to 23 months of age. Estimates of the magnitude of association with wealth, education and improved toilet use from HAZ regressions are systematically larger in the sample of children 24-59 months than in the 0-23 month or 0-59 month samples; the reverse is true for WHZ regressions.

Conclusions: Previous observational analyses appear to substantially underestimate the protective impacts of a wide range of underlying determinants on stunting. Conversely, wasting rates are typically low for children 24-59 months, implying that associations between underlying conditions and wasting may be stronger for children 0-23 months of age. Such analyses should pay closer attention to age disaggregation; researchers should be aware of the age effect reported in the current study and present analysis stratified by age.


Conflict of interest statement

Competing Interests: The authors have declared that no competing interests exist.

Figures

Fig 1
Fig 1. A local polynomial regression plot of height-for-age z score against child age for 699,421 children aged 0–57 months in 58 countries.
Notes: The graph is based on local polynomial smoothing estimates of HAZ scores against child age for 699,421 children from 125 Demographic Health Surveys for 57 countries. 95% confidence intervals (CI) are reported in grey shading.
Fig 2
Fig 2. A local polynomial regression plot of weight-for-height z score against child age for 699,421 children aged 0–59 months in 57 countries.
Notes: The graph is based on local polynomial smoothing estimates of WHZ scores against child age for 699,421 children from 125 Demographic Health Surveys for 57 countries. 95% confidence intervals (CI) are reported in grey shading.
Fig 3
Fig 3. Least squares estimates for HAZ scores by age-restricted sub-samples: Household wealth, health facility access, parental education, household sanitation and water variables.
Notes: The figure reports coefficients and 95% confidence intervals based on cluster-adjusted standard errors from multivariable least squares regressions of HAZ against all the variables listed in Table 1, as well as country-year fixed effects and dummy variables for every month of child age. Samples sizes for the regressions estimated for the various age groups are 67,384 (0–5 months; m0to5), 75,965 (6–11 months; m6to11), 76,711 (12–17 months; m12to17), 68,694 (18–23 months; m18to23), 129,174 (24–35 months; m24-35), 138,342 (36–47 months; m36to47), 132,242 (48–59 months; m48to59).
Fig 4
Fig 4. Least squares estimates for HAZ scores by age-restricted sub-samples: Child, maternal and household demographic indicators and maternal height.
Notes: The figure reports coefficients and 95% confidence intervals based on cluster-adjusted standard errors from multivariable least squares regressions of HAZ against all the variables listed in Table 1, as well as country-year fixed effects and dummy variables for every month of child age. Samples sizes for the regressions estimated for the various age groups are 67,384 (0–5 months; m0to5), 75,965 (6–11 months; m6to11), 76,711 (12–17 months; m12to17), 68,694 (18–23 months; m18to23), 129,174 (24–35 months; m24-35), 138,342 (36–47 months; m36to47), 132,242 (48–59 months; m48to59).
Fig 5
Fig 5. Least squares estimates for WHZ scores by age-restricted sub-samples: Household wealth, health facility access, parental education, household sanitation and water variables.
Notes: The figure reports coefficients and 95% confidence intervals based on cluster-adjusted standard errors from multivariable least squares regressions of HAZ against all the variables listed in Table 1, as well as country-year fixed effects and dummy variables for every month of child age. Samples sizes for the regressions estimated for the various age groups are 67,384 (0–5 months; m0to5), 75,965 (6–11 months; m6to11), 76,711 (12–17 months; m12to17), 68,694 (18–23 months; m18to23), 129,174 (24–35 months; m24-35), 138,342 (36–47 months; m36to47), 132,242 (48–59 months; m48to59).
Fig 6
Fig 6. Least squares estimates for WHZ scores by age-restricted sub-samples: Child, maternal and household demographic indicators and maternal height.
Notes: The figure reports coefficients and 95% confidence intervals based on cluster-adjusted standard errors from multivariable least squares regressions of HAZ against all the variables listed in Table 1, as well as country-year fixed effects and dummy variables for every month of child age. Samples sizes for the regressions estimated for the various age groups are 67,384 (0–5 months; m0to5), 75,965 (6–11 months; m6to11), 76,711 (12–17 months; m12to17), 68,694 (18–23 months; m18to23), 129,174 (24–35 months; m24-35), 138,342 (36–47 months; m36to47), 132,242 (48–59 months; m48to59).

References

    1. Victora CG, de Onis M, Curi Hallal P, Blössner M, Shrimpton R. Worldwide Timing of Growth Faltering: Revisiting Implications for Interventions. Pediatrics. 2009;2010(125):473–80. - PubMed
    1. Shrimpton R, Victora CG, De Onis M, Costa Lima R, Blössner M, Clugston G. The Worldwide Timing of Growth Faltering: Implications for Nutritional Interventions. Pediatrics. 2001(107):e75. - PubMed
    1. Leroy JL, Ruel M, Habicht JP, Frongillo EA. Linear growth deficit continues to accumulate beyond the first 1000 days in low- and middle-income countries: global evidence from 51 national surveys. J Nutr. 2014;144(9):1460–6. doi: 10.3945/jn.114.191981 - DOI - PubMed
    1. Haddad L, Alderman H, Appleton S, Song L, Yohannes Y. Reducing child malnutrition: How far does income growth take us? World Bank Economic Review. 2003;17(1):107–31.
    1. Ruel MT, Alderman H. Nutrition-sensitive interventions and programmes: how can they help to accelerate progress in improving maternal and child nutrition? The Lancet. 2013;382(9891):536–51. - PubMed

Publication types