. 2018 Apr 25:148:w14607.
doi: 10.4414/smw.2018.14607. eCollection 2018.

Impairment of chondrocyte proliferation after exposure of young murine cartilage to an aged systemic environment in a heterochronic parabiosis model

Affiliations

Impairment of chondrocyte proliferation after exposure of young murine cartilage to an aged systemic environment in a heterochronic parabiosis model

Lu Li et al. Swiss Med Wkly. .

Abstract

Aim: The aim of this study was to investigate whether an aged systemic environment could impair young cartilage tissue in mice.

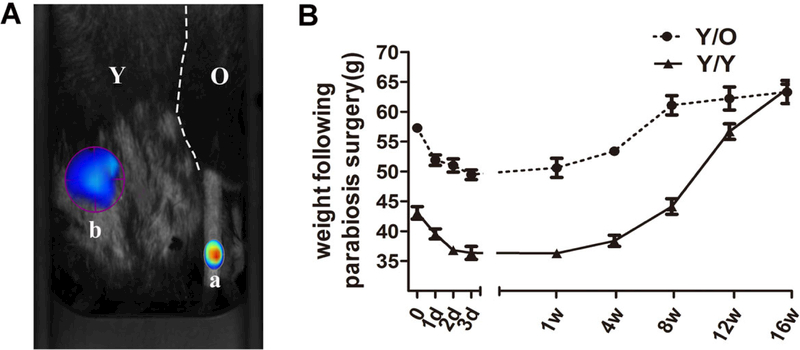
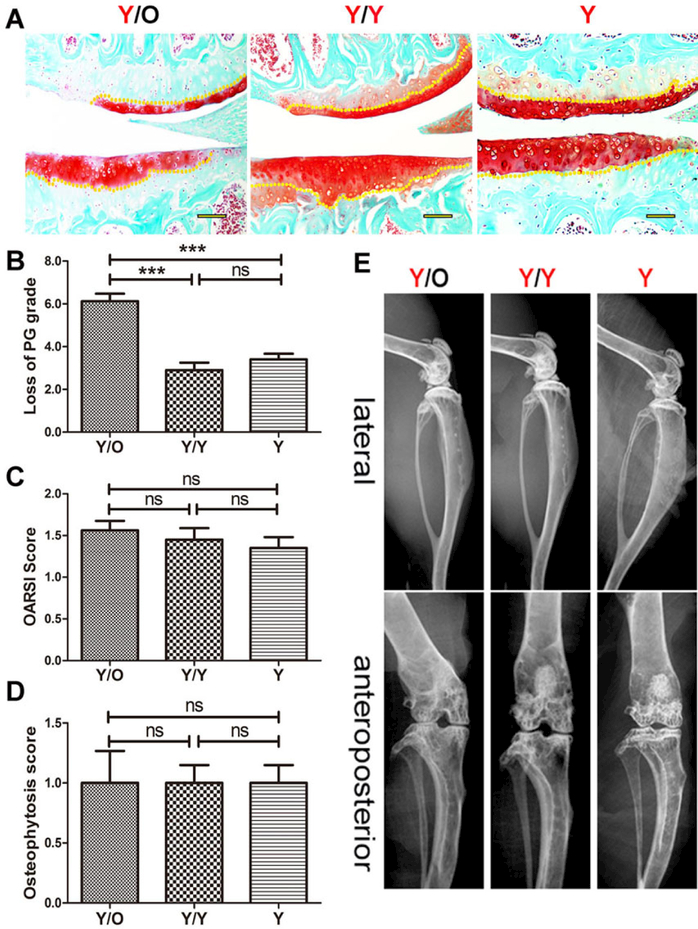
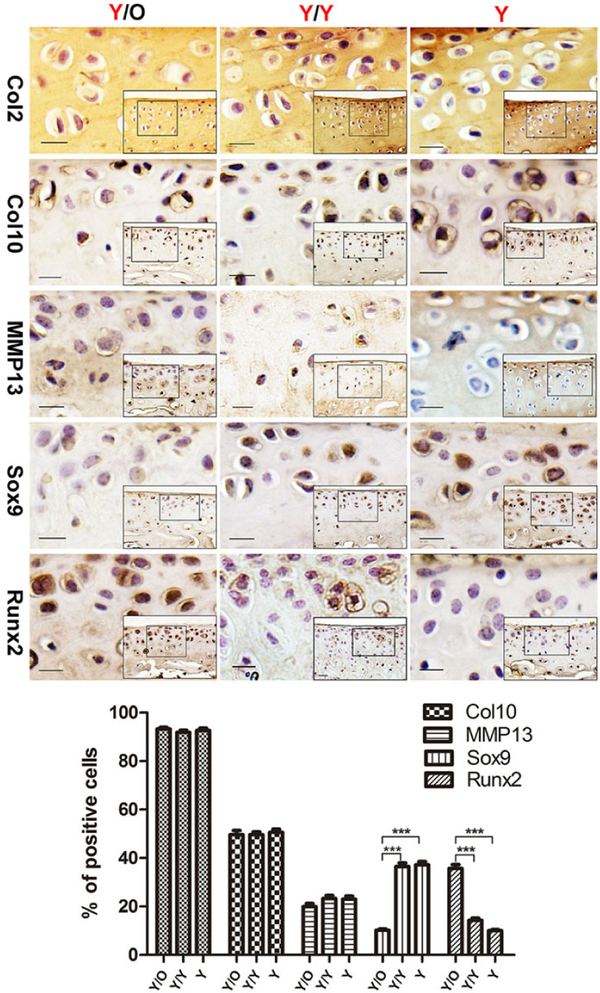
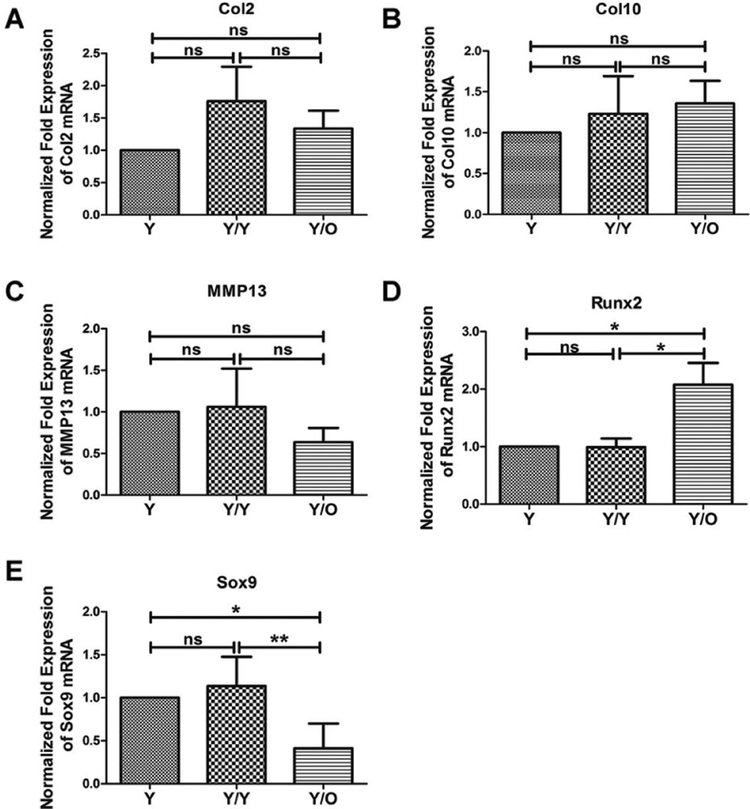
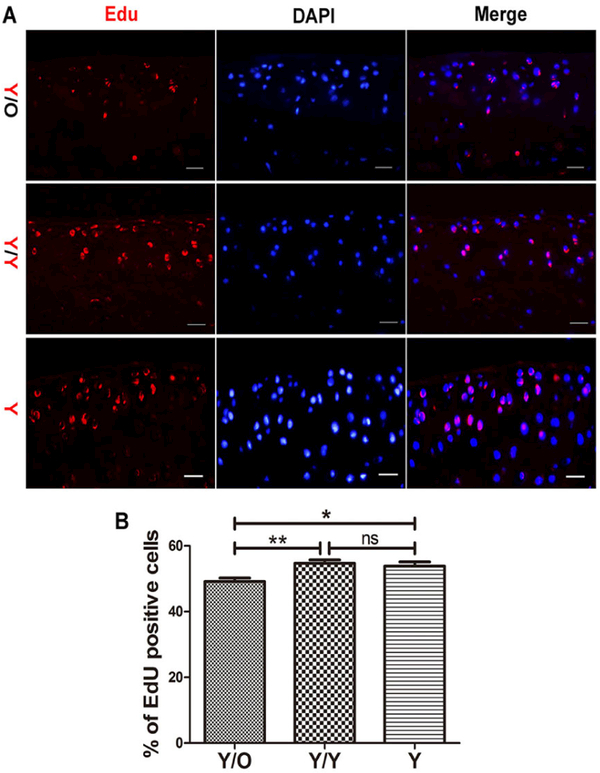
Methods: Mice differing in age were randomly divided into three groups. Group 1 was the experimental group (Y/O group) consisting of the heterochronic parabiosis model (2-month-old/12-month-old, young/old). Group 2 was the surgical control group (Y/Y group) with the isochronic parabiosis model (2-month-old/2-month-old, young/young). Group 3 consisted of the ageing control mice (2-month-old alone, Y group). Young knee cartilages collected from all three groups at 4 months after surgery were compared. Fluorescence molecular tomography (FMT) was used to confirm whether the two mice in parabiosis shared a common blood circulation at 2 weeks after surgery. The knee joints of young mice were examined radiologically at 4 months after surgery. Histological scoring was assigned to grade the severity of osteoarthritis (OA). Immunohistochemistry and quantitative reverse transcription polymerase chain reaction were used to evaluate OA-related protein expression and gene expression, and chondrocyte proliferation was determined with EdU staining.

Results: FMT imaging confirmed cross-circulation in the parabiotic pairs. The percentage of EdU-positive chondrocytes in young mice from the Y/O group was significantly lower compared with those of the Y/Y and Y groups (p <0.05 for both). There was no statistically significant difference in the mRNA expression of collagen type II (Col2), collagen type X (Col10), and matrix metalloproteinase 13 (MMP13) among the three groups (P>0.05), but expression of sex-determining region Y box 9 (Sox9) mRNA in young cartilage from the Y/O group was markedly attenuated compared to those in the Y/Y and Y groups (p <0.05 for both). In the Y/O group, mRNA expression of runt-related transcription factor 2 (Runx2) in young cartilage was significantly increased compared to the Y/Y and Y groups (p <0.05 for both). The changes in Col2, Col10, MMP13, Runx2 and Sox9 at the protein level mimicked the alterations found at the mRNA level. Loss of cartilage proteoglycan in young mice from the Y/O group was significantly greater compared to the Y/Y and Y groups (p <0.05 for both), despite the lack of significant difference among the three groups in OARIS and osteophytosis scores.

Conclusion: Heterochronic parabiosis exerts a negative effect on chondrocyte proliferation in the knee cartilage of young mice.


Conflict of interest statement

Potential competing interests

The authors declare that no competing interest exists.

Figures

Figure 1:
Figure 1:
Common circulation between two mice in the heterochronic parabiosis model. (A) At 2 weeks after parabiosis surgery, the old mouse of the parabiotic pair received an injection of ProSense 750FAST through the tail vein (position a) and ProSense 750FAST was activated around the needling wound in the young mouse of the parabiotic pair (position b), which was imaged with the FMT system 24 hours after injection. ProSense 750FAST agent was activated in the young mouse, which indicated that the mice had developed a shared blood circulation. (B) Absolute weights of the pairs (parabionts) measured at various times during recovery (8 Y/O pairs and 5 Y/Y pairs). Immediately following the surgery, both groups appeared to lose weight, which was followed by steady normalisation of the body weight. FMT = fluorescence molecular tomography; O = old; Y = young
Figure 2:
Figure 2:
Histological and radiographic changes in cartilage of young mice in the Y/O, Y/Y and Y groups. (A) PG decrease in young cartilage from the Y/O group was greater than that from the two other groups and histological scores in the Y/O group were relatively higher. Representative images are shown (8 Y/O mice, 10 Y/Y mice and 10 Y mice were used) Scale bar = 500 μm. (B) Loss of cartilage (proteoglycan grade) in young mice from the Y/O group was significantly greater compared to the Y/Y and Y groups. The area covered from the surface of the cartilage to the yellow dotted lines indicates the proteoglycan content. (C) There was no statistically significant difference in OARSI score among the three groups (p >0.05). (D, E) No significant pathological changes were detected in the micro-X-ray. The presence and severity of osteopenia and sclerosis among the three groups were not evident in this study, and osteophytosis was detected at the margins of the knee joint in young mice from the three groups. There was no statistically significant difference in osteophytosis scores among the three groups (p >0.05). The differences of the proteoglycan content, the Osteoarthritis Research Society International (OARSI) score and the osteophytosis scores among three groups were assessed by one-way ANOVA with Tukey’s post-hoc test.*** p <0.001. Values are presented as mean ± standard error of the mean. ns = not significant; O = old; Y = young
Figure 3:
Figure 3:
Protein expression of Col2, Col10, MMP13, Sox9 and Runx2 in articular cartilage. Young cartilage samples from Y/O, Y/Y and Y groups were analysed with immunohistochemistry for Col2, Col10, MMP13, Sox9 and Runx2. Col2, Col10 and MMP13 levels in young cartilage showed no statistically significant difference among the Y/O, Y/Y and Y groups (p >0.05). However, the level of Sox9 was reduced and the level of Runx2 was increased in young cartilage from the Y/O group compared to the Y/Y and Y groups. Scale bar = 200 μm. (8 Y/O mice, 10 Y/Y mice and 10 Y mice were used). One-way ANOVA with Tukey’s post-hoc test was used to assess the difference in the percentage of positive cells with Col2, Col10, MMP13, Sox9 and Runx2 protein expression among the three groups.*** p <0.001. Values are presented as mean ± standard error of the mean. Col2 = collagen type II; Col10 = collagen type X; MMP13 = matrix metalloproteinase 13; O = old; Runx2 = runt-related transcription factor 2; Sox9 = sex-determining region Y box 9; Y = young
Figure 4:
Figure 4:
Messenger RNA expression of cartilage-associated genes in articular cartilage. Expression of Col2, Col10, MMP13, Sox9 and Runx2 was determined with qRT-PCR in the articular cartilage samples and no significant differences in the expression of the Col2, Col10 and MMP13 could be detected when the three groups were compared (A, B, C). However, a significant increase in the expression of Runx2 and a significant decrease of Sox9 were measured in young cartilages from the Y/O group (D, E) (8 Y/O mice, 10 Y/Y mice and 10 Y mice were used). One-way ANOVA with Tukey’s post-hoc test was used to assess the difference in mRNA expression of Col2, Col10, MMP13, Sox9 and Runx2 among the three groups.* p <0.05; ** p < 0.01. Values are presented as mean ± standard error of the mean. Col2 = collagen type II; Col10 = collagen type X; MMP13 = matrix metalloproteinase 13; ns = not significant; O = old; qRT-PCR = quantitative reverse transcription polymerase chain reaction; Runx2 = runt-related transcription factor 2; Sox9 = sex-determining region Y box 9; Y = young
Figure 5:
Figure 5:
Young mice in the Y/O group displayed a lower percentage of EdU-positive chondrocytes. (A) Chondrocyte proliferation decreased in the Y/O group. Pictures are shown with 400 × magnification. Scale bar = 200 μm. (B) The young mice in the Y/O group had significantly lower rates of chondrocyte proliferation compared to the two other control groups (8 mice per group). One-way ANOVA with Tukey’s post-hoc test was used to assess the difference of the percentage of EdU-positive chondrocytes among three groups.* p <0.05, ** p <0.01. Values are presented as mean ± standard error of the mean. EdU = 5-ethynyl-2’-deoxyuridine; O = old; ns, = not significant; Y = young

References

    1. Loeser RF. Aging and osteoarthritis. Curr Opin Rheumatol. 2011;23(5):492–6. doi: 10.1097/BOR.0b013e3283494005 PubMed. - DOI - PMC - PubMed
    1. Loeser RF. Aging processes and the development of osteoarthritis. Curr Opin Rheumatol. 2013;25(1):108–13. doi: 10.1097/BOR.0b013e32835a9428 PubMed. - DOI - PMC - PubMed
    1. Zhang Y, Jordan JM. Epidemiology of osteoarthritis. Clin Geriatr Med. 2010;26(3):355–69. doi: 10.1016/j.cger.2010.03.001 PubMed. - DOI - PMC - PubMed
    1. Johnson VL, Hunter DJ. The epidemiology of osteoarthritis. Best Pract Res Clin Rheumatol. 2014;28(1):5–15. doi: 10.1016/j.berh.2014.01.004 PubMed. - DOI - PubMed
    1. Komori T Cell death in chondrocytes, osteoblasts, and osteocytes. Int J Mol Sci 2016;17(12):2045. doi: 10.3390/ijms17122045 PubMed. - DOI - PMC - PubMed

Substances