

Synergistic SHAPE/Single-Molecule Deconvolution of RNA Conformation under Physiological Conditions
- PMID: 29694857
- PMCID: PMC5937115
- DOI: 10.1016/j.bpj.2018.02.022
Synergistic SHAPE/Single-Molecule Deconvolution of RNA Conformation under Physiological Conditions
Abstract
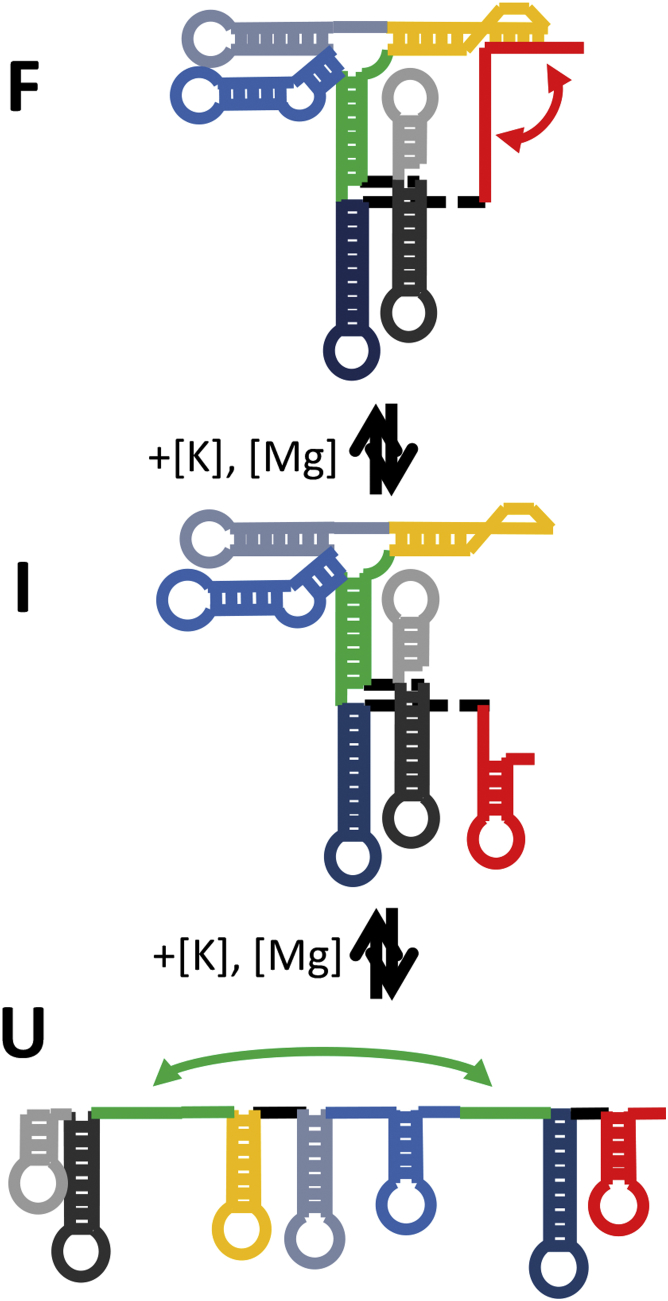
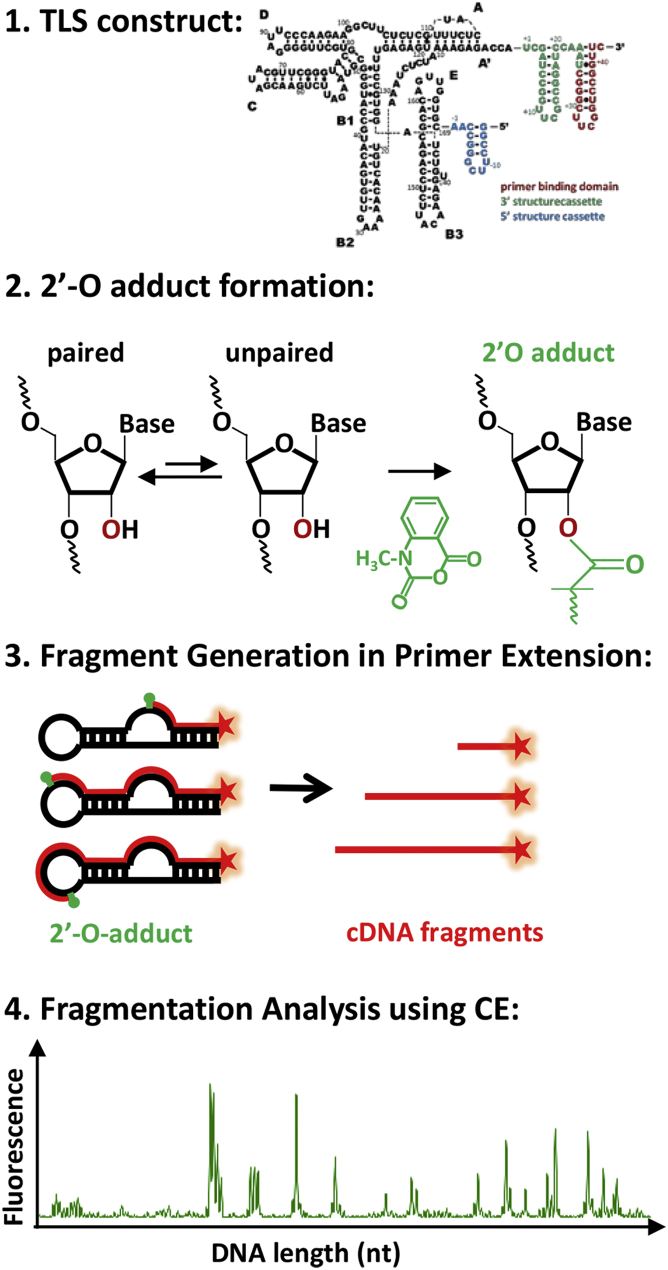
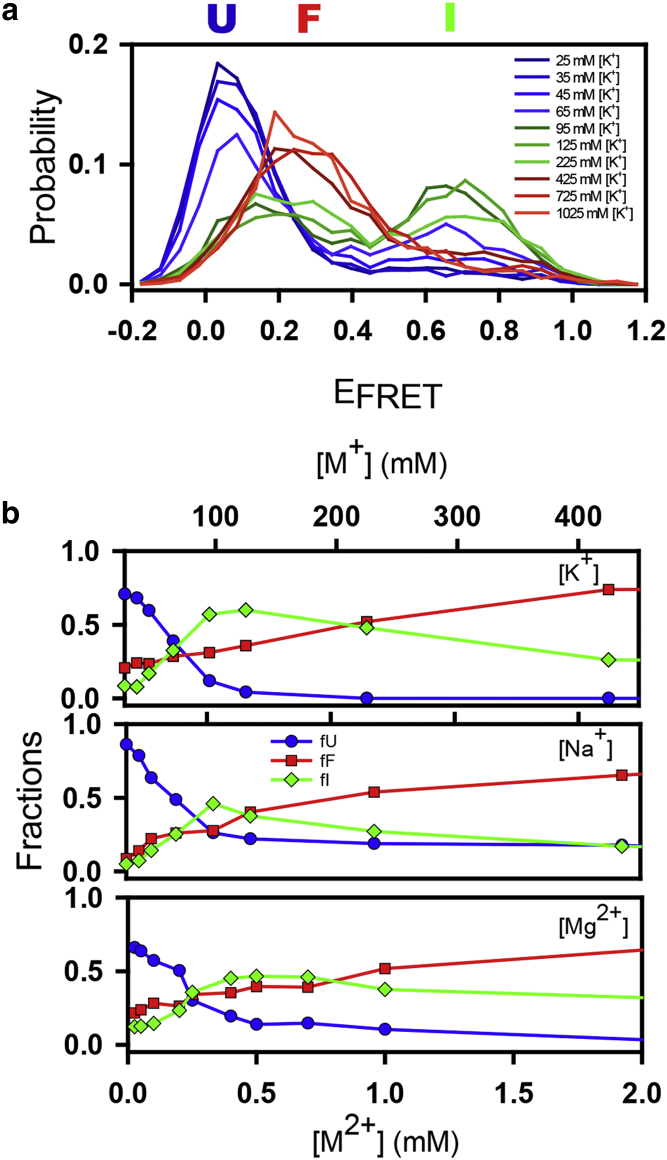
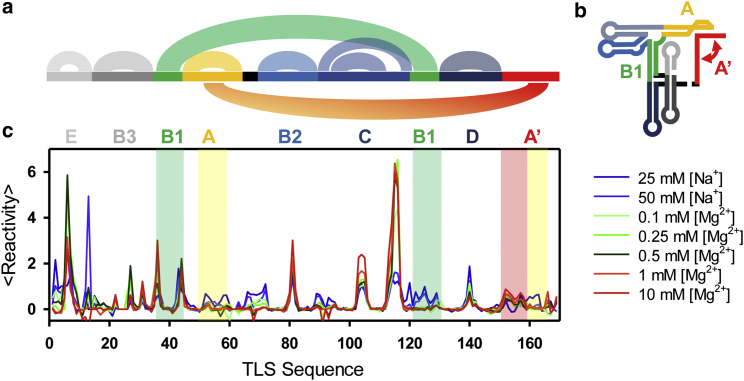
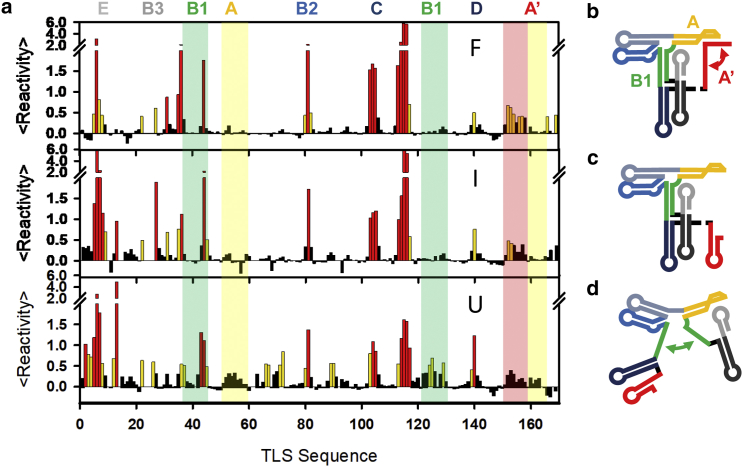
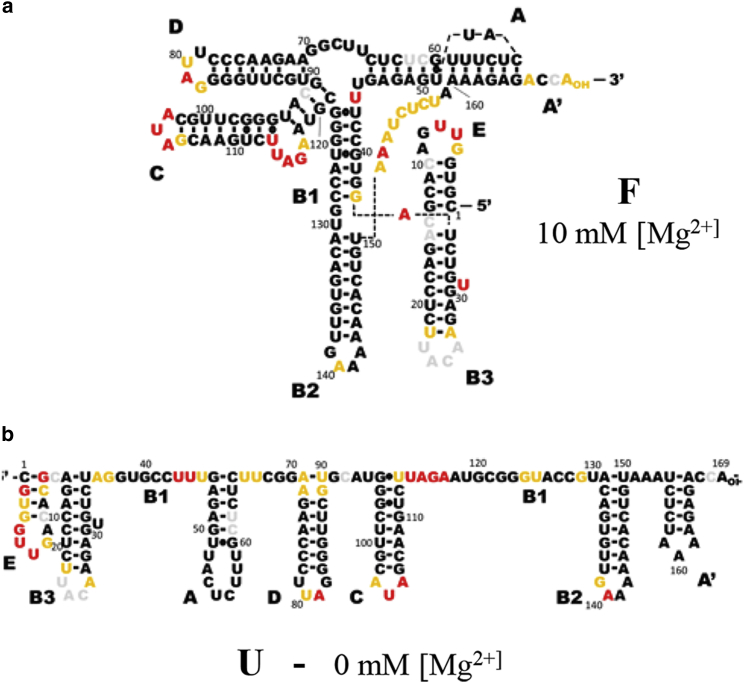
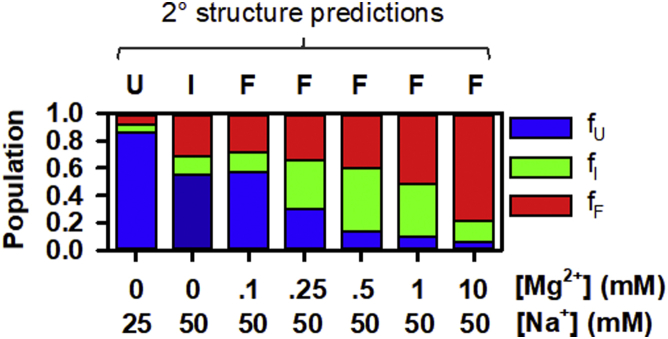
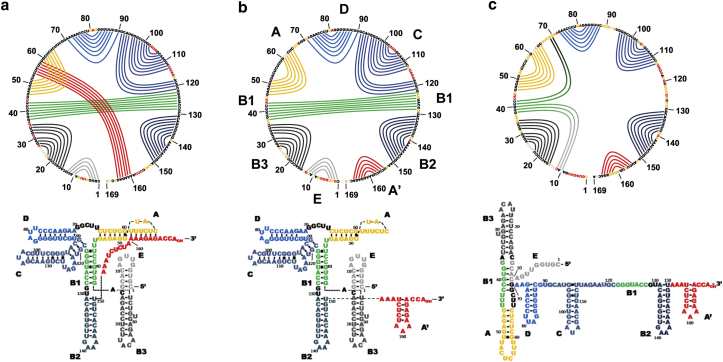
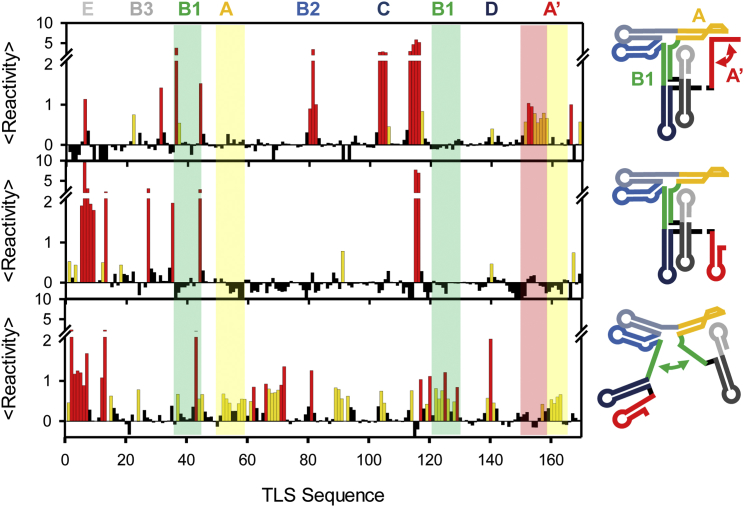
Structural RNA domains are widely involved in the regulation of biological functions, such as gene expression, gene modification, and gene repair. Activity of these dynamic regions depends sensitively on the global fold of the RNA, in particular, on the binding affinity of individual conformations to effector molecules in solution. Consequently, both the 1) structure and 2) conformational dynamics of noncoding RNAs prove to be essential in understanding the coupling that results in biological function. Toward this end, we recently reported observation of three conformational states in the metal-induced folding pathway of the tRNA-like structure domain of Brome Mosaic Virus, via single-molecule fluorescence resonance energy transfer studies. We report herein selective 2'-hydroxyl acylation analyzed by primer extension (SHAPE)-directed structure predictions as a function of metal ion concentrations ([Mn+]) to confirm the three-state folding model, as well as test 2° structure models from the literature. Specifically, SHAPE reactivity data mapped onto literature models agrees well with the secondary structures observed at 0-10 mM [Mg2+], with only minor discrepancies in the E hairpin domain at low [Mg2+]. SHAPE probing and SHAPE-directed structure predictions further confirm the stepwise unfolding pathway previously observed in our single-molecule studies. Of special relevance, this means that reduction in the metal-ion concentration unfolds the 3' pseudoknot interaction before unfolding the long-range stem interaction. This work highlights the synergistic power of combining 1) single-molecule Förster resonance energy transfer and 2) SHAPE-directed structure-probing studies for detailed analysis of multiple RNA conformational states. In particular, single-molecule guided deconvolution of the SHAPE reactivities permits 2° structure predictions of isolated RNA conformations, thereby substantially improving on traditional limitations associated with current structure prediction algorithms.
Copyright © 2018. Published by Elsevier Inc.
Figures
Similar articles
-
Single-Molecule FRET Reveals Three Conformations for the TLS Domain of Brome Mosaic Virus Genome.Biophys J. 2015 Dec 15;109(12):2625-2636. doi: 10.1016/j.bpj.2015.10.006. Biophys J. 2015. PMID: 26682819 Free PMC article.
-
Solution structure of the 3'-end of brome mosaic virus genomic RNAs. Conformational mimicry with canonical tRNAs.J Mol Biol. 1994 Jan 14;235(2):508-31. doi: 10.1006/jmbi.1994.1010. J Mol Biol. 1994. PMID: 8289279
-
Non-canonical substrates of aminoacyl-tRNA synthetases: the tRNA-like structure of brome mosaic virus genomic RNA.Biochimie. 1993;75(12):1143-57. doi: 10.1016/0300-9084(93)90014-j. Biochimie. 1993. PMID: 8199250 Review.
-
Selective 2'-hydroxyl acylation analyzed by primer extension (SHAPE): quantitative RNA structure analysis at single nucleotide resolution.Nat Protoc. 2006;1(3):1610-6. doi: 10.1038/nprot.2006.249. Nat Protoc. 2006. PMID: 17406453
-
SHAPE Directed Discovery of New Functions in Large RNAs.Acc Chem Res. 2021 May 18;54(10):2502-2517. doi: 10.1021/acs.accounts.1c00118. Epub 2021 May 7. Acc Chem Res. 2021. PMID: 33960770 Free PMC article. Review.
Cited by
-
Challenges and approaches to predicting RNA with multiple functional structures.RNA. 2018 Dec;24(12):1615-1624. doi: 10.1261/rna.067827.118. Epub 2018 Aug 24. RNA. 2018. PMID: 30143552 Free PMC article. Review.
-
On the Problem of Reconstructing a Mixture of RNA Structures.Bull Math Biol. 2020 Oct 7;82(10):133. doi: 10.1007/s11538-020-00804-0. Bull Math Biol. 2020. PMID: 33029669 Free PMC article.
References
Publication types
MeSH terms
Substances
LinkOut - more resources
Full Text Sources
Other Literature Sources
