

Influence of Micropatterning on Human Periodontal Ligament Cells' Behavior
- PMID: 29694875
- PMCID: PMC5937357
- DOI: 10.1016/j.bpj.2018.02.041
Influence of Micropatterning on Human Periodontal Ligament Cells' Behavior
Abstract
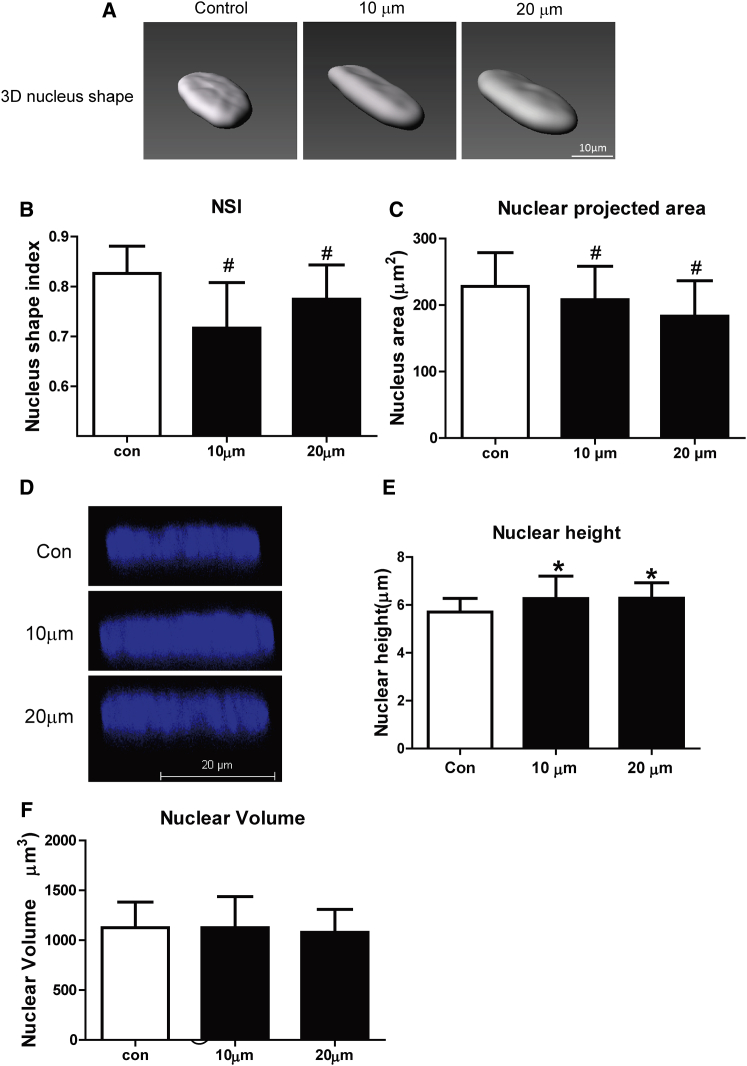
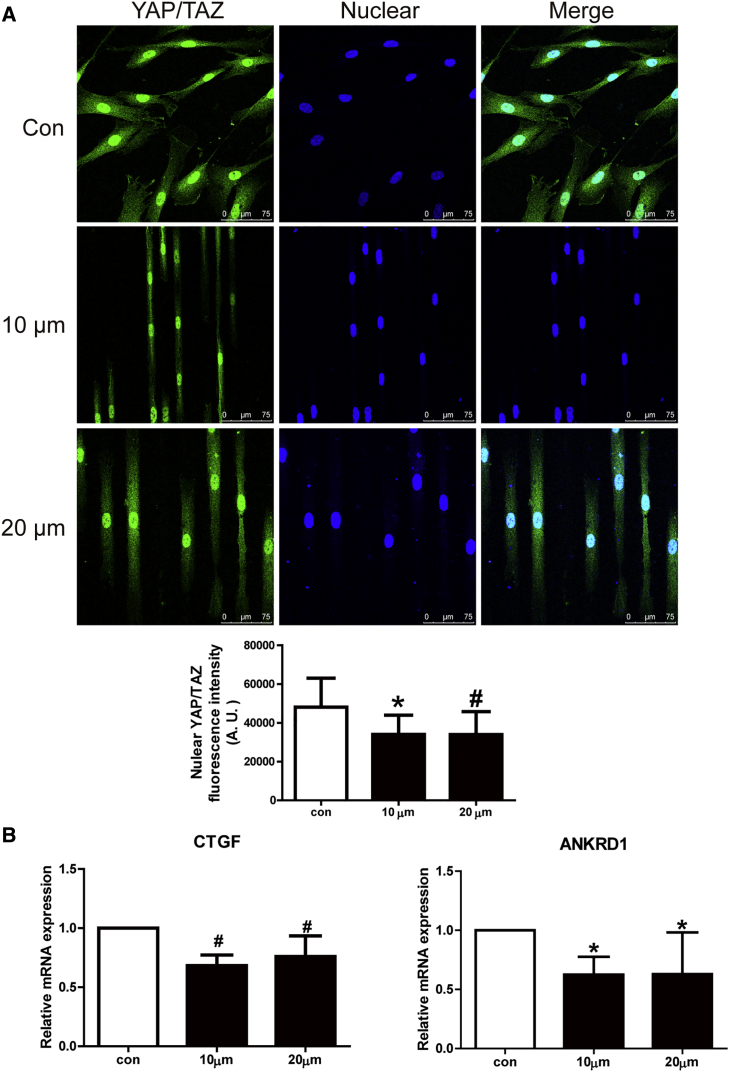
The periodontal ligament (PDL) is highly ordered connective tissue located between the alveolar bone and cementum. An aligned and organized architecture is required for its physiological function. We applied micropatterning technology to arrange PDL cells in 10- or 20-μm-wide extracellular protein patterns. Cell and nuclear morphology, cytoskeleton, proliferation, differentiation, and matrix metalloproteinase system expression were investigated. Micropatterning clearly elongated PDL cells with a low cell-shape index and low spreading area. The nucleus was also elongated as nuclear height increased, but the nuclear volume remained intact. The cytoskeleton was rearranged to form prominent bundles at cells' peripheral regions. Moreover, proliferation was promoted by 10- and 20-μm micropatterning. Osteogenesis and adipogenesis were each inhibited, but micropatterning increased PDL cells' stem cell markers. β-catenin was expelled to cytoplasm. YAP/TAZ nuclear localization and activity both decreased, which might indicate their role in micropatterning-regulated differentiation. Collagen Ι expression increased in micropatterned groups. It might be due to the decreased expression of matrix metalloproteinase-1, 2 and the tissue inhibitor of metalloproteinase-1 gene expression elevation in micropatterned groups. The findings of this study provide insight into the effects of a micropatterned surface on PDL cell behavior and may be applicable in periodontal tissue regeneration.
Copyright © 2018 Biophysical Society. Published by Elsevier Inc. All rights reserved.
Figures


Similar articles
-
Participation of periodontal ligament cells with regeneration of alveolar bone.J Periodontol. 2001 Mar;72(3):314-23. doi: 10.1902/jop.2001.72.3.314. J Periodontol. 2001. PMID: 11327058
-
Differentiating zones at periodontal ligament-bone and periodontal ligament-cementum entheses.J Periodontal Res. 2015 Dec;50(6):870-80. doi: 10.1111/jre.12281. Epub 2015 Jun 1. J Periodontal Res. 2015. PMID: 26031604 Free PMC article.
-
Characterization of stem cells from alveolar periodontal ligament.Tissue Eng Part A. 2011 Apr;17(7-8):1015-26. doi: 10.1089/ten.tea.2010.0140. Epub 2010 Dec 27. Tissue Eng Part A. 2011. PMID: 21186958
-
Lipopolysaccharide from Escherichia coli stimulates osteogenic differentiation of human periodontal ligament stem cells through Wnt/β-catenin-induced TAZ elevation.Mol Oral Microbiol. 2019 Feb;34(1). doi: 10.1111/omi.12249. Epub 2018 Dec 11. Mol Oral Microbiol. 2019. PMID: 30387555
-
Advances in micropatterning technology for mechanotransduction research.Mechanobiol Med. 2024 Mar 28;2(3):100066. doi: 10.1016/j.mbm.2024.100066. eCollection 2024 Sep. Mechanobiol Med. 2024. PMID: 40395493 Free PMC article. Review.
Cited by
-
Bioprinting PDLSC-Laden Collagen Scaffolds for Periodontal Ligament Regeneration.ACS Appl Mater Interfaces. 2024 Nov 6;16(44):59979-59990. doi: 10.1021/acsami.4c13830. Epub 2024 Oct 28. ACS Appl Mater Interfaces. 2024. PMID: 39467547 Free PMC article.
-
Gelatin-assisted conglutination of aligned polycaprolactone nanofilms into a multilayered fibre-guiding scaffold for periodontal ligament regeneration.RSC Adv. 2019 Jan 2;9(1):507-518. doi: 10.1039/c8ra09073d. eCollection 2018 Dec 19. RSC Adv. 2019. PMID: 35521598 Free PMC article.
-
Switch-like enhancement of epithelial-mesenchymal transition by YAP through feedback regulation of WT1 and Rho-family GTPases.Nat Commun. 2019 Jun 26;10(1):2797. doi: 10.1038/s41467-019-10729-5. Nat Commun. 2019. PMID: 31243273 Free PMC article.
-
Biomimetic Tubular Matrix Induces Periodontal Ligament Principal Fiber Formation and Inhibits Osteogenic Differentiation of Periodontal Ligament Stem Cells.ACS Appl Mater Interfaces. 2022 Aug 17;14(32):36451-36461. doi: 10.1021/acsami.2c09420. Epub 2022 Aug 7. ACS Appl Mater Interfaces. 2022. PMID: 35938610 Free PMC article.
-
Fabrication of Gelatin Methacrylate (GelMA) Scaffolds with Nano- and Micro-Topographical and Morphological Features.Nanomaterials (Basel). 2019 Jan 18;9(1):120. doi: 10.3390/nano9010120. Nanomaterials (Basel). 2019. PMID: 30669422 Free PMC article.
References
-
- Pihlstrom B.L., Michalowicz B.S., Johnson N.W. Periodontal diseases. Lancet. 2005;366:1809–1820. - PubMed
-
- Darby I.B., Morris K.H. A systematic review of the use of growth factors in human periodontal regeneration. J. Periodontol. 2013;84:465–476. - PubMed
-
- Crea A., Dassatti L., Deli G. Treatment of intrabony defects using guided tissue regeneration or enamel matrix derivative: a 3-year prospective randomized clinical study. J. Periodontol. 2008;79:2281–2289. - PubMed
-
- Sanz M., Giovannoli J.L. Focus on furcation defects: guided tissue regeneration. Periodontol. 2000. 2000;22:169–189. - PubMed
Publication types
MeSH terms
Substances
LinkOut - more resources
Full Text Sources
Other Literature Sources
