. 2018 Apr 24;23(4):1072-1084.
doi: 10.1016/j.celrep.2018.03.125.

Multiplexed Quantitation of Intraphagocyte Mycobacterium tuberculosis Secreted Protein Effectors

Affiliations

Multiplexed Quantitation of Intraphagocyte Mycobacterium tuberculosis Secreted Protein Effectors

Fadel Sayes et al. Cell Rep. .

Abstract

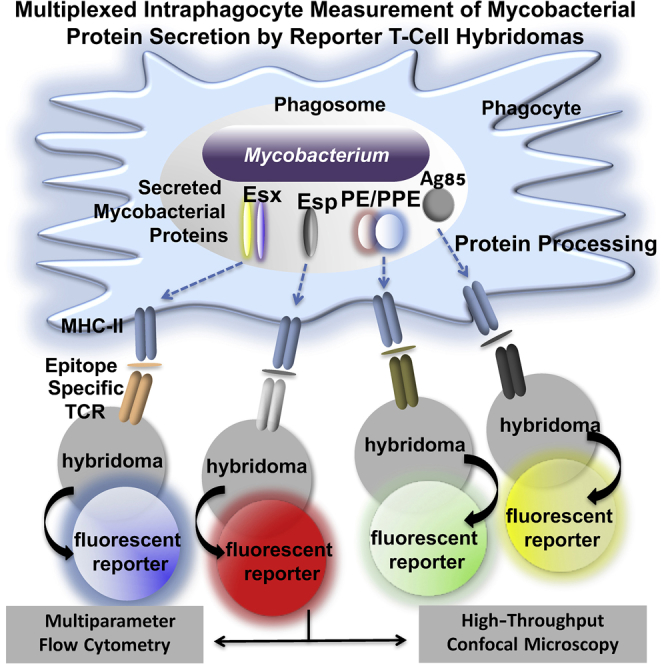
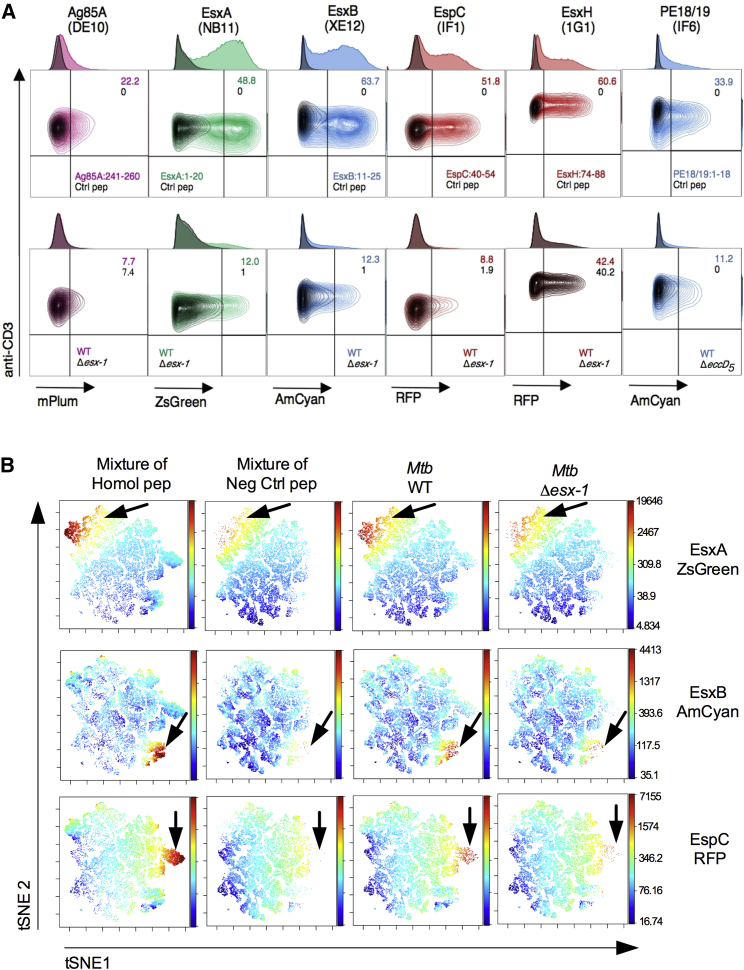
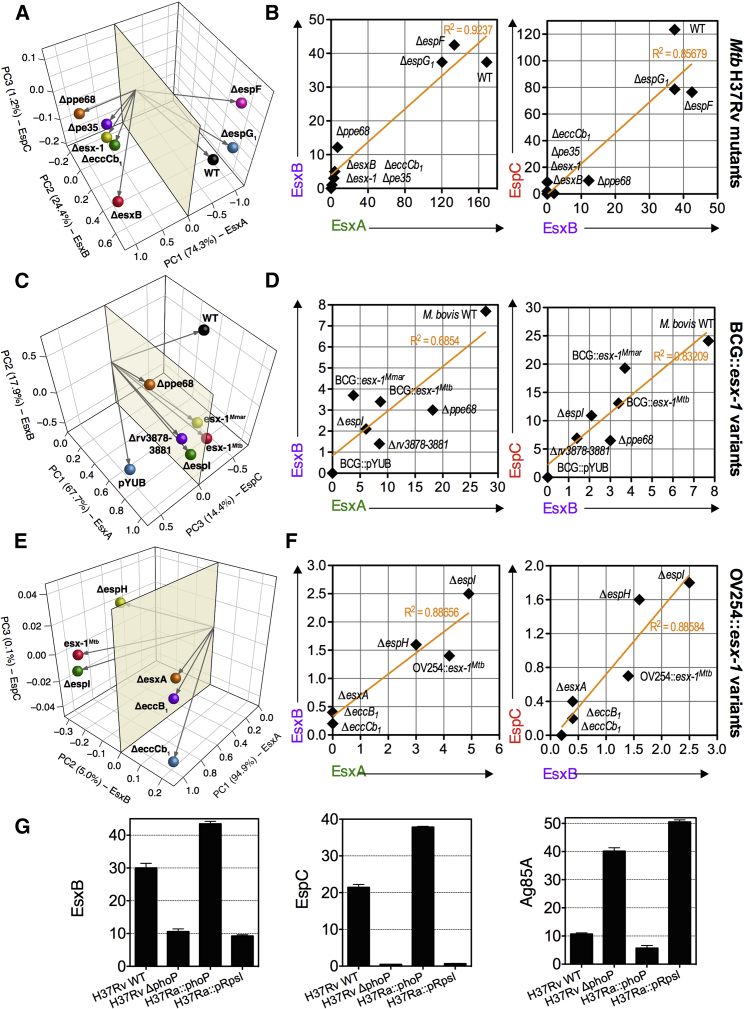
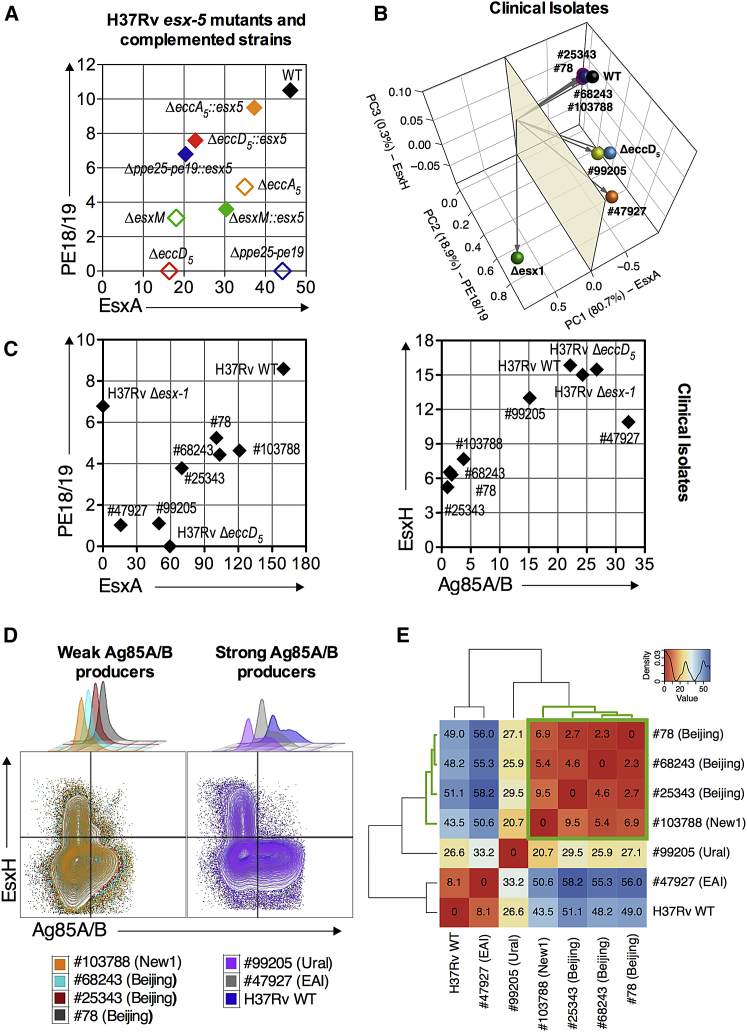
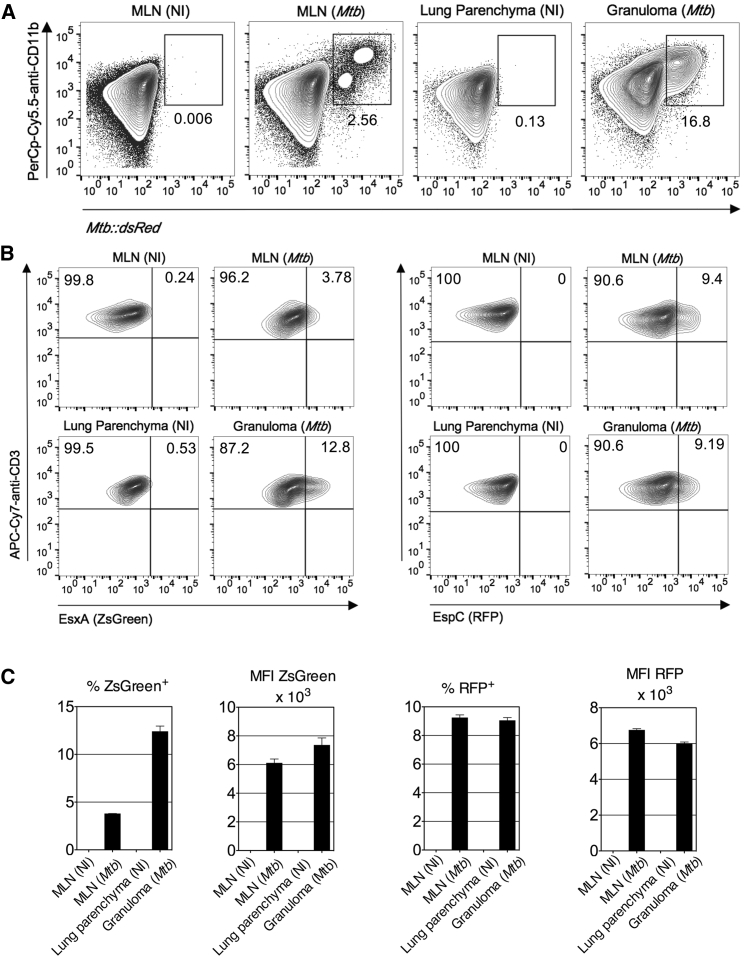
The pathogenic potential of Mycobacterium tuberculosis largely depends on ESX secretion systems exporting members of the multigenic Esx, Esp, and PE/PPE protein families. To study the secretion and regulation patterns of these proteins while circumventing immune cross-reactions due to their extensive sequence homologies, we developed an approach that relies on the recognition of their MHC class II epitopes by highly discriminative T cell receptors (TCRs) of a panel of T cell hybridomas. The latter were engineered so that each expresses a unique fluorescent reporter linked to specific antigen recognition. The resulting polychromatic and multiplexed imaging assay enabled us to measure the secretion of mycobacterial effectors inside infected host cells. We applied this novel technology to a large panel of mutants, clinical isolates, and host-cell types to explore the host-mycobacteria interplay and its impact on the intracellular bacterial secretome, which also revealed the unexpected capacity of phagocytes from lung granuloma to present mycobacterial antigens via MHC class II.

Keywords: T-cell hybridomas; bacterial antigen presentation; intracellular bacteria; in vivo antigen presentation; lentiviral vectors; mycobacterial virulence factors; mycobacterium tuberculosis; protein localization; reporter T cells; type VII secretion systems.


Figures

None
Graphical abstract
Figure 1
Figure 1
Characteristics of the T Cell Hybridomas Specific to Several T7S Substrates (A–D) Specificity and sensitivity of T cell hybridomas specific to various substrates of ESX-1 (A), ESX-3 (B), ESX-5 (C), or Tat (D) systems, as determined by their co-culture with DCs, loaded with various concentrations of peptides harboring MHC class II epitopes or negative controls. (E–H) Capacity of these T cell hybridomas, specific to substrates secreted by ESX-1 (E), ESX-3 (F), ESX-5 (G), or Tat (H) secretion systems, to recognize DCs infected with WT Mtb H37Rv, BCG, or appropriate Mtb mutants. Shown are concentrations of IL-2 in the co-culture supernatants at 24 hr after T cell addition. Error bars represent the SD of biological co-culture duplicates. Results are representative of 2 experiments. See also Figures S1 and S2 and Table S1.
Figure 2
Figure 2
T Cell-Based Topography of T7S Substrates in Mycobacteria Subcellular Compartments (A–C) Various concentrations of culture filtrates, filtered whole-cell lysates, or different fractions resulting from ultracentrifugation of the whole-cell lysates, prepared from Mtb H37Rv WT or appropriate mutants, were added to the co-cultures of DC and EsxA-specific (A), EsxB-specific (B), or PE18/19-specific (C) T cell hybridomas. Shown are concentrations of IL-2 in the co-culture supernatants at 24 hr, which were proportional to the content of T7S-substrate-derived epitopes in the sub-bacterial fractions. The lower detection limit of EsxA- or EsxB-specific T cell hybridomas is 50 ng/mL, and that of PE18/19-specific T cell hybridomas is 150 ng/mL. (D) Western blot detection of EsxA and EsxB in the same fractions as in (A) and (B). EsxN and SigA detection were performed as positive control for secretion and as lysis and loading control, respectively. Although some SigA was detected in concentrated culture filtrates, this did not vary between strains and could not alternatively explain results. The exclusive detection of PE18/19 by western blot was not possible because of the lack of antibodies able to discern these proteins from their numerous homologs. Results are representative of 2 independent experiments. (E) Various fractions from M. marinum E11 WT assessed for the presence of EsxB or PE18/19, as described for (A)–(C). Error bars are the SDs of biological co-culture duplicates. See also Figure S3 for the EspC mycobacteria subcellular localization.
Figure 3
Figure 3
Detection of Intraphagocyte Ag85A/B or EsxA by Use of Reporter T Cell Hybridomas (A) DCs (H-2b) were loaded with homologous or control peptides or infected with various esx-1-proficient or esx-1-deficient mycobacteria during 24 hr. Cells were then co-cultured for 24 hr with Ag85A/B- or EsxA-specific T cell hybridomas transduced to express ZsGreen under the Pmil-2 control. T cell hybridomas were stained with Hoechst before sample acquisition on automated confocal Opera microscopy. Nuclei were segmented by using an intensity threshold of the Hoechst signal collected in the blue channel, and the total nuclei area was quantitated. The surface of the ZsGreen+ nuclei area was determined by thresholding the signal intensity on the green channel in the nuclei area. T cell activation was defined and quantitated as an overlap of the ZsGreen+ area within the cell nuclei area. (B) Confocal images (20× magnification) of co-cultured Ag85A/B- or EsxA-specific T cells. (C) Percentages of ZsGreen+ T cells were calculated as a general activation index indicative of the total amount of antigen presented to T cells. See also Table S2. Data were pooled from 2 independent experiments, and final results were expressed as the average of 9 images/well in six independent wells. Error bars represent the SDs of biological co-culture replicates. See also Figure S4 and Tables S2 and S3.
Figure 4
Figure 4
Cytometric Detection of T7S Substrates inside the Phagocytes (A) Signals produced by T cell hybridomas harboring fluorescent reporters under control of the Pmil-2 promoter. T cells were analyzed after incubation with DCs loaded with homologous or control peptides (top) or infected with Mtb H37Rv WT or mutants (bottom). T cell hybridomas were gated on CD3+ CD4+ cells and gated out for CD11c+ DCs. Numbers on the top right of each contour plot correspond to the percentage of reporter+ T cell hybridomas over the total number of CD3+ CD4+ T cells recovered from the co-culture experiments, with a color code specified at the bottom right of the contour plots. In the bottom right quadrant of plots, the peptides (top) or the mycobacterial strains (bottom) used to pre-condition DCs are indicated. (B) MASSTT deployed to simultaneously detect responses to the EsxA, EsxB, and EspC by the pooled 3 specific hybridomas, co-cultured with C57BL/6 × CBA F1 (H-2b/k) DCs pre-loaded with a mixture of the homologous or negative control peptides or infected with WT or Δesx-1 Mtb, as detected by cytometry and as analyzed using the dimensionality reduction algorithm viSNE on the cells gated on CD3+ CD4+ T cell populations. See also Figures S4–S6 and Table S3.
Figure 5
Figure 5
Profiles of EsxA, EsxB, and EspC or Ag85A/B Intraphagocytic Release in a Panel of Mycobacterial Strains (A, C, and E) PCA projection plots of EsxA, EsxB, and EspC intraphagocyte secretion profiles across a panel of WT, mutant, and complemented Mtb (A), BCG (C), and M. microti (E) variants. Secretion profiles for each bacterial strain were evaluated as (% reporter+ T cells × MFI reporter+ T cells)/1,000. (B, D, and F) Correlation of EsxB versus EsxA and EspC versus EsxB intraphagocyte secretion profiles across a panel of WT, mutant, and complemented Mtb (B), BCG (D), and M. microti (F) variants. (G) MASSTT ESX-1 or Tat signals for H37Rv/Ra variants, harboring or not harboring a functional PhoP. Error bars are the SDs of co-culture duplicates. See also Table S4.
Figure 6
Figure 6
Intraphagocyte Secretion of ESX-3 or ESX-5 Substrates (A) Intraphagocyte secretion profiles of PE18/19 versus EsxA for various Mtb esx-5 mutants harboring individual deletion of esx-5 genes or Δppe25-pe19 (open symbols) or complemented mutants (plain symbols), as determined using transduced PE18/19- and EsxA-specific T cells. (B) PCA projection plot of EsxA, PE18/19, EsxH, and Ag85A/B intraphagocyte secretion profiles among Mtb H37Rv strains and several clinical isolates detailed in Table S5. Secretion profiles for each bacterial strain were evaluated as (% reporter+ T cells × MFI reporter+ T cells)/1,000. (C) Intraphagocyte secretion profiles of PE18/19 versus EsxA or EsxH versus Ag85A/B by several Mtb clinical isolates compared to Mtb H37Rv WT. (D) Cytometric overlaid contour blots of EsxH- versus Ag85A/B-specific signals for Mtb groups with low or high intraphagocyte Ag85A/B secretion. (E) Hierarchical clustering of the Euclidean distances on the intraphagocyte Ag85A/B secretion signal retrieved upon infection with Mtb H37Rv or clinical isolates. See also Tables S4 and S5.
Figure 7
Figure 7
Comparative Capacity of Antigen Presentation by Phagocytes from the Lung Granuloma or MLN of Mtb-Infected Mice C57BL/6 mice (n = 2/group) were left untreated or infected with Mtb::dsRed. (A) At 4 weeks post-infection, total cells from MLN or low-density cells isolated from the lung granuloma were analyzed for the intracellular Mtb::dsRed content. MLN or low-density cells from the lung parenchyma from non-infected (NI) mice were used as negative controls. Percentages of dsRed+ CD11bhi cells are indicated in each dot plot. (B) CD11b+ cells were sorted from MLN, lung granuloma, or lung parenchyma and co-cultured with transduced EsxA- or EspC-specific T cells during the 24 hr before surface staining and cytometric analyses. (C) Percentages or MFI of the reporter+ T cells from a representative experiment. Error bars are the SDs of technical replicates.

References

    1. Abramovitch R.B., Rohde K.H., Hsu F.F., Russell D.G. aprABC: a Mycobacterium tuberculosis complex-specific locus that modulates pH-driven adaptation to the macrophage phagosome. Mol. Microbiol. 2011;80:678–694. - PMC - PubMed
    1. Aguilo N., Gonzalo-Asensio J., Alvarez-Arguedas S., Marinova D., Gomez A.B., Uranga S., Spallek R., Singh M., Audran R., Spertini F., Martin C. Reactogenicity to major tuberculosis antigens absent in BCG is linked to improved protection against Mycobacterium tuberculosis. Nat. Commun. 2017;8:16085. - PMC - PubMed
    1. Allix-Béguec C., Harmsen D., Weniger T., Supply P., Niemann S. Evaluation and strategy for use of MIRU-VNTRplus, a multifunctional database for online analysis of genotyping data and phylogenetic identification of Mycobacterium tuberculosis complex isolates. J. Clin. Microbiol. 2008;46:2692–2699. - PMC - PubMed
    1. Altschul S.F., Madden T.L., Schäffer A.A., Zhang J., Zhang Z., Miller W., Lipman D.J. Gapped BLAST and PSI-BLAST: a new generation of protein database search programs. Nucleic Acids Res. 1997;25:3389–3402. - PMC - PubMed
    1. Amir el-A.D., Davis K.L., Tadmor M.D., Simonds E.F., Levine J.H., Bendall S.C., Shenfeld D.K., Krishnaswamy S., Nolan G.P., Pe’er D. viSNE enables visualization of high dimensional single-cell data and reveals phenotypic heterogeneity of leukemia. Nat Biotechnol. 2013;31:545–552. - PMC - PubMed

Publication types

MeSH terms

Substances