. 2018 Apr 24;23(4):1205-1219.
doi: 10.1016/j.celrep.2018.03.114.

High-Dimensional Phenotyping Identifies Age-Emergent Cells in Human Mammary Epithelia

Affiliations

High-Dimensional Phenotyping Identifies Age-Emergent Cells in Human Mammary Epithelia

Fanny A Pelissier Vatter et al. Cell Rep. .

Abstract

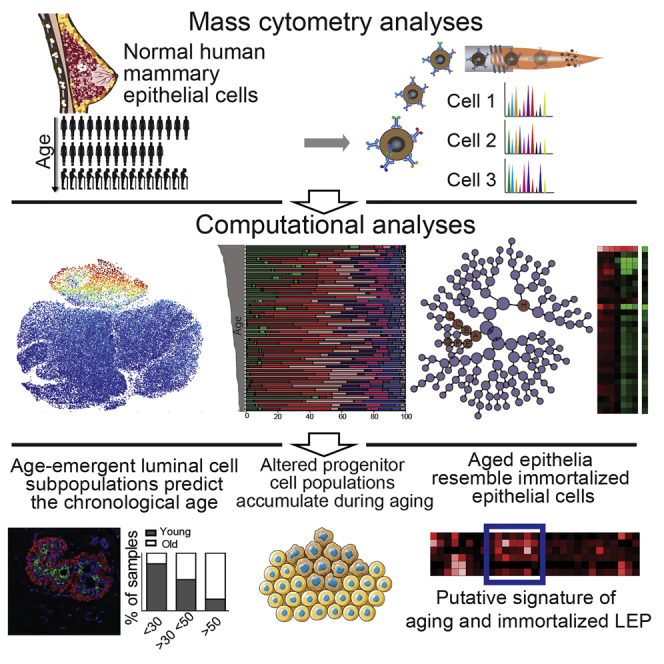
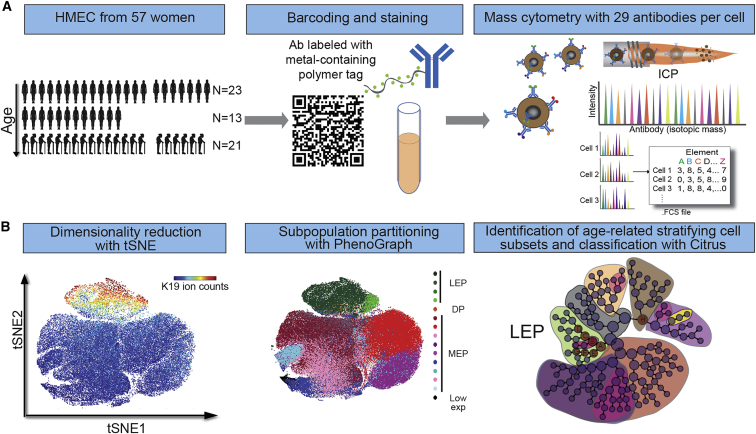
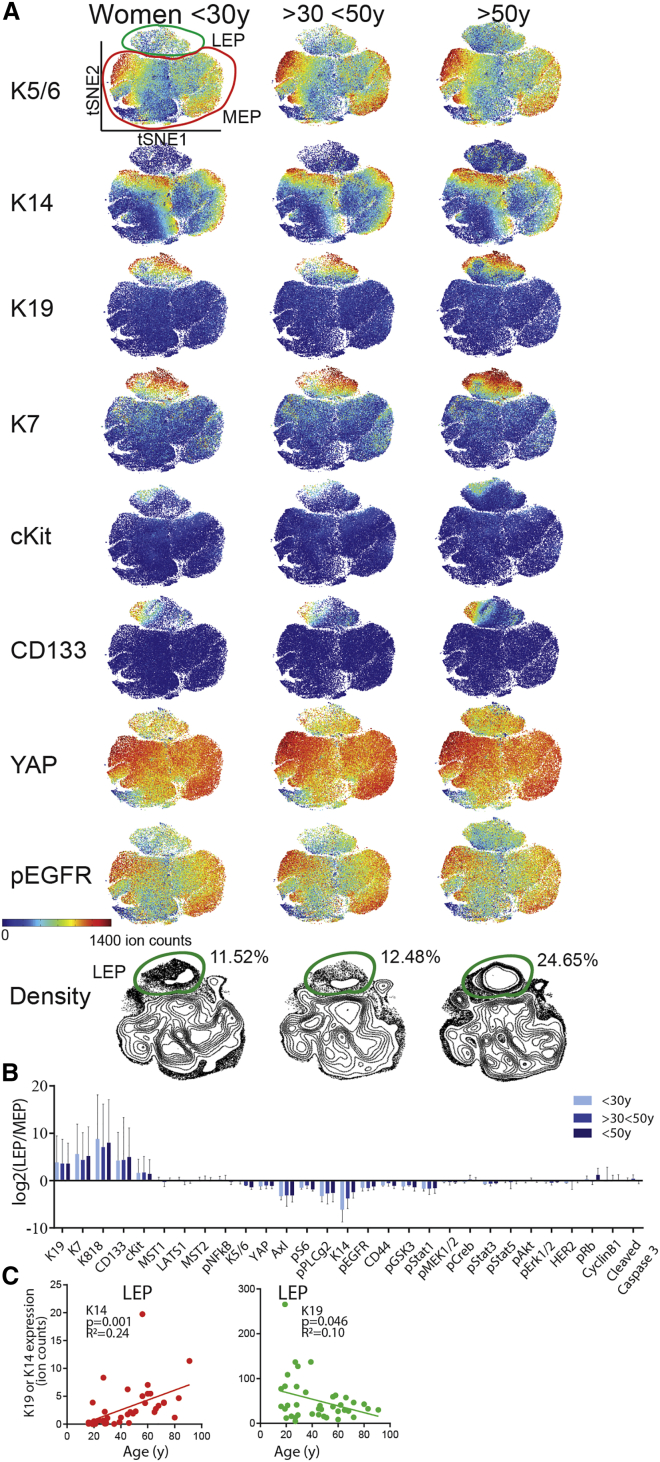
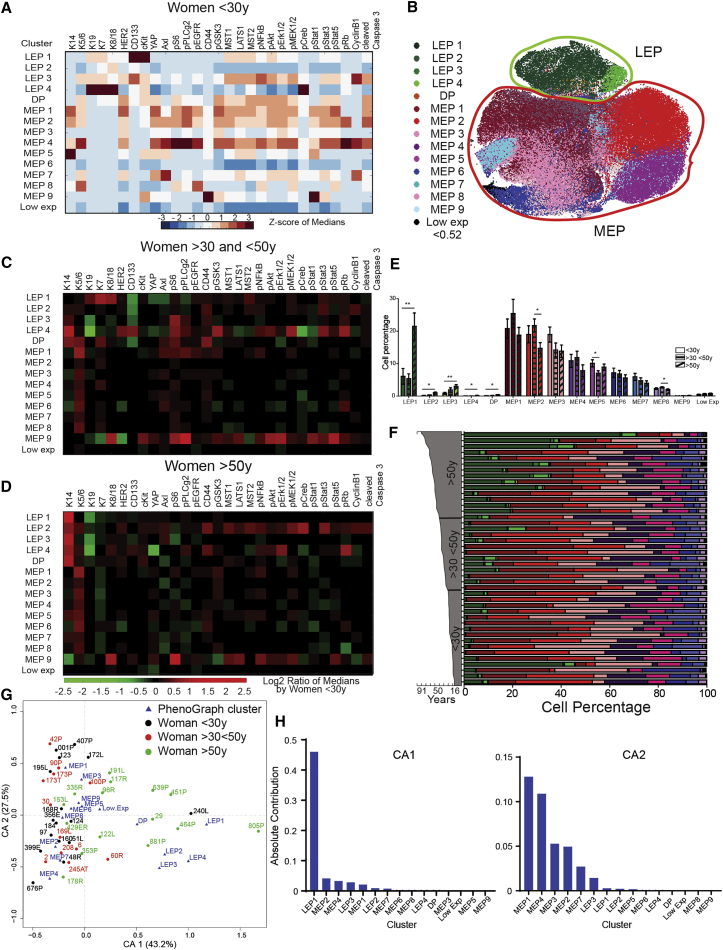
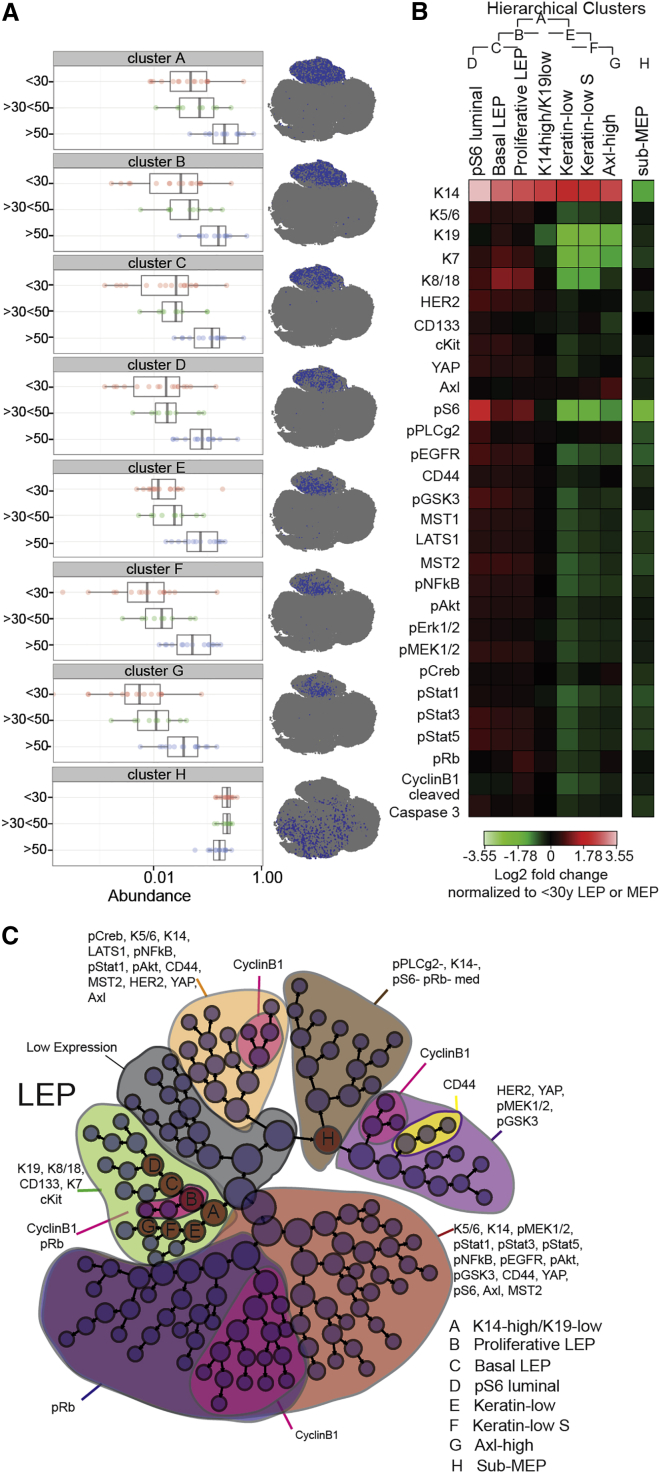
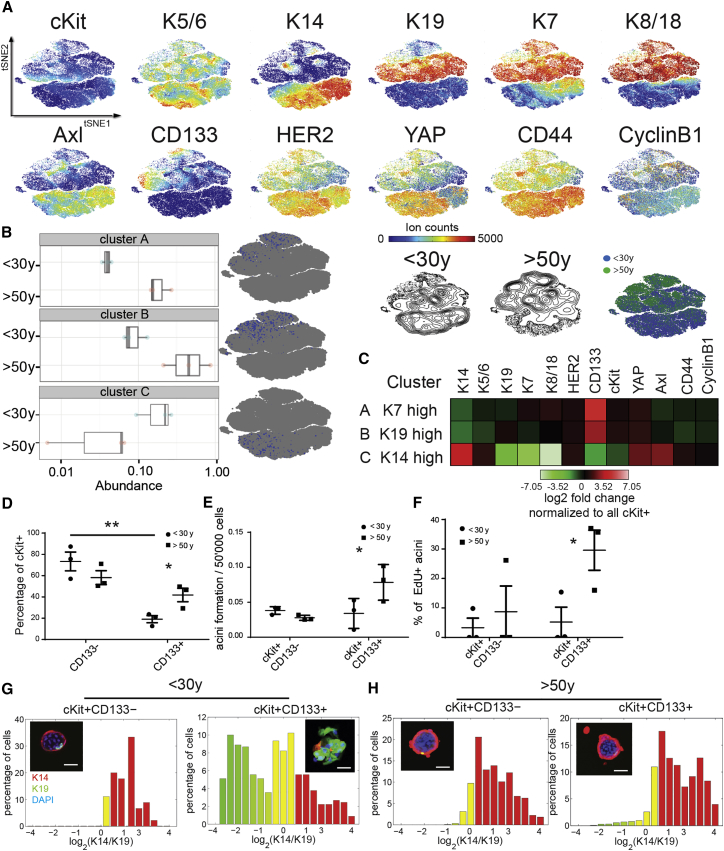
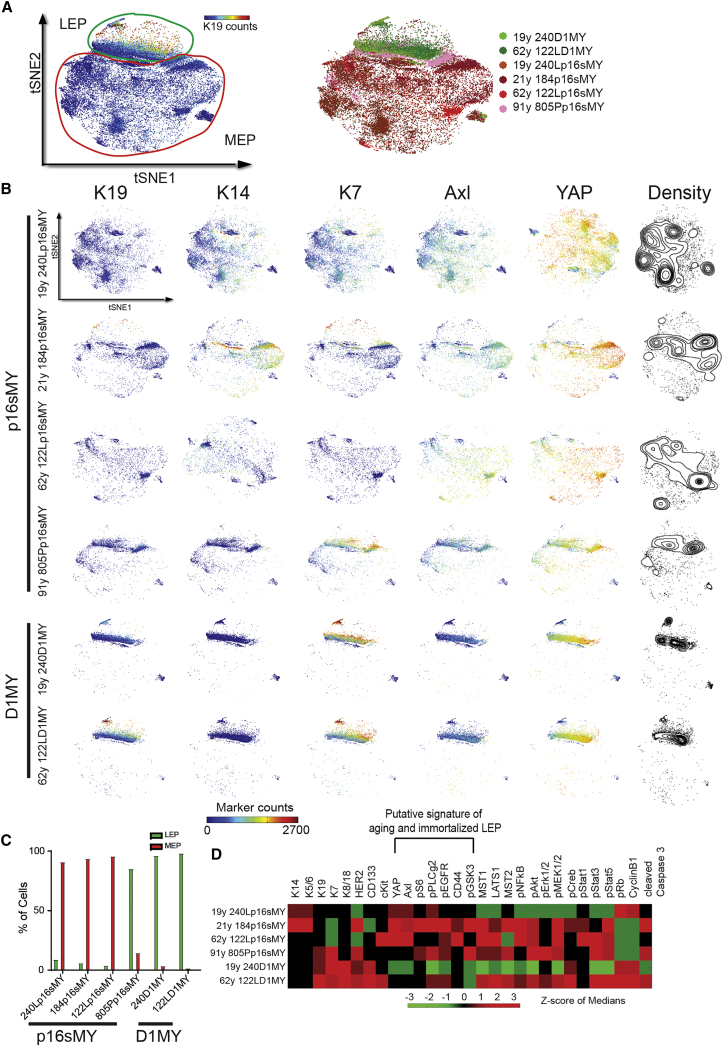
Aging is associated with tissue-level changes in cellular composition that are correlated with increased susceptibility to disease. Aging human mammary tissue shows skewed progenitor cell potency, resulting in diminished tumor-suppressive cell types and the accumulation of defective epithelial progenitors. Quantitative characterization of these age-emergent human cell subpopulations is lacking, impeding our understanding of the relationship between age and cancer susceptibility. We conducted single-cell resolution proteomic phenotyping of healthy breast epithelia from 57 women, aged 16-91 years, using mass cytometry. Remarkable heterogeneity was quantified within the two mammary epithelial lineages. Population partitioning identified a subset of aberrant basal-like luminal cells that accumulate with age and originate from age-altered progenitors. Quantification of age-emergent phenotypes enabled robust classification of breast tissues by age in healthy women. This high-resolution mapping highlighted specific epithelial subpopulations that change with age in a manner consistent with increased susceptibility to breast cancer.

Keywords: aging; breast cancer; heterogeneity; human mammary epithelia; mass cytometry; single-cell analysis.


Figures

None
Graphical abstract
Figure 1
Figure 1
Mass Cytometry Analysis of Human Mammary Epithelial Cells (A) Summary of experimental design. 57 samples of HMECs from women aged 16 to 91 years old (comprising 13 uncultured breast epithelia samples and 44 primary cultured HMEC strains at passage 4 [p4]) were barcoded and stained using a panel of 29 antibodies labeled with isotope tags and analyzed using mass cytometry. (B) Strategy to analyze high-dimensional single-cell data and identify lineage and age-related phenotypic divergence. See also Tables S1 and S2 and Figure S1.
Figure 2
Figure 2
Collective tSNE Analysis Distinguishes Major Luminal and Myoepithelial Lineages (A) The raw data have been transformed with arcsinh with the cofactor of 5. tSNE maps from HMECs at p4 from women <30 years old (merged and subsampled at 50,000 cells, n = 16), >30 < 50 years old (n = 13), and >50 years old (n = 15). (B) Log2 fold change of marker expression of LEP over MEP manually gated from tSNE projection map in HMECs from women <30 years old, >30 < 50 years old, and >50 years old. Data are log2 of ratio of median ± SD. (C) K19 and K14 expression in LEP as a function of age. 250MK, 90P, 245AT, 173T, and an outlier 42P were excluded from the analysis. See also Figures S1–S3.
Figure 3
Figure 3
Age-Related Phenotypic Divergence in the Landscape of HMECs (A) Heatmaps of marker expression in PhenoGraph clusters of HMECs from women <30 years old (Z score scale, merged, n = 16) (excluding 250MK, 90P and 245AT, 173T). (B) tSNE projection of the PhenoGraph clusters identified with PhenoGraph identified in (A), colored by cluster. (C and D) Heatmaps of marker expression in each PhenoGraph cluster in HMECs from (C) women >30 and <50 years old and (D) women >50 years old, normalized to values from <30-year-old women. (E) Plots of cell percentage in each PhenoGraph cluster (excluding 250MK, 90P and 245AT, 173T). Data are mean ± SEM. (F) Intra-sample heterogeneity for each woman is represented graphically by a horizontal bar in which segment lengths represent the proportion of the sample assigned to each cluster, colored accordingly (excluding 250MK). (G) The first two components of correspondence analysis (CA), accounting for 70% of the co-association structure between PhenoGraph subpopulations and different strains. Proximity among women and among clusters indicates similarity, however, only a small angle connecting a woman and a cluster to the origin indicates an association. The angle between women <50 years old and LEP was statistically smaller than the angle between women <30 years old and women >30 and <50 years old and LEP (t test, p < 0.001). PhenoGraph subsets are displayed as triangles and HMEC samples as circles. (H) Contributions of the PhenoGraph subpopulations to CA-1 and CA-2. See also Figure S4.
Figure 4
Figure 4
Evidence of Age-Dependent Phenotypic Divergence in the Luminal Population The Citrus algorithm was applied to identify cell populations by hierarchical clustering of phenotypically similar cells from an aggregate dataset from all samples (excluding 250MK, 90P and 245AT, 173T). A defining characteristic of each cluster is denoted as follows: cluster A, K14high/K19low; cluster B, proliferative LEP; cluster C, basal LEP; cluster D, pS6 luminal; cluster E, Keratinlow; cluster F, Keratin-low S; cluster G, Axlhigh; and cluster H, sub-MEP. (A) Boxplots of cell abundance in each age-related cluster and its representative tSNE phenotypic projection. Each data point on these graphs represents the proportion of the cluster cell number compared to the total cell number in a single sample. The log10 scale represents an abundance of cells from 0 to 1. (B) Heatmaps of marker expression of each cluster normalized to LEP from <30-year-old women for clusters A to G and MEP from <30-year-old women for cluster H. (C) Hierarchical tree of agglomerative clusters obtained with the Citrus analysis. Node sizes are scaled on the basis of frequency of cells in each cluster. See also Figure S4.
Figure 5
Figure 5
Age-Related Phenotypic Divergence in Uncultured Breast Epithelia (A) tSNE maps from dissociated uncultured breast epithelia from women <30 years old (merged and subsampled at 50,000 cells, n = 7) and >50 years old (merged and subsampled at 50,000 cells, n = 6). The pGsk3 channel was removed from the analysis due to a technical issue. (B) tSNE projection of the PhenoGraph clusters. The tSNE projection (right panel) of women <30 years old (blue) and women >50 years old (green) is shown. (C) Heatmaps of Z score of marker expression in PhenoGraph clusters of uncultured breast epithelia from women <30 years old (merged, n = 7). (D) Plots of cell percentage in each PhenoGraph cluster. Data are mean ± SEM. (E) Intra-sample heterogeneity for each woman is represented graphically by a horizontal bar in which segment lengths represent the proportion of the sample assigned to each cluster, colored accordingly. (F) Boxplots of cell abundance in each age-related Citrus cluster and its representative tSNE phenotypic projection. (G) Heatmaps of marker expression of each cluster normalized to LEP from <30-year-old women for clusters A to C and MEP from <30-year-old women for clusters D to G. (H) The geometric distance was calculated using the square root of the sum of the squared differences between the median of each marker for each subpopulation. (I) Representative human breast sections immunostained for K14 (red), K19 (green), and DAPI (blue) from a 17-year-old, 36-year-old, and 58-year-old woman (left to right, respectively). Scale bar represents 100 μm. (J) Plots show classification performance of 171 breast sections from 50 women (<30 years n = 52, >30 < 50 years n = 86, and >50 years n = 33), analyzed using morphometric context with increasing training set size. (K) Plot shows Citrus classification performance using a training set of 10 women (<30 years n = 5, >50 years n = 5). The black and white circles indicate whether an incorrectly assigned sample was from a peripheral non-tumor mastectomy (P), milk (MK), a tumor (T), or a tissue with no history, respectively. Data are mean ± SEM. See also Figures S5 and S6.
Figure 6
Figure 6
Evidence of Age-Dependent Phenotypic Divergence in HMEC Progenitors (A) tSNE maps from FACS-enriched HMEC cKit+ progenitors from 3 women <30 years old and 3 women >50 years old (merged and subsampled at 50,000 cells). The lower right tSNE map shows the spatial projection of women <30 years old (blue) and women >50 years old (green). (B) Boxplots of cell abundance of age-dependent clusters identified with Citrus and their representative tSNE spatial projection. (C) Heatmaps of marker expression of each cluster compared to the background. (D) Proportions of cKit+CD133− and cKit+CD133+ as a function of age (n = 3; t test, young cKit+CD133− versus cKit+CD133+ p = 0.0046, and young cKit+CD133+ versus old cKit+CD133+ p = 0.037). (E) Acini formation potential of cKit+CD133− and cKit+CD133+ in Matrigel/collagen I gels as a function of age (n = 3; t test, p = 0.0123). (F) Proportions of acini that were incorporating EdU as a function of age. Data are means ± SEM. An acinus was quantified as EdU positive if at least one cell was incorporating EdU (n = 3; t test, p = 0.0452). Data are means ± SEM. (G and H) Histograms represent log2-transformed ratios of K14 to K19 protein expression in single cells of acini (G) from a representative woman <30 years old (240L, 19 years) and (H) from a representative woman >50 years old (029, 68 years). Histograms are heat mapped to indicate the phenotypes of K14−/K19+ LEP (green), K14+/K19+ progenitors (yellow), and K14+/K19− MEP (red). Insets show representative HMEC organoids immunostained for K14 (red), K19 (green), and DAPI (blue). Scale bar represents 50 μm. See also Figure S7.
Figure 7
Figure 7
Aged Epithelia Resemble Immortalized Epithelial Cells (A) tSNE map of immortalized HMECs (left, merged, 6,000 cells per sample, n = 6). Right: each color represents a strain. (B) Five selected markers are shown (K19, K4, K7, Axl, and YAP), with knockdown of CDKN2A: p16sMY and overexpression of CCND1: D1MY. (C) Plots show percentage of LEP and MEP in each strain according to the gating strategy. (D) Heatmap of Z score of median of marker expression of each strain. See also Figure S7.

References

    1. Altschuler S.J., Wu L.F. Cellular heterogeneity: do differences make a difference? Cell. 2010;141:559–563. - PMC - PubMed
    1. Amir E.D., Davis K.L., Tadmor M.D., Simonds E.F., Levine J.H., Bendall S.C., Shenfeld D.K., Krishnaswamy S., Nolan G.P., Pe’er D. viSNE enables visualization of high dimensional single-cell data and reveals phenotypic heterogeneity of leukemia. Nat. Biotechnol. 2013;31:545–552. - PMC - PubMed
    1. Bandura D.R., Baranov V.I., Ornatsky O.I., Antonov A., Kinach R., Lou X., Pavlov S., Vorobiev S., Dick J.E., Tanner S.D. Mass cytometry: technique for real time single cell multitarget immunoassay based on inductively coupled plasma time-of-flight mass spectrometry. Anal. Chem. 2009;81:6813–6822. - PubMed
    1. Bergstraesser L.M., Srinivasan G., Jones J.C., Stahl S., Weitzman S.A. Expression of hemidesmosomes and component proteins is lost by invasive breast cancer cells. Am. J. Pathol. 1995;147:1823–1839. - PMC - PubMed
    1. Biteau B., Hochmuth C.E., Jasper H. JNK activity in somatic stem cells causes loss of tissue homeostasis in the aging Drosophila gut. Cell Stem Cell. 2008;3:442–455. - PMC - PubMed

Publication types