. 2018 Apr 24;23(4):951-958.
doi: 10.1016/j.celrep.2018.03.111.

Rapid Neuromodulation of Layer 1 Interneurons in Human Neocortex

Affiliations

Rapid Neuromodulation of Layer 1 Interneurons in Human Neocortex

Rogier B Poorthuis et al. Cell Rep. .

Abstract

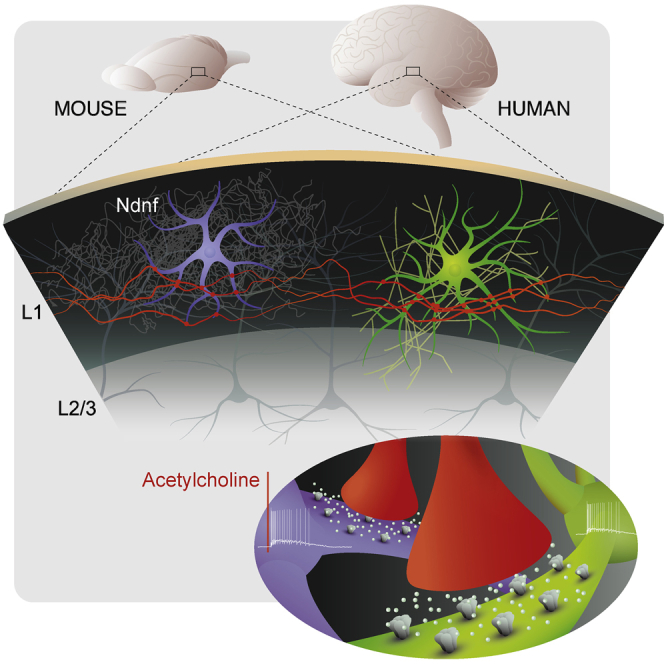
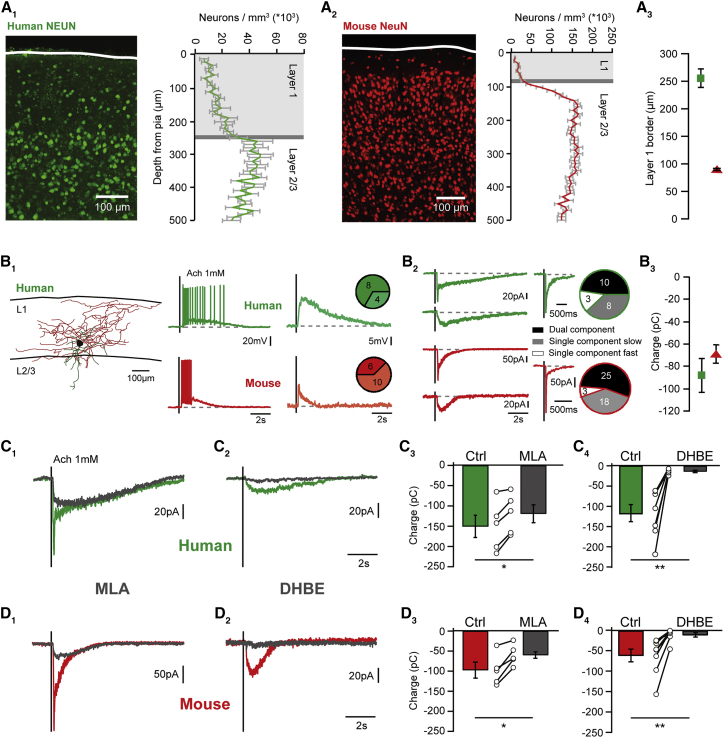
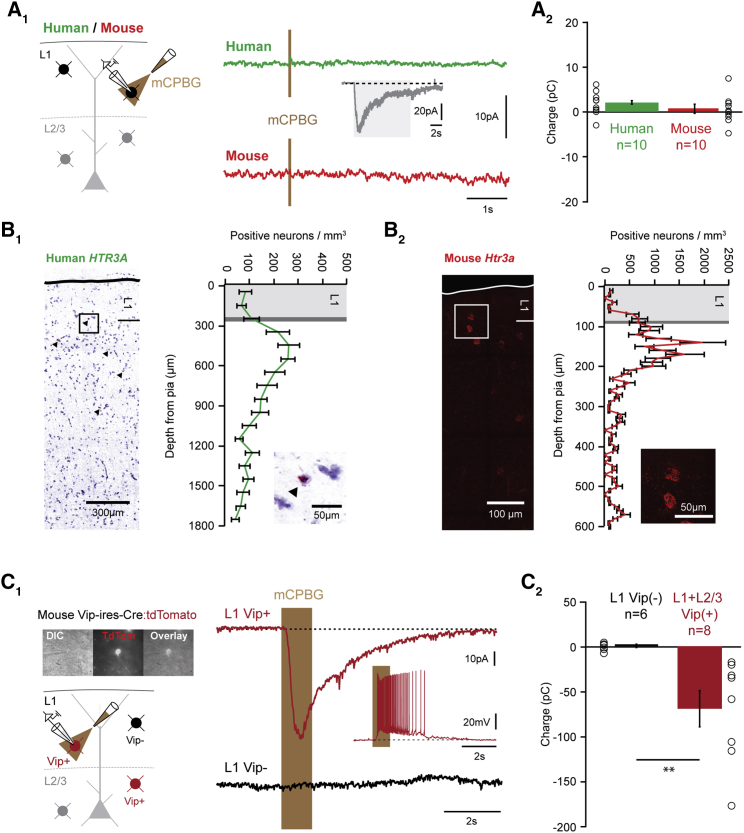
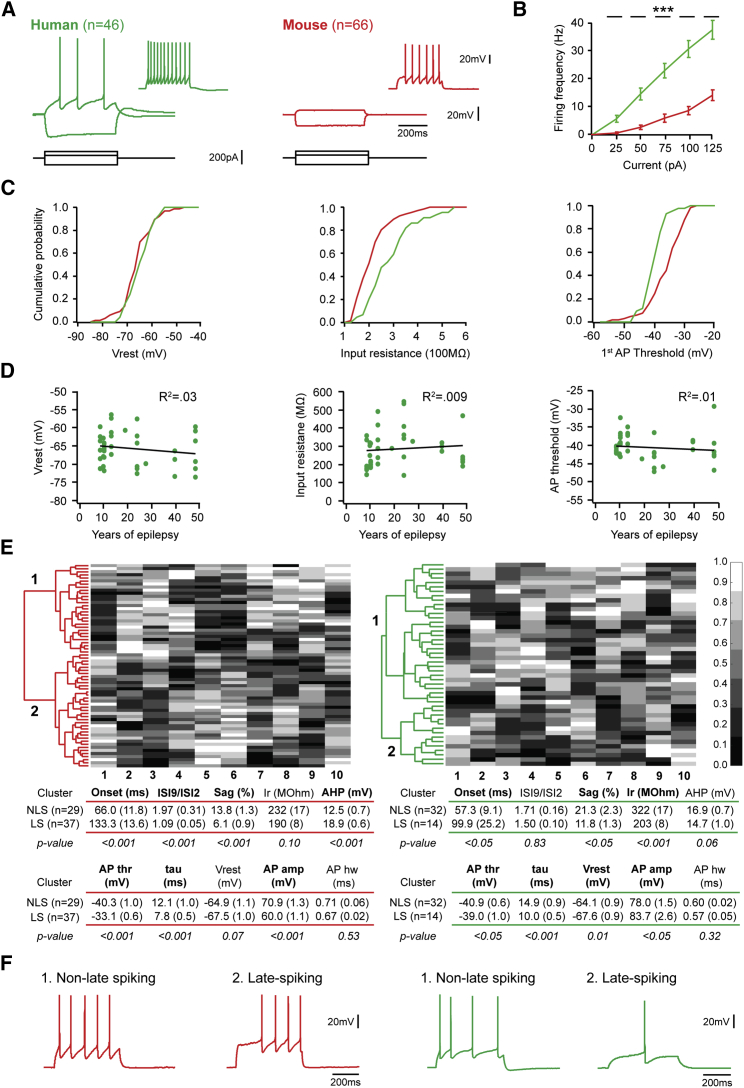
Inhibitory interneurons govern virtually all computations in neocortical circuits and are in turn controlled by neuromodulation. While a detailed understanding of the distinct marker expression, physiology, and neuromodulator responses of different interneuron types exists for rodents and recent studies have highlighted the role of specific interneurons in converting rapid neuromodulatory signals into altered sensory processing during locomotion, attention, and associative learning, it remains little understood whether similar mechanisms exist in human neocortex. Here, we use whole-cell recordings combined with agonist application, transgenic mouse lines, in situ hybridization, and unbiased clustering to directly determine these features in human layer 1 interneurons (L1-INs). Our results indicate pronounced nicotinic recruitment of all L1-INs, whereas only a small subset co-expresses the ionotropic HTR3 receptor. In addition to human specializations, we observe two comparable physiologically and genetically distinct L1-IN types in both species, together indicating conserved rapid neuromodulation of human neocortical circuits through layer 1.

Keywords: cell types; evolution; genetic markers; human neocortex; interneuron types; layer 1 interneurons; mouse neocortex; neocortical circuits; neuromodulation; translation; whole-cell recordings.


Figures

None
Graphical abstract
Figure 1
Figure 1
Nicotinic Responses in Human Layer 1 Interneurons (A) Neuron density relative to the pia was used to define layer 1 in human (green, 7 slices, 3 patients) and mouse neocortex (red, 29 slices, 3 mice) (A1, A2). Layer 1 thickness was 254.2 ± 16.3 μm for human and 90.7 ± 2.0 μm for mouse (A3). (B) All human and mouse L1-INs showed rapid voltage responses to local pressure application of acetylcholine, and displayed supra- or subthreshold responses in similar proportions (p = 0.25, Fisher’s exact test) (B1). Nicotinic currents showed biphasic time courses in approximately half of the human and mouse cells (top left), with a rapid, large amplitude initial current and a slower second component (B2). A second major L1-IN fraction displayed exclusively slow currents (bottom left), while the remaining minority showed only the rapid component (center). The proportion of these response types was similar in human and mouse (right, p = 0.58, Fisher exact test). (B3) The charge of nicotinic responses was similar in the two species (p = 0.39, Kruskal-Wallis test, n = 21 versus n = 46, −88.2 ± 15.5 versus −69.3 ± 8.2 pC). (C and D) Bath application of the selective α7 receptor antagonist MLA (10 nM) abolished the fast current in human (C1) and mouse (D1) L1-INs with biphasic currents. C3, D3 MLA reduced the response charge in humans (p < 0.05, n = 5, Wilcoxon signed-rank test, −150.4 ± 27.3 versus −119.2 ± 22.0 pC) and mice (p < 0.05, n = 5, Wilcoxon signed-rank test, −97.6 ± 20.0 versus −60.0 ± 7.9 pC), although its effect on peak amplitude was more pronounced (Figure S1). The β2-containing receptor antagonist DHBE (1 μM) selectively blocked the slow current (C2, D2), which carried most of the charge in humans (C4, p < 0.01, n = 7, Wilcoxon signed-rank test, −118.2 ± 22.7 versus −12.1 ± 2.4 pC, tested on 3 biphasic and 4 monophasic slow currents, see Figure S1) and mice (D4, p < 0.01, n = 8, Wilcoxon signed-rank test, −66.5 ± 12.0 versus −8.25 ± 4.1 pC, tested on 1 biphasic and 7 monophasic slow currents). Error bars indicate SEM. See also Figure S1.
Figure 2
Figure 2
Conserved Absence of HTR3 Responses in Human Layer 1 Interneurons (A) Pressure application of the selective Htr3 receptor agonist mCPBG (100-ms application displayed, 1 s and 10 s also tested) caused no response in L1-INs of either species, in contrast to robust responses when acetylcholine was applied to the same cells (inset, 10-s application) (A1). On average, the Htr3 receptor mediated charge was 1.81 ± 0.82 pC in human (n = 10), and 0.53 ± 1.01 pC in mouse (n = 10), and similar data were obtained with application of serotonin (A2) (Figure S2). (B) In situ hybridization for HTR3A in human (B1) and mouse neocortex (B2). Note that while the density peaks in layer 2/3, a small population of positive neurons is also present in layer 1. The image in B1 is a montage of images assembled using Pannoramic Scan software. (C) Vip positive interneurons in layer 1 and layer 2/3 were targeted using a cross of transgenic mouse lines. Example responses of a Vip positive and negative L1-IN to mCPBG application. While Vip negative L1-INs showed no response, Vip positive L1-INs and L2-3-INs displayed large inward currents that led to robust firing (inset). Similar data were obtained with application of serotonin (Figure S2) (C1). The average charge of mCPBG responses in Vip negative L1-INs was 0.13 ± 1.86 pC (n = 6), whereas Vip positive interneurons in layer 1 and layer 2/3 displayed responses of −69.88 ± 0.30 pC (n = 8, p < 0.01, Kruskal-Wallis test). Error bars indicate SEM (C2 ). See also Figures S2 and S3.
Figure 3
Figure 3
Intrinsic Properties and Subtypes of Human Layer 1 Interneurons (A) Responses of example human (green) and mouse (red) L1-IN to current injections of −100, +25, and +75 pA (inset). (B) Human neurons fired at higher frequencies across the entire range of injected currents (p < 0.001 for all current amplitudes, Kruskal-Wallis test, n = 46 human neurons and n = 66 mouse neurons). (C) While the resting membrane potential of human and mouse L1-INs was similar (Vrest, −65.2 ± 0.7 versus −66.4 ± 0.8 mV, Kruskal-Wallis test, p = 0.28), human neurons displayed higher input resistance (286.0 ± 14.9 versus 208.4 ± 8.9 MΩ, Kruskal-Wallis test, p < 0.001) and lower action potential threshold compared to mice (−40.4 ± 0.5 versus −36.4 ± 0.7 mV, Kruskal-Wallis test, p < 0.001), with both factors likely contributing to the greater excitability of human L1-INs. (D) These parameters showed no correlation with the disease history of the patients (p > 0.2, see also Figure S4). (E) (left) Unsupervised hierarchical clustering on a set of active and passive physiological properties (Ward’s method on normalized datasets without prior assumption on cluster number) yielded a non-late-spiking and a late-spiking cluster in the mouse, which also differ in most other parameters (table presents mean, SEM and results of Kruskal-Wallis test). In addition to differences in spiking accommodation, voltage sag, and action potential afterhyperpolarization (Chu et al., 2003, Tasic et al., 2016, Jiang et al., 2013, Jiang et al., 2015), the late-spiking L1-INs display more depolarized action potential threshold, faster membrane time constant and lower action potential amplitude. (Right) The same unbiased analysis on human L1-INs yielded similar clusters, with a population of late-spiking cells that display smaller voltage sag, more depolarized action potential threshold, and faster membrane time constant. In addition, input resistance and resting membrane potential displayed similar trends in both species, whereas spiking accommodation, action potential afterhyperpolarization, and amplitude varied in a distinct manner between the two clusters in mouse and human. Calibration bar indicates value rank between 0 and 1. (F) Example firing patterns. Error bars indicate SEM. See also Figures S4 and S5.
Figure 4
Figure 4
Neuron-Derived Neurotrophic Factor Is a Conserved Marker for Human Layer 1 Neurogliaform Cells (A) In situ hybridization for NDNF in human neocortex (left) and quantification of the distribution of positive neurons along cortical depth (12 slices from 2 patients). The density of NDNF-positive neurons is high in layer 1 (light gray) and drops off steeply at the border to layer 2 (dark gray) (A1). In situ hybridization for Ndnf in mouse temporal neocortex (16 slices from 3 animals) shows a similar expression profile, indicating that Ndnf is a conserved marker for layer 1 interneurons (A2). The image in A1 is a montage of images assembled using Pannoramic Scan software. (B) Whole-cell current-clamp slice recording using an Ndnf-eGFP mouse line. (C) To determine whether Ndnf positive layer 1 interneurons correspond to one of the populations identified by unbiased clustering of the entire layer 1 interneuron population (Figure 3), we compared the distribution of action potential onset (C1), spiking accommodation (C2), and action potential afterhyperpolarization (C3) in the three populations. Ndnf interneurons display robust similarity with the late-spiking cluster in all three parameters. (D) Statistical comparison of the 10 attributes used for clustering between the three populations indicates that Ndnf interneurons and cells in the late-spiking cluster differ from the non-late-spiking cluster in the same properties, whereas no difference could be detected between the late-spiking and Ndnf populations. Error bars indicate SEM.

References

    1. Alitto H.J., Dan Y. Cell-type-specific modulation of neocortical activity by basal forebrain input. Front. Syst. Neurosci. 2013;6:79. - PMC - PubMed
    1. Alkondon M., Pereira E.F., Eisenberg H.M., Albuquerque E.X. Nicotinic receptor activation in human cerebral cortical interneurons: A mechanism for inhibition and disinhibition of neuronal networks. J. Neurosci. 2000;20:66–75. - PMC - PubMed
    1. Arroyo S., Bennett C., Aziz D., Brown S.P., Hestrin S. Prolonged disynaptic inhibition in the cortex mediated by slow, non-α7 nicotinic excitation of a specific subset of cortical interneurons. J. Neurosci. 2012;32:3859–3864. - PMC - PubMed
    1. Arroyo S., Bennett C., Hestrin S. Nicotinic modulation of cortical circuits. Front. Neural Circuits. 2014;8:30. - PMC - PubMed
    1. Bennett C., Arroyo S., Berns D., Hestrin S. Mechanisms generating dual-component nicotinic EPSCs in cortical interneurons. J. Neurosci. 2012;32:17287–17296. - PMC - PubMed

Publication types

Substances