. 2018 May 7;150(5):683-696.
doi: 10.1085/jgp.201812064. Epub 2018 Apr 25.

Dimerization of the voltage-sensing phosphatase controls its voltage-sensing and catalytic activity

Affiliations

Dimerization of the voltage-sensing phosphatase controls its voltage-sensing and catalytic activity

Vamseedhar Rayaprolu et al. J Gen Physiol. .

Abstract

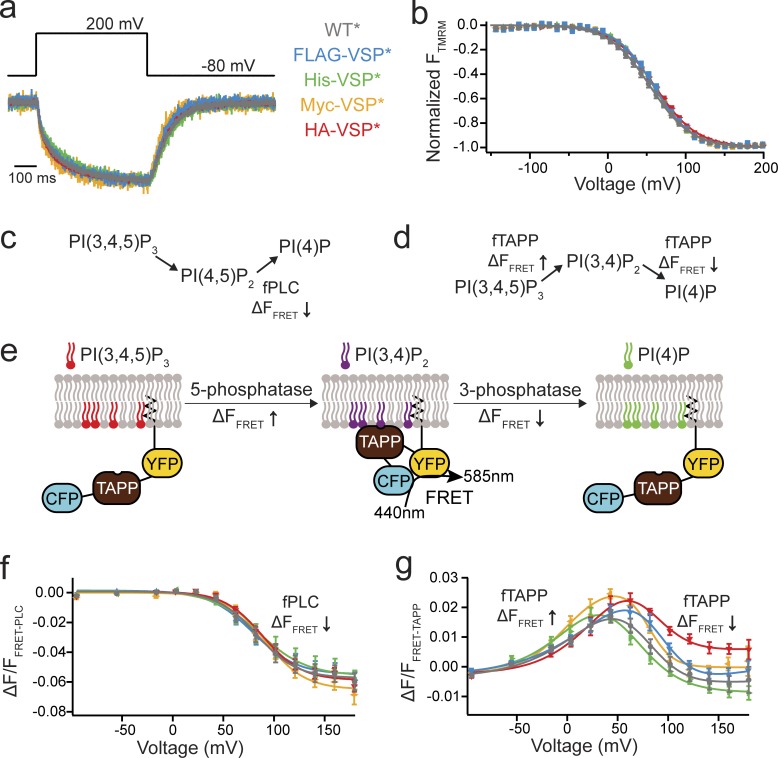
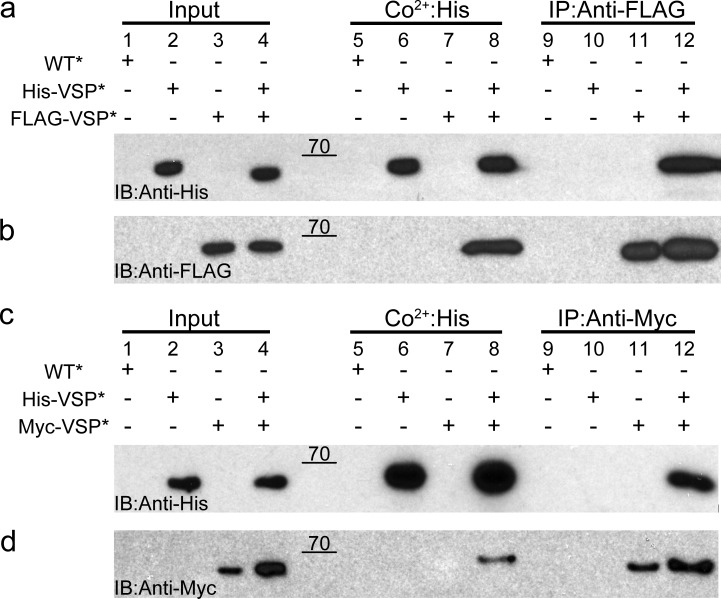
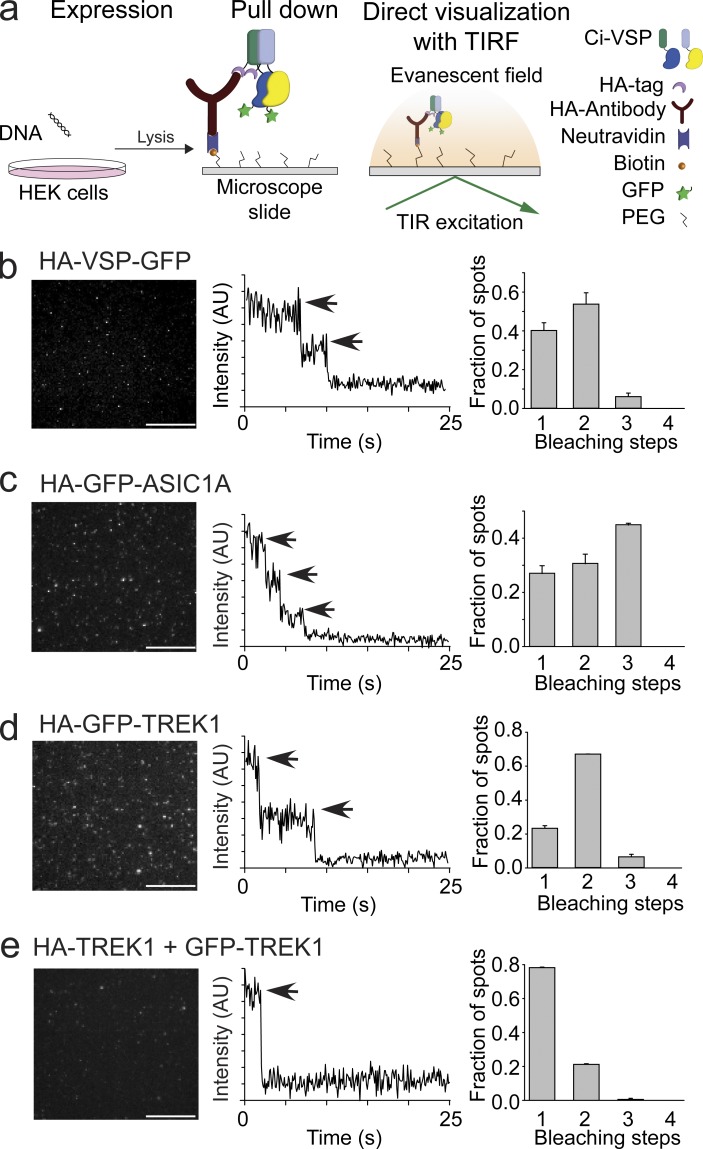
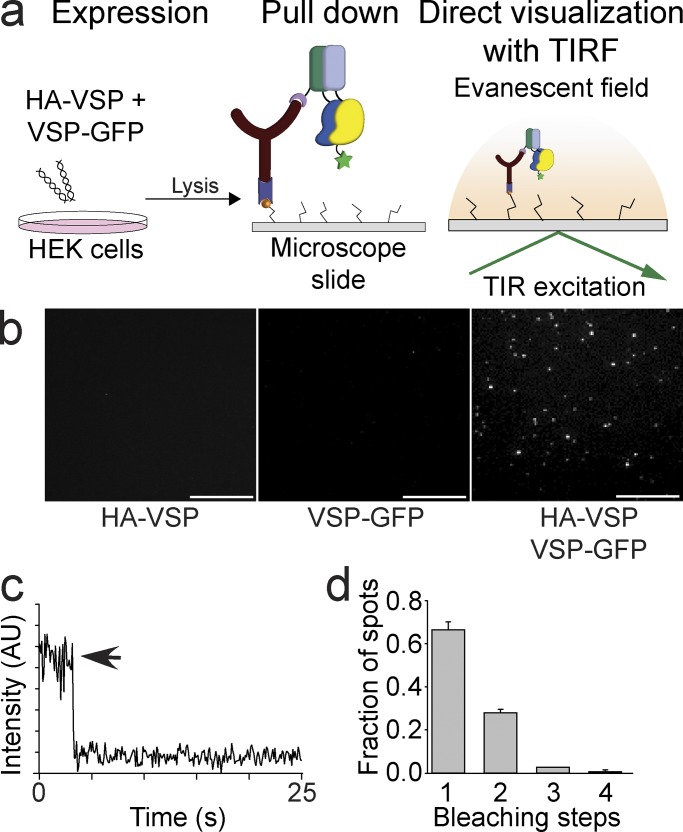
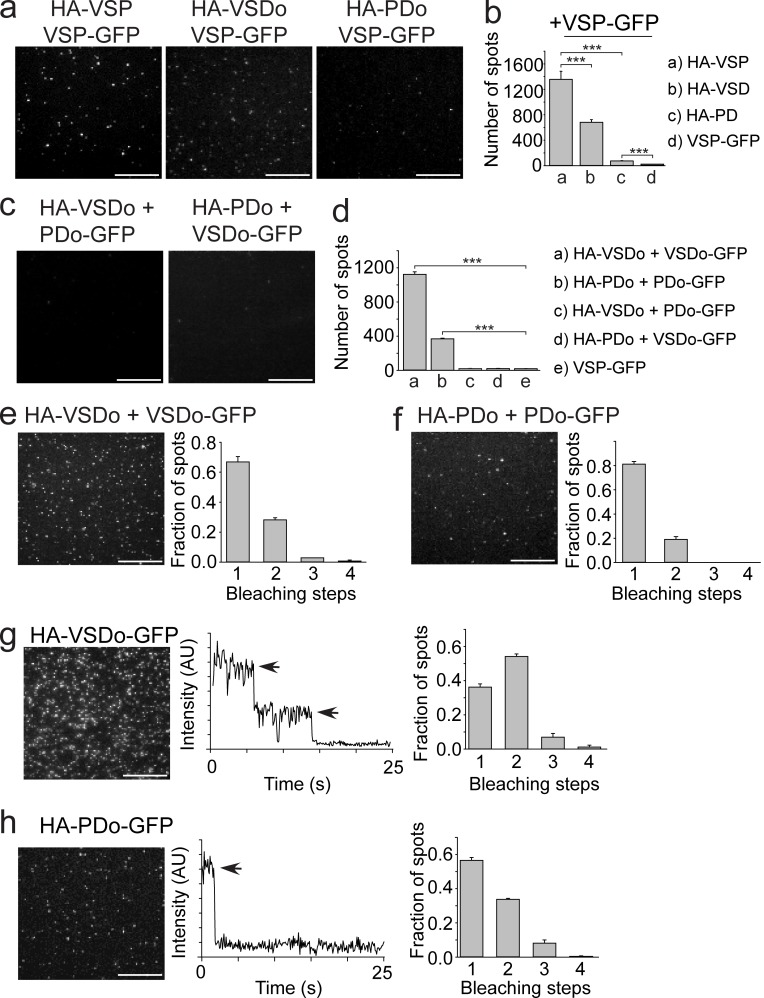
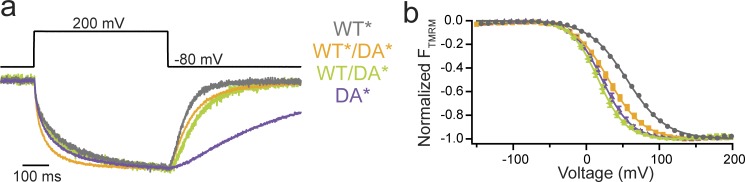
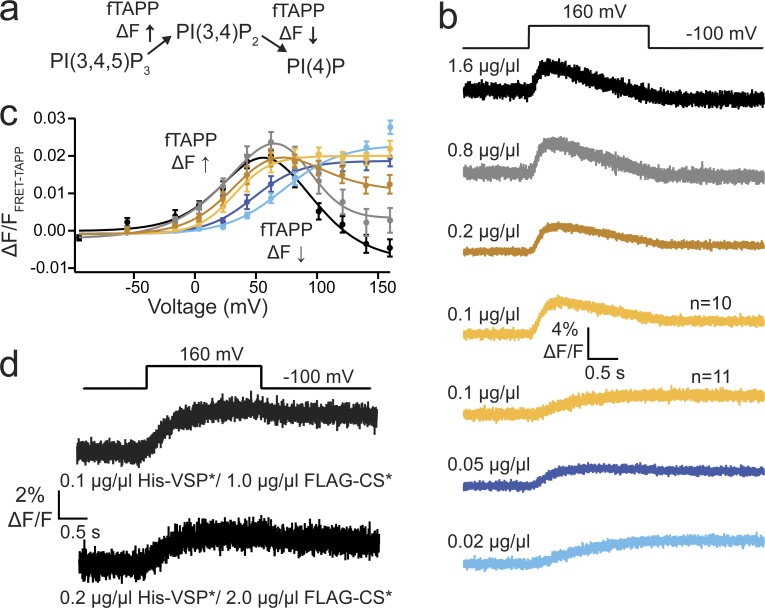
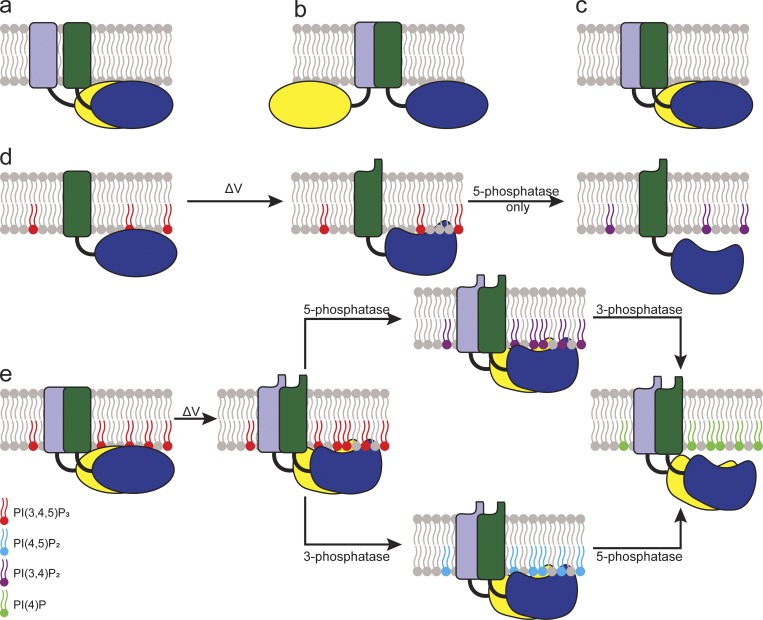
Multimerization is a key characteristic of most voltage-sensing proteins. The main exception was thought to be the Ciona intestinalis voltage-sensing phosphatase (Ci-VSP). In this study, we show that multimerization is also critical for Ci-VSP function. Using coimmunoprecipitation and single-molecule pull-down, we find that Ci-VSP stoichiometry is flexible. It exists as both monomers and dimers, with dimers favored at higher concentrations. We show strong dimerization via the voltage-sensing domain (VSD) and weak dimerization via the phosphatase domain. Using voltage-clamp fluorometry, we also find that VSDs cooperate to lower the voltage dependence of activation, thus favoring the activation of Ci-VSP. Finally, using activity assays, we find that dimerization alters Ci-VSP substrate specificity such that only dimeric Ci-VSP is able to dephosphorylate the 3-phosphate from PI(3,4,5)P3 or PI(3,4)P2 Our results indicate that dimerization plays a significant role in Ci-VSP function.


Figures

Figure 1.
Figure 1.
N-terminal tags do not alter Ci-VSP function. (a) Representative TMRM fluorescence traces during a step from a holding potential of −80 to 200 mV for WT*, FLAG-VSP*, His-VSP*, Myc-VSP*, and HA-VSP* (where the * indicates TMRM labeling). Traces are normalized to the maximal fluorescence change. The voltage trace shows the actual voltage recorded during acquisition. (b) Normalized TMRM fluorescence versus voltage relationship. Data fit to single Boltzmann equations. None of the N-terminal tags alter the kinetics or the voltage dependence of the VSD motions, indicating they are not influencing VSP function. n ≥ 11. Some errors bars are smaller than the size of the symbols. (c and d) Schematics of the VSP reactions where the fPLC monitors the PI(4,5)P2 reactions and the fTAPP monitors the PI(3,4)P2 reactions. (e) Cartoon representation of fTAPP binding and release with increasing and decreasing PI(3,4)P2 concentrations. The binding of fTAPP to PI(3,4)P2 results in a conformational change that increases the FRET signal. Similarly, a reduction of PI(3,4)P2 results in a decrease in the FRET signal. (f) ΔF/F fPLC FRET ratio versus voltage relationship shows a fluorescence decrease (net 5-phosphatase reaction). n ≥ 9. Data fit with a single Boltzmann equation. (g) ΔF/F fTAPP FRET ratio versus voltage relationship with the fluorescence increase (net 5-phosphatase reaction) predominating at lower voltages and the fluorescence decrease (net 3-phosphatase reaction) predominating at higher voltages. n ≥ 11. Data fit with a double Boltzmann equation. Error bars are ±SEM.
Figure 2.
Figure 2.
Ci-VSP subunits interact with each other. (a and b) Oocytes expressing WT*, His-VSP*, FLAG-VSP*, or a His-VSP*/FLAG-VSP* mixture were processed and pulled down with Co2+ beads or coimmunoprecipitated with anti-FLAG beads. Subsequent Western blots were stained with anti-His (a) and anti-FLAG (b). The His blot shows His-VSP* coimmunoprecipitated from the His/FLAG mixture using anti-FLAG beads (lane 12), whereas the FLAG blot shows FLAG-VSP* pulled down from the His/FLAG mixture using Co2+ beads (lane 8). (c and d) Oocytes expressing WT*, His-VSP*, Myc-VSP*, or a His-VSP*/Myc-VSP* mixture were processed and pulled down with Co2+ beads or coimmunoprecipitated with anti-Myc beads. Western blots were stained with anti-His (c) and anti-Myc (d). The His blot shows His-VSP* coimmunoprecipitated from the His/Myc mixture using anti-Myc beads (lane 12), whereas the Myc blot shows Myc-VSP* pulled down from the His/Myc mixture using Co2+ beads (lane 8). These pull-downs indicate that the individual Ci-VSP subunits interact with each and form multimers on the membrane. Blots are representative of n = 4 experiments. Raw data for the Western blots are shown in Fig. S2. IB, immunoblotting; IP, immunoprecipitation.
Figure 3.
Figure 3.
Ci-VSP forms dimers. (a) Schematic of the SiMPull subunit counting assay depicting the HA-VSP-GFP expression in HEK293 cells followed by pull down of the HA tag with anti-HA on coverslips and recording of the GFP fluorescence using TIRF. TIR, total internal reflection. (b) Left: TIRF images of HA-VSP-GFP single molecules. Middle: Representative trace showing two-step photobleaching of HA-VSP-GFP. AU, arbitrary units. Right: Summary of photobleaching step distribution for HA-VSP-GFP. Two-step bleaching events indicate VSP forms dimers on the membrane. (c) SiMPull data for trimer control, HA-GFP-ASIC1A. Left: TIRF images. Middle: Representative trace showing three-step photobleaching. Right: Summary of photobleaching step distribution. (d) SiMPull data for dimer control, HA-GFP-TREK1. Left: TIRF images. Middle: Representative trace showing two-step photobleaching. Right: Summary of photobleaching step distribution. (e) SiMPull data for monomer control, HA-TREK1 pull down of TREK1-GFP. Left: TIRF images. Middle: Representative trace showing single-step photobleaching. Right: Summary of photobleaching step distribution. Error bars are ±SEM. Bars, 2 μm.
Figure 4.
Figure 4.
Ci-VSP subunits pull each other down consistent with a dimer complex. (a) Schematic of the SiMPull assay where HA-VSP is coexpressed with VSP-GFP in HEK293 cells followed by pull down of the HA-VSP with anti-HA on coverslips. Any HA-VSP dimers will not be visible, and VSP-GFP dimers do not interact and are washed away, leaving the HA-VSP with VSP-GFP dimer as the only visible fluorescent spot using TIRF. TIR, total internal reflection. (b) SiMPull TIRF images of the HA-VSP alone (left), VSP-GFP alone (middle), and HA-VSP/VSP-GFP mixture (right). Fluorescent spots are only visible in the HA-VSP/VSP-GFP sample. Bars, 2 μm. (c) Representative trace showing single-step photobleaching of the HA-VSP/VSP-GFP spots in b. AU, arbitrary units. (d) Summary of the photobleaching step distribution of the HA-VSP/VSP-GFP spots in b. As expected, monomers predominate the mixture, indicating that a HA-VSP subunit pulls down a VSP-GFP subunit, forming a dimer complex. Error bars are ±SEM.
Figure 5.
Figure 5.
Ci-VSP dimerization mediated mainly by VSD. (a) TIRF images of a VSP-GFP pull-down using either HA-VSP (full length, left, reused from Fig. 4 b, right), HA-VSDo (middle), or HA-PDo (right). (b) Summary of the number of single-molecule spots for each pull-down condition. The HA-VSDo was able to pull down almost half of the number of VSP-GFPs compared with full-length HA-VSP. VSP-GFP pull down with HA-PDo was significantly higher than pull down with VSP-GFP alone. Student’s t tests, ***, P < 0.001. (c) TIRF images of HA-VSDo pull-down of PDo-GFP (left) and HA-PDo pull-down of VSDo-GFP (right). No spots were detected in either experiment as expected. (d) Summary of the number of single-molecule spots for each pull-down condition shown in c, e, and f. Student’s t tests, ***, P < 0.001. (e) HA-VSDo pull-down of VSDo-GFP. TIRF single-molecule image is shown on the left, and a summary of the photobleaching step distribution is shown on the right. Spots bleached in mostly single steps, indicating that a VSD is able to pull down another. (f) HA-PDo pull-down of PDo-GFP. TIRF single-molecule image is shown on the left, and a summary of the photobleaching step distribution is shown on the right. Spots bleached in mostly single steps, indicating that a PD is able to pull down another. (g) SiMPull data for HA-VSDo-GFP. Left: TIRF image of single molecules. Middle: Representative trace showing two-step photobleaching. Right: Summary of photobleaching step distribution. Two-step bleaching events indicate VSD–VSDs form dimers on the membrane. (h) SiMPull data for HA-PDo-GFP. Left: TIRF image of single molecules. Middle: Representative trace showing single-step photobleaching. Right: Summary of photobleaching step distribution. PD–PD dimers are weaker than the VSD–VSD dimers. Error bars are ±SEM. Bars, 2 μm.
Figure 6.
Figure 6.
Ci-VSP VSD motions influence each other across the multimer complex. (a) Representative TMRM fluorescence traces during a step from a holding potential of −80 to 200 mV for WT* (G214C), DA* (G214C D331A), WT*/DA*, and WT/DA*. Traces are normalized to the maximal fluorescence change. The deactivation kinetics of the mixtures more closely resemble the WT* alone than the DA* alone, indicating that the WT* VSD influences the VSD kinetics from the DA* subunit. (b) Normalized TMRM fluorescence versus voltage relationship. Data fit to single Boltzmann equations. The voltage dependence of the mixtures more closely resembles the DA* alone than the WT* alone, suggesting that the DA* VSD more strongly influences the VSD voltage dependence. Error bars represent ±SEM; n ≥ 12. Some errors bars are smaller than the size of the symbols.
Figure 7.
Figure 7.
Ci-VSP dimerization responsible for 3-phosphatase activity. (a) Schematic of fTAPP assay where the fTAPP FRET sensor increases FRET when PI(3,4)P2 is produced and decreases FRET when PI(3,4)P2 is depleted. (b) Averaged fTAPP FRET traces over time during a voltage step from a holding potential of −100 to 160 mV for fTAPP coexpressed with varying amounts of His-VSP cRNA: 1.6, 0.8, 0.2, 0.1, 0.05, and 0.02 µg/µl. Higher His-VSP* concentrations display both 5- and 3-phosphatase activity, whereas the lower concentrations only show 5-phosphatase activity. The 0.1 µg/µl samples were evenly split with half the cells showing both activities and half the cells showing only one. n ≥ 11. (c) ΔF/F fTAPP FRET ratio versus voltage relationships for all six cRNA concentrations. As the concentration of His-VSP* decreases, the voltage dependence of the FRET increase shifts to higher voltages whereas the FRET signal decrease disappears. Error bars represent ±SEM; n ≥ 11. Data fit with a double or single Boltzmann equation. (d) Averaged fTAPP FRET traces over time for fTAPP coexpressed with 1:10 mixtures of active and inactive VSP: 0.1:1.0 µg/µl, His-VSP*:FLAG-CS* and 0.2:2.0 µg/µl, His-VSP*:FLAG-CS*. In both cases, only a FRET increase is observed, even though the 0.2 µg/µl concentration alone in b always show both an increase and a decrease, and the 0.1 µg/µl concentration alone in b was evenly split. n ≥ 10.
Figure 8.
Figure 8.
Cartoon schematics presenting possible Ci-VSP dimer organizations. (a) PD-based dimer. (b) VSD-based dimer. (c) Both VSD and PD contribute to dimer interactions. The side-by-side organization most closely agrees with our data. (d) Model for the 5-phosphatase reaction catalyzed by VSP monomer. (e) Model for the 5- and 3-phosphatase reactions catalyzed by VSP dimer.

Similar articles

Cited by

References

    1. Anderluh A., Hofmaier T., Klotzsch E., Kudlacek O., Stockner T., Sitte H.H., and Schütz G.J.. 2017. Direct PIP2 binding mediates stable oligomer formation of the serotonin transporter. Nat. Commun. 8:14089 10.1038/ncomms14089 - DOI - PMC - PubMed
    1. Balla T., Szentpetery Z., and Kim Y.J.. 2009. Phosphoinositide signaling: new tools and insights. Physiology (Bethesda). 24:231–244. 10.1152/physiol.00014.2009 - DOI - PMC - PubMed
    1. Calebiro D., Rieken F., Wagner J., Sungkaworn T., Zabel U., Borzi A., Cocucci E., Zürn A., and Lohse M.J.. 2013. Single-molecule analysis of fluorescently labeled G-protein-coupled receptors reveals complexes with distinct dynamics and organization. Proc. Natl. Acad. Sci. USA. 110:743–748. 10.1073/pnas.1205798110 - DOI - PMC - PubMed
    1. Castle P.M., Zolman K.D., and Kohout S.C.. 2015. Voltage-sensing phosphatase modulation by a C2 domain. Front. Pharmacol. 6:63 10.3389/fphar.2015.00063 - DOI - PMC - PubMed
    1. Dimitrov D., He Y., Mutoh H., Baker B.J., Cohen L., Akemann W., and Knöpfel T.. 2007. Engineering and characterization of an enhanced fluorescent protein voltage sensor. PLoS One. 2:e440 10.1371/journal.pone.0000440 - DOI - PMC - PubMed

Publication types

Substances