. 2018 Jun 28;131(26):2943-2954.
doi: 10.1182/blood-2017-10-813931. Epub 2018 Apr 25.

Novel role of prostate apoptosis response-4 tumor suppressor in B-cell chronic lymphocytic leukemia

Affiliations

Novel role of prostate apoptosis response-4 tumor suppressor in B-cell chronic lymphocytic leukemia

Mary K McKenna et al. Blood. .

Abstract

Prostate apoptosis response-4 (Par-4), a proapoptotic tumor suppressor protein, is downregulated in many cancers including renal cell carcinoma, glioblastoma, endometrial, and breast cancer. Par-4 induces apoptosis selectively in various types of cancer cells but not normal cells. We found that chronic lymphocytic leukemia (CLL) cells from human patients and from Eµ-Tcl1 mice constitutively express Par-4 in greater amounts than normal B-1 or B-2 cells. Interestingly, knockdown of Par-4 in human CLL-derived Mec-1 cells results in a robust increase in p21/WAF1 expression and decreased growth due to delayed G1-to-S cell-cycle transition. Lack of Par-4 also increased the expression of p21 and delayed CLL growth in Eμ-Tcl1 mice. Par-4 expression in CLL cells required constitutively active B-cell receptor (BCR) signaling, as inhibition of BCR signaling with US Food and Drug Administration (FDA)-approved drugs caused a decrease in Par-4 messenger RNA and protein, and an increase in apoptosis. In particular, activities of Lyn, a Src family kinase, spleen tyrosine kinase, and Bruton tyrosine kinase are required for Par-4 expression in CLL cells, suggesting a novel regulation of Par-4 through BCR signaling. Together, these results suggest that Par-4 may play a novel progrowth rather than proapoptotic role in CLL and could be targeted to enhance the therapeutic effects of BCR-signaling inhibitors.


Conflict of interest statement

Conflict-of-interest disclosure: The authors declare no competing financial interests.

Figures

None
Graphical abstract
Figure 1.
Figure 1.
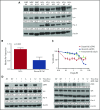
Eμ-Tcl1 CLL spleen cells have elevated levels of Par-4 expression compared with normal B-cell subsets, which increases with progression of disease. (A) CLL cells were harvested from the spleen of Eμ-Tcl1 mice. B-cell subsets from C57BL/6J WT mice were isolated from the peritoneal cavity and spleen. Protein lysates of WT mice represent a pool of 20 mice. Levels of Par-4 and Tcl1 were quantified by western blot and normalized to β-actin. (B) Histogram shows relative Par-4 mRNA expression in Eμ-Tcl1 CLL cells and WT B-cell subsets quantified by qRT-PCR. Par-4 mRNA levels were normalized to mouse 18S mRNA expression and were then normalized to B-1a Par-4 mRNA expression. For panels A and B, results are representative of 2 experiments. Error bars represent standard error of the mean (SEM). *P < .05, **P < .001 as determined by the Student t test. (C) Par-4 protein expression increases with age and disease development in spleen cells isolated from the Eμ-Tcl1 mouse. Par-4 and Tcl1 protein expression is normalized to β-actin. Graphs show (D) correlation of Par-4 protein expression and percentage of CD5+CD19+ cells; (E) correlation of Par-4 protein expression and Tcl1 expression in the spleens of mice at specific ages. Each point represents an average of 3 mice. r2 value determined by Pearson coefficient test and P = .0055 (D) and P = .8824 (E) determined by linear regression analysis. P. Cavity, peritoneal cavity.
Figure 2.
Figure 2.
Eμ-Tcl1 CLL cells have constitutively activated BCR signaling that regulates Par-4 expression. (A) Western blot of Eμ-Tcl1 CLL cells treated with 5 μM fostamatinib for different time points. (B) Western blot of Eμ-Tcl1 CLL cells treated with 5 μM ibrutinib. (C) Survival of Eμ-Tcl1 CLL cells, 2 human CLL (hCLL) cell lines (Mec-1, OSU-CLL), and primary human CLL cells is dependent on BCR signaling. Cells were treated with different concentrations of dasatinib for 48 hours and viability was measured by MTT assay in triplicates. (D) Primary Eμ-Tcl1 CLL cells (left) or Mec-1 CLL cells (right) were treated with 1 μM dasatinib and the protein lysates were analyzed by western blot. (E) Treatment of Eμ-Tcl1 CLL cells (left) or Mec-1 cells (right) with dasatinib decreases Par-4 mRNA as measured by qRT-PCR. Par-4 mRNA is normalized to mouse 18S mRNA expression. In immunoblots, phosphorylated protein values were normalized to total protein. β-actin or glyceraldehyde-3-phosphate dehydrogenase (GAPDH) was used to normalize total protein levels (Lyn, Syk, Btk, and Par-4) in the samples. Results are representative of 3 or more experiments.
Figure 3.
Figure 3.
Inhibition and silencing of BCR signaling results in a decrease in Par-4 expression. (A) Mec-1 CLL cells were treated with control (Ctrl) or Lyn-specific shRNA lentivirus and selected through puromycin treatment. Cells were collected at day 17 and total protein and RNA was isolated. Left panel, Levels of Lyn protein. Right panel, Levels of Par-4 mRNA. (B) Human CLL cells were electroporated with CD79a siRNA and incubated for 24 hours. Total protein was isolated and probed for CD79a and Par-4. Western blot represents data from 1 CLL donor with average results for 4 other donors shown as histogram. Ctrl siRNA, n = 2; CD79a siRNA, n = 2. Error bars represent SEM. (C) Surface IgM levels were measured on human CLL cells electroporated with control and CD79a siRNA by flow cytometry (left, representative histogram for 1 patient; middle, average mean fluorescent intensity [MFI] of IgM expression for 4 donors). Total RNA was isolated from cells, and CD79a and Par-4 mRNA were measured by qRT-PCR. Expression values were normalized to human 18S expression performed in triplicate for 4 different donors. *P ≤ .05, **P ≤ .01, ***P ≤ .001 determined by the Student t test.
Figure 4.
Figure 4.
Par-4 knockdown in Mec-1 CLL cells results in reduced growth in vitro and in vivo. (A) Western blot showing a reduction in Par-4 in Mec-1 cells expressing Par-4–specific shRNA. Par-4 protein values were normalized to β-actin. (B) Par-4 mRNA is decreased in Mec-1 cells expressing Par-4 shRNA compared with those expressing a control shRNA. Par-4 mRNA expression was normalized to human 18S and was measured in triplicate. (C) Growth curve of Mec-1 cells expressing control or Par-4–specific shRNA. Curves represent an average of 4 control and 4 Par-4 shRNA-treated clones. Slopes of the curves are different (P = .0024) as calculated by linear regression analysis. (D) Mec-1 cells (2 × 10⁶) treated with control or Par-4–specific shRNA lentivirus were engrafted into NSGS mice (n = 6) subcutaneously with Matrigel. Images represent 2 mice of 6 after 35 days of growth (left). Tumor volumes are plotted as a function of time (middle panel). Tumor volumes were calculated by measuring length and width with a caliper. Difference between the slopes of the 2 lines was found to be statistically significant (P ≤ .001) by linear regression analysis. After 35 days of growth, the tumors were excised and western blot analysis was performed to confirm tumors retained Par-4 knockdown in each mouse throughout the experiment (right panel). The numbers above blots refer to individual mice. Error bars represent SEM. L, left; R, right.
Figure 5.
Figure 5.
Par-4 knockdown results in G1 arrest and increased p21 expression. (A) Mec-1 cell clones expressing control or Par-4–specific shRNA were stained with propidium iodide. Cell-cycle analysis was performed by flow cytometry. Histograms represent mean ± SE of 4 control shRNA clones and 5 Par-4 shRNA clones (G1, P ≤ .0001; S, P ≤ .0002; G2, P = .15 comparing control to Par-4 shRNA-expressing clones). (B) shRNA lentivirus-infected cells were collected and total protein was isolated. Par-4 and p21 proteins were measured through immunoblot analysis. Protein quantifications were normalized to β-actin. (C-D) RNA was isolated from shRNA lentivirus-infected cells. Par-4 mRNA (C) and p21 mRNA (D) were quantified by qRT-PCR and were normalized to human 18S expression (C, P ≤ .0001; D, P ≤ .003 comparing control shRNA clones to Par-4 shRNA clones). (E) Human CLL cells were electroporated with CD79a siRNA and incubated for 72 hours. CD79a, Par-4, and p21 mRNA levels were quantified by qRT-PCR and were normalized to human 18S. Results represent mean ± SEM of triplicate determinations and an average of 4 CLL patient donors.
Figure 6.
Figure 6.
Loss of Par-4 in the Eμ-Tcl1–transgenic mice delays CLL growth and increases survival. Leukemic status in Par-4+/+ and Par-4−/− EµTcl1 mice was measured by staining of peripheral blood lymphocytes for CD5+CD19+ cells. Animals died of natural progression of disease or were euthanized due to poor body conditions for humane reasons. (A) Percentage of CLL cases detected with age of Par-4+/+Tcl1 and Par-4−/−Tcl1 cohorts over time. P = .0002 comparing the 2 curves by log-rank test (n = 16, Par-4+/+Eμ-Tcl1; n = 10, Par-4−/−Tcl1). (B) Effect of Par-4 loss on the survival of Eµ-Tcl1 mice. Survival curve represents a total of 17 Par-4+/+ Tcl1 mice and 9 Par-4−/−Tcl1 mice. P = .0472 comparing the 2 curves by log-rank test. (C) Tissues from Par-4−/−Tcl1 mice were harvested and expression of Par-4 and Tcl1 proteins was determined by western blot analysis. Par-4 was detected in the spleen of Par-4+/+Tcl1 mouse, but was not present in any of the tissues of the Par-4−/−Tcl1 mouse. (D) Spleens from multiple Eμ-Tcl1 mice and Par-4−/−Tcl1 mice were harvested and total protein was isolated. Immunoblots were probed for Par-4 and p21. Protein expression was normalized to β-actin. LN, lymph node; Mesen. LN, mesenteric lymph node.
Figure 7.
Figure 7.
Primary human CLL cells have high levels of Par-4 protein expression. (A) Immunoblot analysis of activated SFK and Par-4 protein expression levels in primary human CLL (hCLL) samples compared with the whole peripheral blood lysate of normal donors (WBC). Protein values are normalized to β-actin. (B) Cell lysates of purified B cells from CLL patients (n = 4) and from healthy donors (n = 4) were probed for Par-4. The bar graph represents Par-4 protein values normalized to GAPDH expression. P = .022 determined by Student t test. (C) Survival curves of hCLL cells treated with BCR-signaling inhibitors. Assay performed in triplicate. Error bars represent SEM. (D) Primary human peripheral blood CLL cells (97.7% CD5+CD19+) were treated with 1 μM dasatinib (left) and 5 μM fostamatinib (right). p-SFK and Syk levels are normalized to their respective total protein levels. Total Syk, Lyn, and Par-4 protein expression levels are normalized to β-actin.

References

    1. Dighiero G, Hamblin TJ. Chronic lymphocytic leukaemia. Lancet. 2008;371(9617):1017-1029. - PubMed
    1. Chiorazzi N, Rai KR, Ferrarini M. Chronic lymphocytic leukemia. N Engl J Med. 2005;352(8):804-815. - PubMed
    1. Burger JA, Chiorazzi N. B cell receptor signaling in chronic lymphocytic leukemia. Trends Immunol. 2013;34(12):592-601. - PMC - PubMed
    1. Gururajan M, Jennings CD, Bondada S. Cutting edge: constitutive B cell receptor signaling is critical for basal growth of B lymphoma. J Immunol. 2006;176(10):5715-5719. - PubMed
    1. Jain N, O’Brien S. Targeted therapies for CLL: practical issues with the changing treatment paradigm. Blood Rev. 2016;30(3):233-244. - PubMed

Publication types

MeSH terms

Substances