. 2018 Apr 25;9(1):1649.
doi: 10.1038/s41467-018-04082-2.

The multiple myeloma risk allele at 5q15 lowers ELL2 expression and increases ribosomal gene expression

Affiliations

The multiple myeloma risk allele at 5q15 lowers ELL2 expression and increases ribosomal gene expression

Mina Ali et al. Nat Commun. .

Abstract

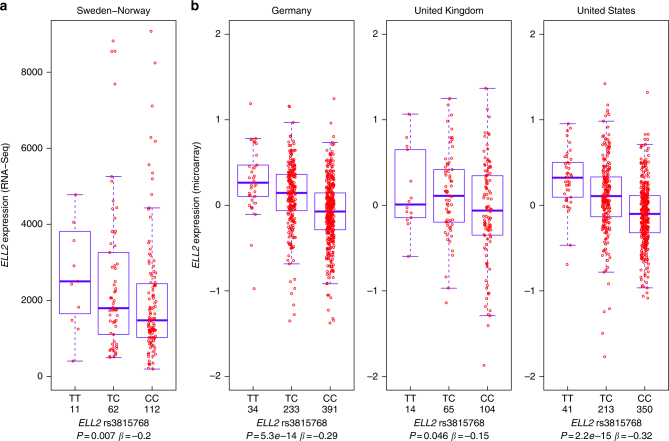
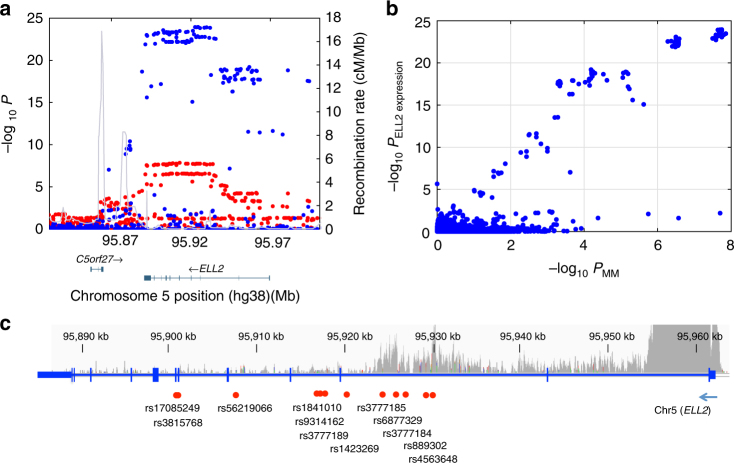
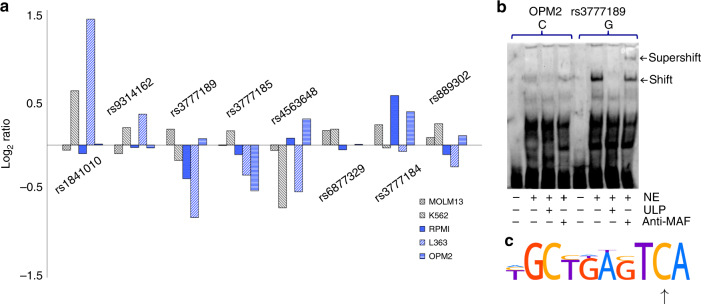
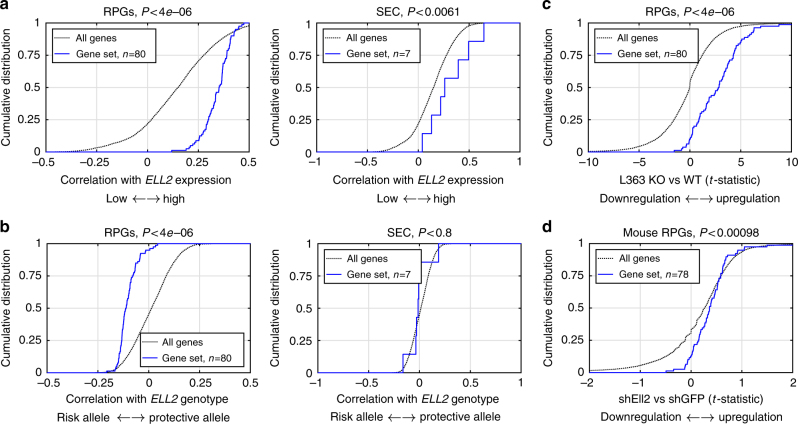
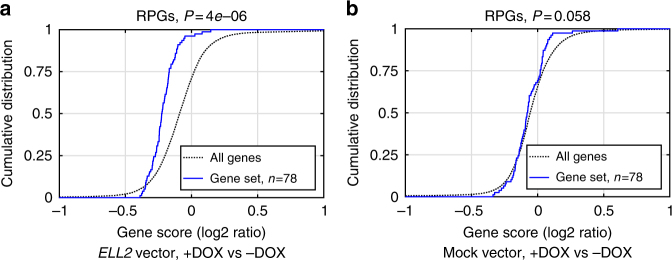
Recently, we identified ELL2 as a susceptibility gene for multiple myeloma (MM). To understand its mechanism of action, we performed expression quantitative trait locus analysis in CD138+ plasma cells from 1630 MM patients from four populations. We show that the MM risk allele lowers ELL2 expression in these cells (Pcombined = 2.5 × 10⁻²⁷; βcombined = -0.24 SD), but not in peripheral blood or other tissues. Consistent with this, several variants representing the MM risk allele map to regulatory genomic regions, and three yield reduced transcriptional activity in plasmocytoma cell lines. One of these (rs3777189-C) co-locates with the best-supported lead variants for ELL2 expression and MM risk, and reduces binding of MAFF/G/K family transcription factors. Moreover, further analysis reveals that the MM risk allele associates with upregulation of gene sets related to ribosome biogenesis, and knockout/knockdown and rescue experiments in plasmocytoma cell lines support a cause-effect relationship. Our results provide mechanistic insight into MM predisposition.


Conflict of interest statement

The authors declare no competing interests.

Figures

Fig. 1
Fig. 1
The ELL2 MM risk allele confers lower ELL2 expression in MM plasma cells. a Boxplot showing decreased expression of ELL2 exon 10 associated with the MM risk allele (represented by rs3815768-C) compared to the protective allele (rs3815768-T) in CD138+ bone marrow cells from 185 Swedish and Norwegian MM patients. Expression values are fragments per kilo base of exon per million fragments mapped (FPKM) obtained by mRNA sequencing. b Boxplots showing a corresponding association in Affymetrix gene expression microarray data CD138+ bone marrow cells from MM patients from Germany, United Kingdom, and the US. Boxes indicate medians and the first and third quartiles. Whiskers indicate first and third quartiles plus 1.5 times the interquartile range. Outliers are plotted as individual dots. Pearson correlation P values and effect size (β) indicated
Fig. 2
Fig. 2
ELL2 MM risk variants coincide with ELL2 eQTLs. a Regional association plot of the ELL2 locus at chromosome 5q15. Blue dots indicate association with ELL2 expression based on the four sample sets (−log10-transformed Fisher’s inverse χ2 P values; meta-analysis of 158 Swedish-Norwegian and 1445 SNP microarray-genotyped samples from Germany, UK, and US). Red dots indicate association with MM (−log10-transformed logistic regression P values from our previous Swedish-Norwegian-Iceland MM association study). The lead variant for the effect on ELL2 expression is rs9314162. Meiotic recombination rates calculated from the 1000 Genomes compendium indicted by the gray curve. b Two-dimensional plot of the same association P values. The two top-right clusters contained 66 variants influencing both MM risk and ELL2 expression. c Schematic representation of ELL2. The indicated variants are the lead variants for ELL2 expression (rs9314162), the first reported MM lead variant (rs56219066), the best-supported MM lead variant (rs1423269), the eight variants selected for functional evaluation (rs1841010, rs9314162, rs3777189, rs3777185, rs6877329, rs3777184, rs889302, and rs4563648), and the coding variant rs3815768 used for genotyping in the mRNA-sequencing data. Gray curve indicates ChIP-seq read density for the H3K4me3 histone mark in L363 cells, and main (high peak around exon 1) and internal promoters (lower peaks across introns 1 and 2)
Fig. 3
Fig. 3
Identification of causal variants. a We evaluated eight variants located in regulatory regions of ELL2 (Fig. 2c and Supplementary Table 1) using luciferase assays in RPMI-8226, OPM2, and L363 plasmocytoma lines, and in K562 and MOLM-13 cells that represent other hematologic lineages. Consistent with the effect on ELL2 expression in plasma cells but not in peripheral blood, three risk variants (rs3777189-C, rs3777185-C, and rs4563648-G) yielded reduced activity in the plasma cell lines but not in the control cell lines, whereas the remaining variants showed opposite or inconsistent effects. Plotted values represent log2-ratios of luciferase activities for the risk alleles over their corresponding protective alleles (median over tri or quadruplicates). b To identify the responsible transcription factors, we carried out sequence analyses and electrophoretic mobility shift assays (EMSA) (Supplementary Figs. 5 and 6). Shown here is EMSA with nuclear extract (NE) from OPM2 cells (lanes 2–4 and 6–8), and probes representing genomic sequence at rs3777189 with the risk/low-expressing allele (C) or the protective/high-expressing allele (G) in the center (lanes 1–4 and 5–8, respectively). The G allele showed an allele-specific shift (lane 6) that was outcompeted with unlabeled probe (ULP; lane 7) and supershifted with MAFF/G/K antibody (lane 8). Similar results were seen with L363 cells (Supplementary Fig. 5). c Sequence analysis predicted loss of a MAFF/G/K motif (Supplementary Table 4). Shown here is the MAFK motif from the HOCOMOCO-10 database. Arrow indicates G changed to C by the rs3777189-C risk variant
Fig. 4
Fig. 4
The ELL2 MM risk allele increases ribosomal gene expression. a To explore the downstream effects of reduced ELL2 function, we first calculated the correlation between ELL2 and other genes in the Swedish-Norwegian mRNA-sequencing data. Here, ELL2 showed significant correlation with a large set of genes. Enrichment analysis revealed an over-representation of positive correlations among multiple gene sets related to ribosomes biogenesis and function, including ribosomal protein coding genes (RPGs) and the SEC (see also Supplementary Table 6). b Enrichment analysis of correlation between the ELL2 MM risk allele and gene expression in the same dataset identified RPGs and other gene sets related to ribosomes. This enrichment was in the direction of the ELL2 risk allele, which confers lower ELL2 expression (see also Supplementary Table 7). c Similarly, analysis of ELL2 CRISPR-Cas9 knockout (KO) L363 cells showed an upregulation of RPGs and other gene sets related to ribosome biogenesis and function (see also Supplementary Tables 8 and 9), i.e., effects in the same direction as the ELL2 MM risk allele. d Finally, similar changes were seen in mouse MPC1 plasmocytoma cells treated with shRNA against either Ell2 vs GFP. These data support that, in addition to the effect on ELL2 itself, the ELL2 MM risk allele confers additional changes in gene expression, including an increased expression of genes involved in ribosomal biogenesis, possibly as a compensatory reaction
Fig. 5
Fig. 5
Reconstitution of ELL2 expression. For further validation of the effect of ELL2 knockout on RPG expression, we transduced CRISPR-resistant, doxycycline-inducible ELL2 or mock vector into our L363-ELL2-KO cells. Following culture with or without doxycycline (DOX), the cells were gene expression-profiled using mRNA sequencing: a Comparing the gene expression profiles of ELL2-transduced cells cultured with (n = 3) vs without DOX (n = 4), we observed an enrichment of negative gene scores (i.e., downregulation) of ribosomal gene sets, consistent with a rescue effect; b no similar enrichment was seen with mock-transduced control cells (n = 4 samples with vs 4 without DOX). These data further support a cause–effect relationship, and that the results in Fig. 4b are not due to CRISPR-Cas9 off-target effects

Similar articles

Cited by

References

    1. Rajkumar SV, et al. International Myeloma Working Group updated criteria for the diagnosis of multiple myeloma. Lancet Oncol. 2014;15:e538–e548. doi: 10.1016/S1470-2045(14)70442-5. - DOI - PubMed
    1. Weiss BM, Abadie J, Verma P, Howard RS, Kuehl WM. A monoclonal gammopathy precedes multiple myeloma in most patients. Blood. 2009;113:5418–5422. doi: 10.1182/blood-2008-12-195008. - DOI - PMC - PubMed
    1. Landgren O, et al. Monoclonal gammopathy of undetermined significance (MGUS) consistently precedes multiple myeloma: a prospective study. Blood. 2009;113:5412–5417. doi: 10.1182/blood-2008-12-194241. - DOI - PMC - PubMed
    1. Kyle RA, et al. Prevalence of monoclonal gammopathy of undetermined significance. N. Engl. J. Med. 2006;354:1362–1369. doi: 10.1056/NEJMoa054494. - DOI - PubMed
    1. Koura DT, Langston AA. Inherited predisposition to multiple myeloma. Ther. Adv. Hematol. 2013;4:291–297. doi: 10.1177/2040620713485375. - DOI - PMC - PubMed

Publication types

MeSH terms

Substances