

miR-9 upregulation leads to inhibition of erythropoiesis by repressing FoxO3
- PMID: 29695725
- PMCID: PMC5916915
- DOI: 10.1038/s41598-018-24628-0
miR-9 upregulation leads to inhibition of erythropoiesis by repressing FoxO3
Abstract
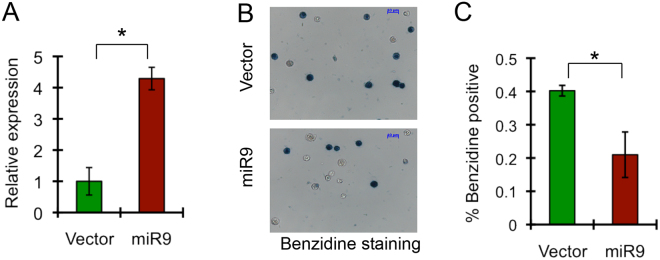
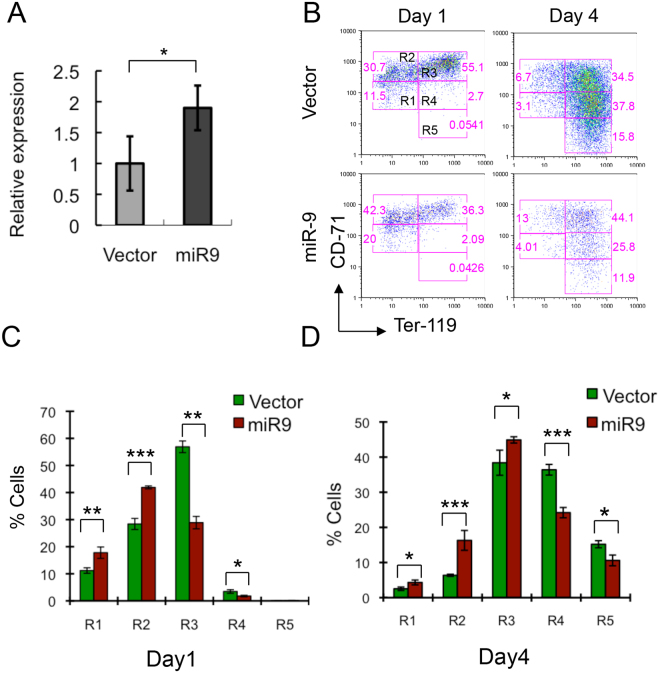
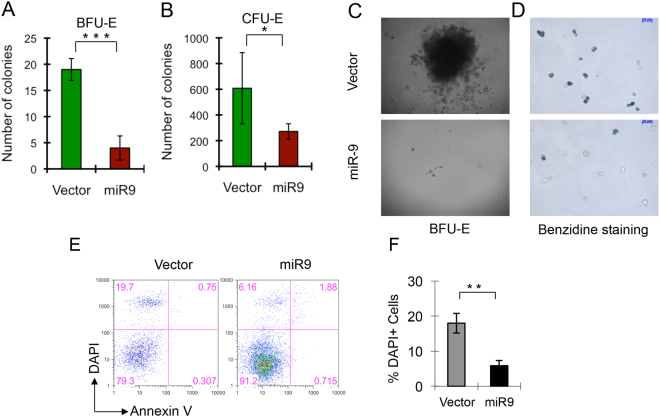
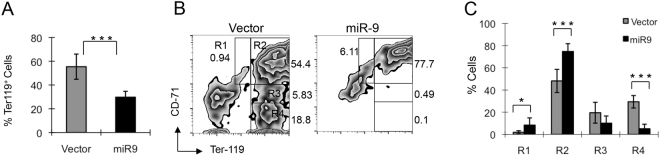
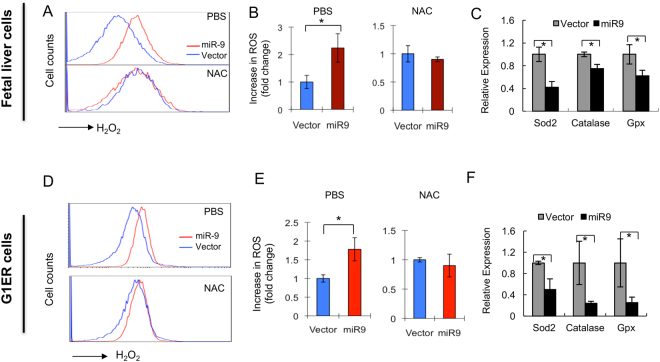
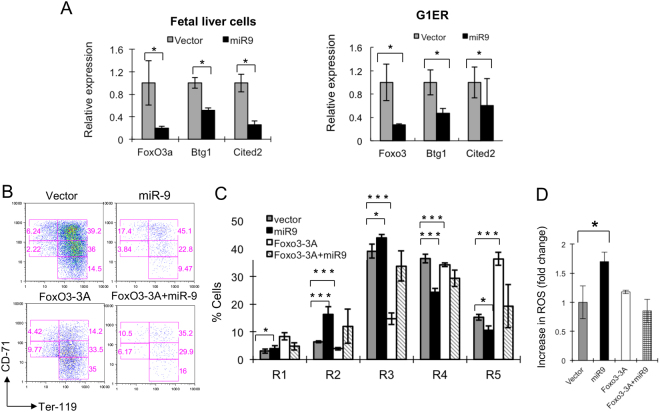
MicroRNAs (miRNAs) are emerging as critical regulators of normal and malignant hematopoiesis. In previous studies of acute myeloid leukemia miR-9 overexpression was commonly observed. Here, we show that ectopic expression of miR-9 in vitro and in vivo significantly blocks differentiation of erythroid progenitor cells with an increase in reactive oxygen species (ROS) production. Consistent with this observation, ROS scavenging enzymes, including superoxide dismutase (Sod2), Catalase (Cat), and glutathine peroxidase (Gpx1), are down-regulated by miR-9. In addition, miR-9 suppresses expression of the erythroid transcriptional regulator FoxO3, and its down-stream targets Btg1 and Cited 2 in erythroid progenitor cells, while expression of a constitutively active form of FoxO3 (FoxO3-3A) reverses miR-9-induced suppression of erythroid differentiation, and inhibits miR-9-induced ROS production. Thus, our findings indicate that aberrant expression of miR-9 blocks erythropoiesis by deregulating FoxO3-mediated pathways, which may contribute to the ineffective erythropoiesis observed in patients with hematological malignancies.
Conflict of interest statement
The authors declare no competing interests.
Figures
Similar articles
-
Foxo3 is required for the regulation of oxidative stress in erythropoiesis.J Clin Invest. 2007 Aug;117(8):2133-44. doi: 10.1172/JCI31807. J Clin Invest. 2007. PMID: 17671650 Free PMC article.
-
Paraquat treatment modulates integrin associated protein (CD47) and basigin (CD147) expression and mitochondrial potential on erythroid cells in mice.Environ Toxicol Pharmacol. 2018 Mar;58:37-44. doi: 10.1016/j.etap.2017.12.007. Epub 2017 Dec 23. Environ Toxicol Pharmacol. 2018. PMID: 29287252
-
Enhanced erythroid cell differentiation in hypoxic condition is in part contributed by miR-210.Blood Cells Mol Dis. 2013 Aug;51(2):98-103. doi: 10.1016/j.bcmd.2013.03.005. Epub 2013 Apr 24. Blood Cells Mol Dis. 2013. PMID: 23623309
-
The role of microRNAs in normal and malignant hematopoiesis.Eur J Haematol. 2010 Jan 1;84(1):1-16. doi: 10.1111/j.1600-0609.2009.01348.x. Epub 2009 Sep 10. Eur J Haematol. 2010. PMID: 19744129 Review.
-
Manganese superoxide dismutase and glutathione peroxidase-1 contribute to the rise and fall of mitochondrial reactive oxygen species which drive oncogenesis.Biochim Biophys Acta Bioenerg. 2017 Aug;1858(8):628-632. doi: 10.1016/j.bbabio.2017.01.006. Epub 2017 Jan 11. Biochim Biophys Acta Bioenerg. 2017. PMID: 28087256 Free PMC article. Review.
Cited by
-
TFII-I/Gtf2i and Erythro-Megakaryopoiesis.Front Physiol. 2020 Sep 25;11:590180. doi: 10.3389/fphys.2020.590180. eCollection 2020. Front Physiol. 2020. PMID: 33101065 Free PMC article.
-
MicroRNAs in the Myelodysplastic Syndrome.Acta Naturae. 2021 Apr-Jun;13(2):4-15. doi: 10.32607/actanaturae.11209. Acta Naturae. 2021. PMID: 34377552 Free PMC article.
-
Expression of inflammatory interleukins and selected miRNAs in non-small cell lung cancer.Sci Rep. 2021 Mar 3;11(1):5092. doi: 10.1038/s41598-021-84408-1. Sci Rep. 2021. PMID: 33658555 Free PMC article.
-
TFII-I/GTF2I regulates globin gene expression and stress response in erythroid cells.J Biol Chem. 2025 Mar;301(3):108227. doi: 10.1016/j.jbc.2025.108227. Epub 2025 Jan 24. J Biol Chem. 2025. PMID: 39864622 Free PMC article.
-
The role of mTOR-mediated signals during haemopoiesis and lineage commitment.Biochem Soc Trans. 2018 Oct 19;46(5):1313-1324. doi: 10.1042/BST20180141. Epub 2018 Aug 28. Biochem Soc Trans. 2018. PMID: 30154096 Free PMC article. Review.
References
Publication types
MeSH terms
Substances
Grants and funding
LinkOut - more resources
Full Text Sources
Other Literature Sources
Research Materials
Miscellaneous
