. 2018 Apr 25;8(1):6551.
doi: 10.1038/s41598-018-24497-7.

Significant loss of mitochondrial diversity within the last century due to extinction of peripheral populations in eastern gorillas

Affiliations

Significant loss of mitochondrial diversity within the last century due to extinction of peripheral populations in eastern gorillas

Tom van der Valk et al. Sci Rep. .

Abstract

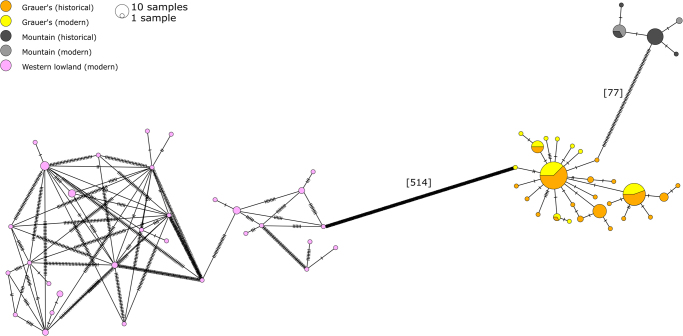
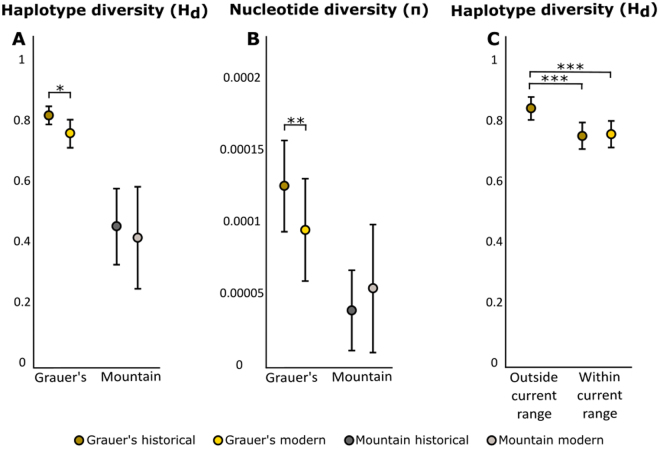
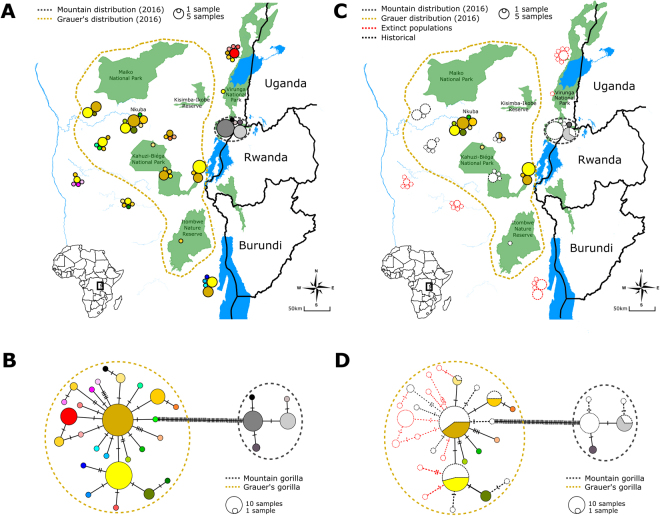
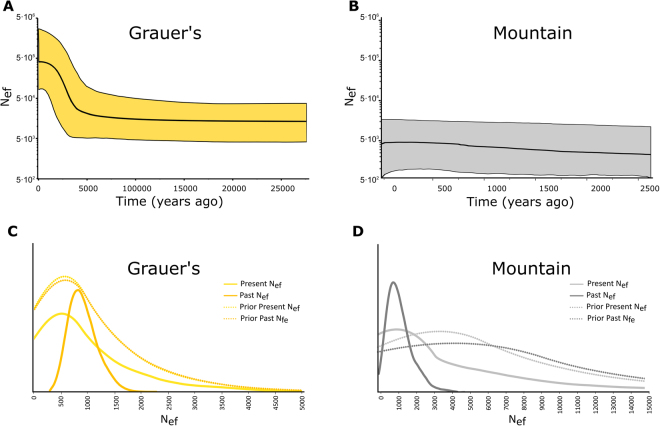
Species and populations are disappearing at an alarming rate as a direct result of human activities. Loss of genetic diversity associated with population decline directly impacts species' long-term survival. Therefore, preserving genetic diversity is of considerable conservation importance. However, to assist in conservation efforts, it is important to understand how genetic diversity is spatially distributed and how it changes due to anthropogenic pressures. In this study, we use historical museum and modern faecal samples of two critically endangered eastern gorilla taxa, Grauer's (Gorilla beringei graueri) and mountain gorillas (Gorilla beringei beringei), to directly infer temporal changes in genetic diversity within the last century. Using over 100 complete mitochondrial genomes, we observe a significant decline in haplotype and nucleotide diversity in Grauer's gorillas. By including historical samples from now extinct populations we show that this decline can be attributed to the loss of peripheral populations rather than a decrease in genetic diversity within the core range of the species. By directly quantifying genetic changes in the recent past, our study shows that human activities have severely impacted eastern gorilla genetic diversity within only four to five generations. This rapid loss calls for dedicated conservation actions, which should include preservation of the remaining peripheral populations.


Conflict of interest statement

The authors declare no competing interests.

Figures

Figure 1
Figure 1
Minimum spanning haplotype network based on complete mitochondrial genomes. Haplotypes are coloured by (sub)species and sample age (historical or modern). Ticks on the haplotype edges correspond to the number of substitution. The total number of substitutions between subspecies is shown in square brackets.
Figure 2
Figure 2
(A) Haplotype and (B) nucleotide diversity in both eastern gorilla subspecies. (C) Haplotype diversity in Grauer’s gorilla, grouped by geographic region and sampling period. Error bars depict 95% CI.
Figure 3
Figure 3
Haplotype map and haplotype network showing the geographic and genetic placement of haplotypes for both historical and modern samples. Each haplotype is marked by a unique colour. Dashed line in panels A and C designates the currently estimated distribution range of Grauer’s gorillas based on expert knowledge. Distribution of studied mountain gorilla samples is limited to the Virunga Massif, but is presented larger on the map for clarity. (A) Geographic location of all samples and (B) the corresponding mtDNA haplotype network. (C) Geographic location and (D) the corresponding mtDNA haplotype network of modern samples (colored) and historical samples (shown as outlines). Red outlines designate historical samples from locations outside the current distribution range, where Grauer’s gorillas are extinct today. Maps were obtained from ©OpenStreetMap contributors and modified in Inkscape 0.92 (https://inkscape.org/)
Figure 4
Figure 4
(A,B) Extended Bayesian skyline plots for both eastern gorilla subspecies. Time is presented on the x-axis (years ago, note different time scales in Grauer’s and mountain gorillas), the effective female population size, assuming a generation time of 20 years, is shown on the y-axis (log-transformed). Black line shows the estimate of the mean and the colored areas corresponds to the 95% highest probability density interval. (C,D) Estimates of female effective population size in historical and modern Grauer’s and mountain gorillas, as inferred by approximate Bayesian computation. Probability is shown on the y-axis (unit-less). Solid lines show the inferred posterior probability distribution of present and past female effective population sizes, dotted lines depict the priors.

Similar articles

Cited by

References

    1. Pimm SL, et al. The biodiversity of species and their rates of extinction, distribution, and protection. Science. 2014;344:1246752–1246752. doi: 10.1126/science.1246752. - DOI - PubMed
    1. Lewis SL, Maslin MA. Defining the Anthropocene. Nature. 2015;519:171–180. doi: 10.1038/nature14258. - DOI - PubMed
    1. Waters CN, et al. The Anthropocene is functionally and stratigraphically distinct from the Holocene. Science. 2016;351:aad2622. doi: 10.1126/science.aad2622. - DOI - PubMed
    1. Barnosky AD, et al. Has the Earth’s sixth mass extinction already arrived? Nature. 2011;471:51–57. doi: 10.1038/nature09678. - DOI - PubMed
    1. Ceballos G, et al. Accelerated modern human-induced species losses: Entering the sixth mass extinction. Sci. Adv. 2015;1:e1400253–e1400253. doi: 10.1126/sciadv.1400253. - DOI - PMC - PubMed

Publication types

LinkOut - more resources