. 2018 Apr 25;8(1):6547.
doi: 10.1038/s41598-018-24552-3.

East Asian Winter Monsoon Impacts the ENSO-related Teleconnections and North American Seasonal Air Temperature Prediction

Affiliations

East Asian Winter Monsoon Impacts the ENSO-related Teleconnections and North American Seasonal Air Temperature Prediction

Tianjiao Ma et al. Sci Rep. .

Abstract

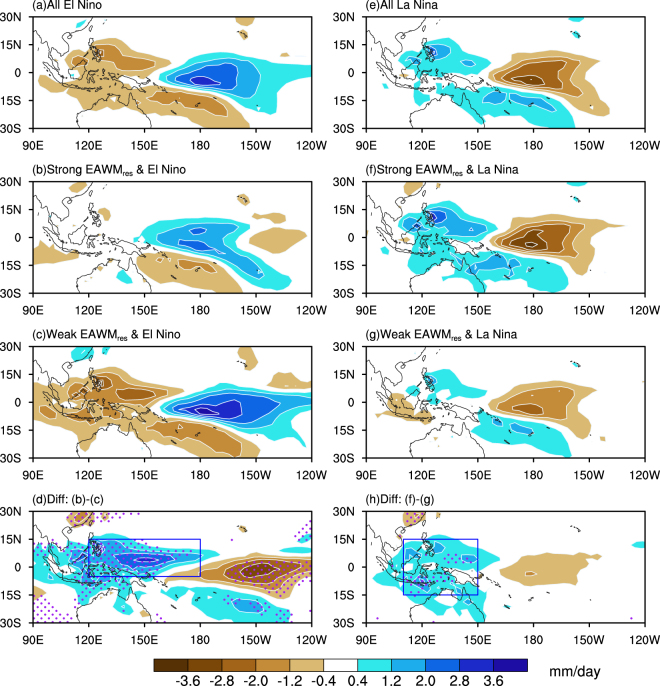
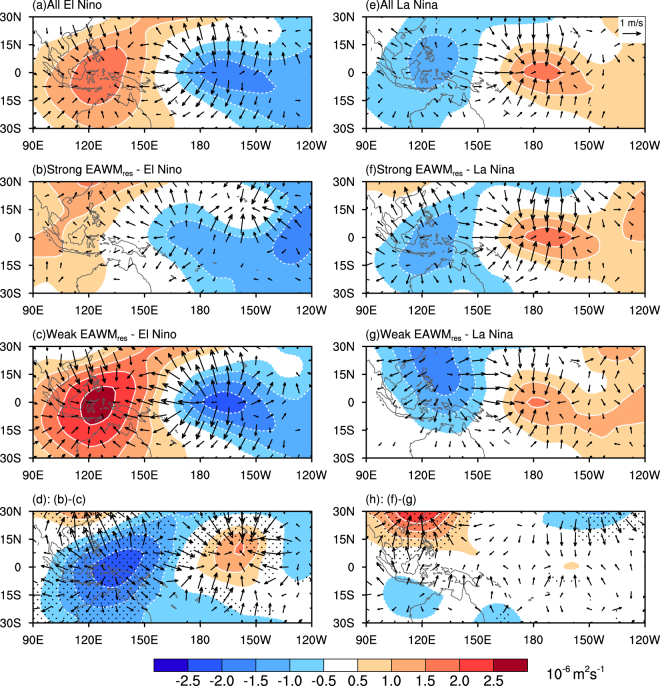
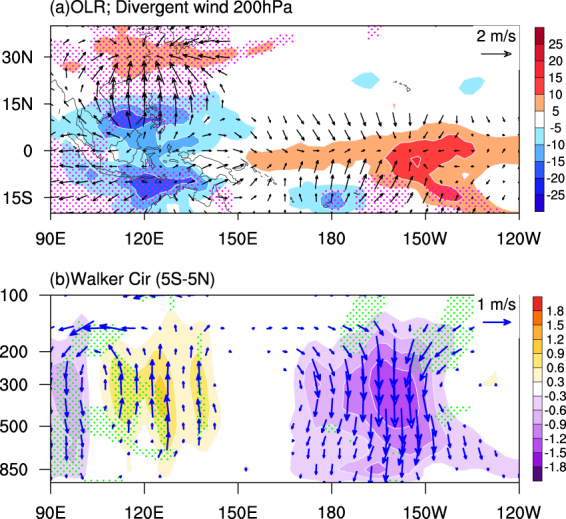
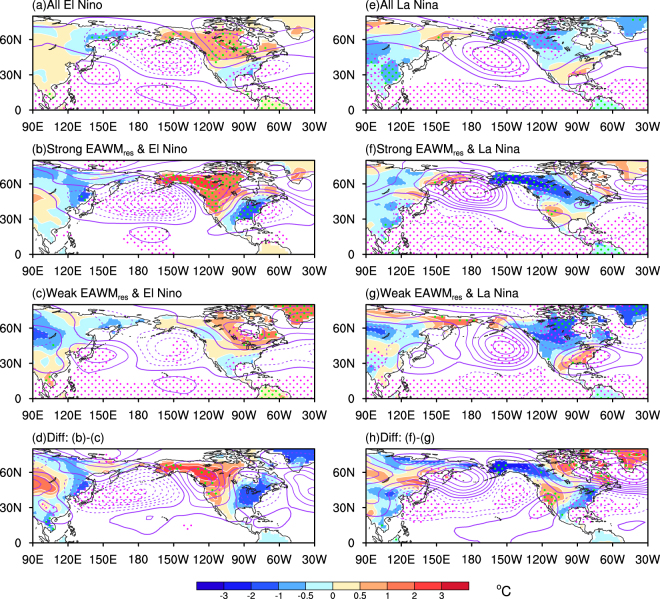
El Niño-Southern Oscillation (ENSO) is a key feature for seasonal weather and climate prediction in the extra-tropics since related sea surface temperature anomalies induce precipitation anomalies that generate poleward propagating Rossby waves and teleconnections. The East Asian winter monsoon (EAWM) is driven by processes originating over the Asian continent and, to a lesser degree, by ENSO-related tropical convection. EAWM also strongly affects convection and precipitation patterns over the western tropical Pacific by cold air outbreaks reaching equatorial latitudes. Hence, one can expect a modulating effect of EAWM on the generation of Rossby wave trains related to ENSO. By increasing the convective heating over the western Pacific, strong EAWM strengthens the Pacific Walker circulation, and weakens (strengthens) the El Niño (La Niña) related effects on the extra-tropics via a modulation of the Pacific North America teleconnection pattern. Our results indicate that, for seasonal prediction over North America, along with ENSO the variability of EAWM should also be taken into account. The climate anomalies over the North America for the same phase of ENSO are significantly different for strong and weak EAWM.


Conflict of interest statement

The authors declare no competing interests.

Figures

Figure 1
Figure 1
Composite winter mean (DJF) rainfall anomalies (Units: mm/day) in groups of: (a) mix of all El Niño events; (b) strong EAWMres-El Niño; (c) weak EAWMres-El Niño; (d) the difference between (b) and (c); (e) mix of all La Niña events; (f) strong EAWMres-La Niña; (g) weak EAWMres-La Niña; and (h) the difference between (f) and (g). Regions shaded with purple dots in (d) and (h) indicate the 90% confidence level. The maps in the figure are generated using the NCAR Command Language (NCL) (Version 6.4.0 & URL: http://www.ncl.ucar.edu/Download/).
Figure 2
Figure 2
As in Fig. 1, but for 200-hPa divergent winds (vectors; m s−1) and velocity potential (contours; 10−6 m2 s−1). Regions shaded with black dots in (d) and (h) indicate that either the divergent winds or velocity potential are significant at the 90% confidence level. The maps in the figure are generated using the NCAR Command Language (NCL) (Version 6.4.0 & URL: http://www.ncl.ucar.edu/Download/).
Figure 3
Figure 3
(a) Difference between strong and weak EAWMres during the ENSO years: Outgoing Longwave Radiation (OLR; color filling, unit: W/m2); divergent winds at 200hPa (vector). The time period is 1979–2016 due to the short coverage of OLR dataset. (b) Difference of tropical omega (color filling) and zonal Walker circulation (vector) for average of 5°S-5°N between strong and weak EAWMres during the ENSO years. The original omega (unit: Pa/s) is multiplied by −100.0 so that positive values indicate upward motion. Regions shaded with dots indicate the 90% confidence level. The maps in the figure are generated using the NCAR Command Language (NCL) (Version 6.4.0 & URL: http://www.ncl.ucar.edu/Download/).
Figure 4
Figure 4
As in Fig. 1, but for winter-mean North American surface air temperature anomalies (color) and 500 hPa geopotential height anomalies (purple lines, CI = 10 gpm, zero line is bolded). Purple and green dots indicate that the HGT500 and SAT anomalies exceed 90% confidence levels, respectively. The maps in the figure are generated using the NCAR Command Language (NCL) (Version 6.4.0 & URL: http://www.ncl.ucar.edu/Download/).

References

    1. Rasmusson EM, Carpenter TH. Variations in tropical sea surface temperature and surface wind fields associated with the Southern Oscillation/El Niño. Mon. Weath. Rev. 1982;110:354–384. doi: 10.1175/1520-0493(1982)110<0354:VITSST>2.0.CO;2. - DOI
    1. Trenberth KE, Caron JM. The Southern Oscillation revisited: Sea level pressures, surface temperatures, and precipitation. J. Clim. 2000;13:4358–4365. doi: 10.1175/1520-0442(2000)013<4358:TSORSL>2.0.CO;2. - DOI
    1. Horel JD, Wallace JM. Planetary-scale atmospheric phenomena associated with the Southern Oscillation. Mon. Weath. Rev. 1981;109:813–829. doi: 10.1175/1520-0493(1981)109<0813:PSAPAW>2.0.CO;2. - DOI
    1. Ropelewski CF, Halpert MS. Global and regional scale precipitation patterns associated with the El Niño/Southern Oscillation. Mon. Weath. Rev. 1987;115:1606–1626. doi: 10.1175/1520-0493(1987)115<1606:GARSPP>2.0.CO;2. - DOI
    1. Gershunov A, Barnett TP. Interdecadal modulation of ENSO teleconnections. Bull. Amer. Meteor. Soc. 1998;79:2715–2725. doi: 10.1175/1520-0477(1998)079<2715:IMOET>2.0.CO;2. - DOI

LinkOut - more resources