. 2018 Apr 25;8(1):6528.
doi: 10.1038/s41598-018-19919-5.

Integrative network analyses of wilt transcriptome in chickpea reveal genotype dependent regulatory hubs in immunity and susceptibility

Affiliations

Integrative network analyses of wilt transcriptome in chickpea reveal genotype dependent regulatory hubs in immunity and susceptibility

Nasheeman Ashraf et al. Sci Rep. .

Abstract

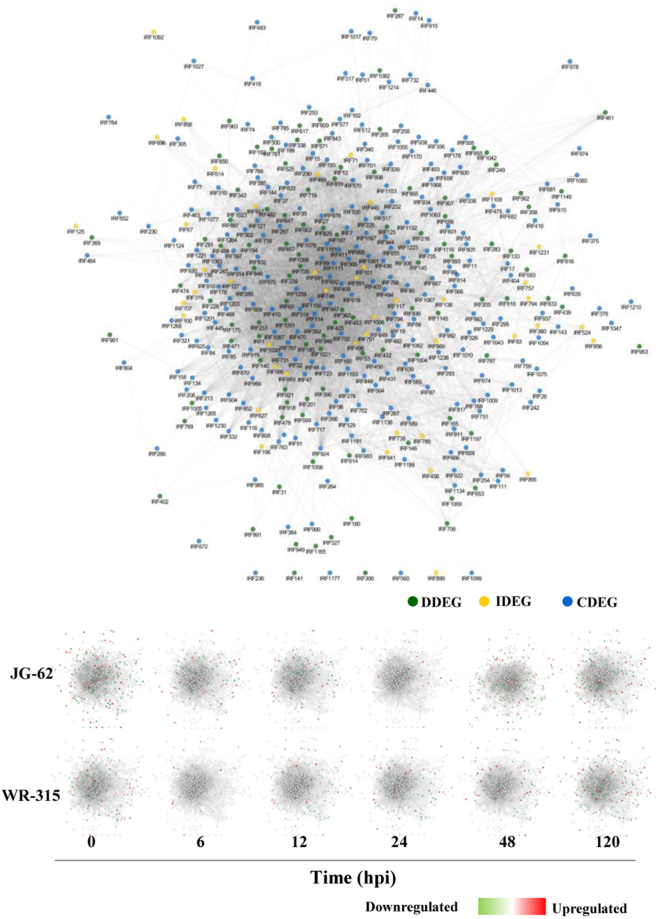
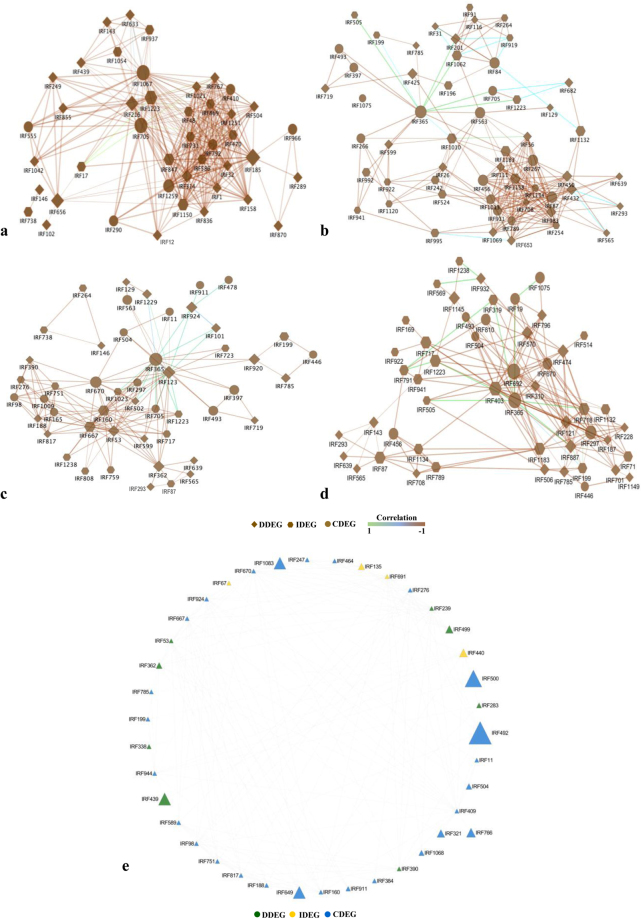
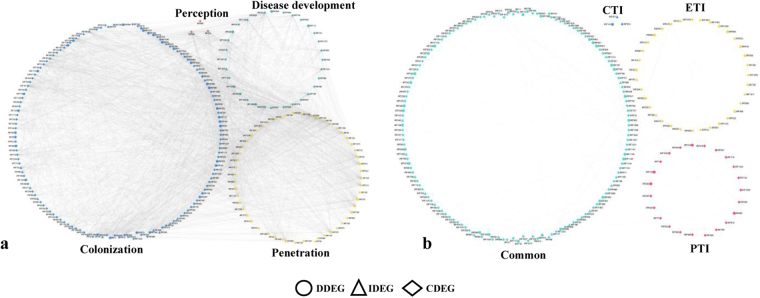
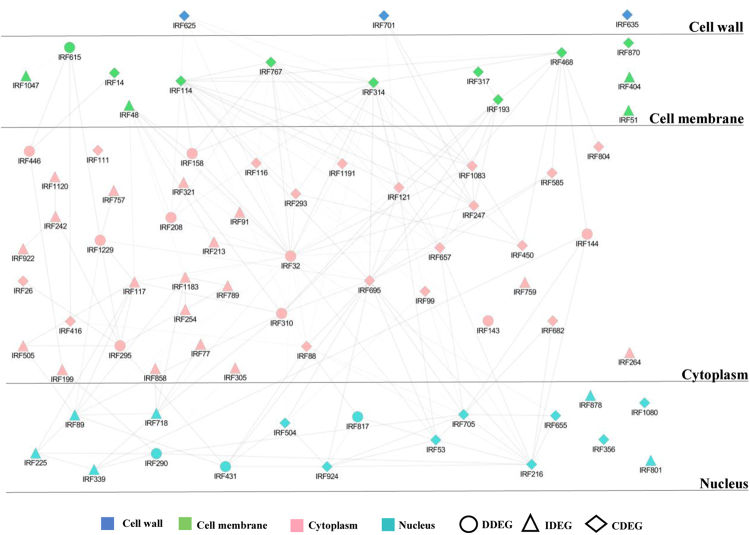
Host specific resistance and non-host resistance are two plant immune responses to counter pathogen invasion. Gene network organizing principles leading to quantitative differences in resistant and susceptible host during host specific resistance are poorly understood. Vascular wilt caused by root pathogen Fusarium species is complex and governed by host specific resistance in crop plants, including chickpea. Here, we temporally profiled two contrasting chickpea genotypes in disease and immune state to better understand gene expression switches in host specific resistance. Integrative gene-regulatory network elucidated tangible insight into interaction coordinators leading to pathway determination governing distinct (disease or immune) phenotypes. Global network analysis identified five major hubs with 389 co-regulated genes. Functional enrichment revealed immunome containing three subnetworks involving CTI, PTI and ETI and wilt diseasome encompassing four subnetworks highlighting pathogen perception, penetration, colonization and disease establishment. These subnetworks likely represent key components that coordinate various biological processes favouring defence or disease. Furthermore, we identified core 76 disease/immunity related genes through subcellular analysis. Our regularized network with robust statistical assessment captured known and unexpected gene interaction, candidate novel regulators as future biomarkers and first time showed system-wide quantitative architecture corresponding to genotypic characteristics in wilt landscape.


Conflict of interest statement

The authors declare no competing interests.

Figures

Figure 1
Figure 1
Physiological and biochemical analysis of chickpea varieties in response to Fusarium attack. (a) percent RWC, (b) endogenous free proline content, (c) estimation of electrolyte leakage, (d) MDA levels, (e,f,g) measurement of photosynthetic pigments chlorophyll A, chlorophyll B and chlorophyll C, respectively, (h) total protein, (i) relative quantification of fungal biomass by real-time PCR on DNA extracted from F. oxysporum-infected roots of JG-62 and WR-315 at 6, 12, 24, 48 and 120 hpi. Amplification values for FoGDP were normalized to the abundance of chickpea 18S sequence. Each replicate is a pool of five plants of three independent experiments with three biological replicates. Lines and vertical bars denotes the mean values ± SE. Expression changes were analyzed by ANOVA and Tukey post-hoc test (p < 0.05) and vertical bars indicate SE. “*” indicates statistical significance of relative amount of fungal DNA.
Figure 2
Figure 2
Gene expression pattern of DEGs and qRT-PCR analysis. (a) regulation of DEGs for JG-62 (wilt susceptible) and WR-315 (wilt resistant) genotypes of chickpea over the time course after inoculation with Fusarium, (b) venn diagram depicting exclusive and overlapping DEGs. (c,d,e) venn diagram representing regulation of IDEGs, DDEGs and CDEGs. (f) relative mRNA levels of eight candidate DEGs involving PR10, pectinesterase (PE), uncharacterized protein, aquaporin, cystatin, DnaJ, PR5, ERF5 were assessed by qRT-PCR. Statistical significance of expression changes were analyzed by ANOVA and indicated by * for p < 0.05 (Tukey post-hoc test). Vertical bars denote SE.
Figure 3
Figure 3
Investigation of identified DEGs. (a) PCA of the data set shows that the expression profiles of all 12 conditions are different from each other. X-axis and y-axis denotes principal component 1 (PC1) and principal component 2 (PC2), respectively. Number refers to IDs depicted in Supplementary Table S1. (b) Heat map of DEGs between two genotypes. Significant differences (p < 0.05) were estimated using two-way ANOVA.
Figure 4
Figure 4
Functional enrichment of the DEGs. Distribution of transcripts based on Blast2GO analyses. Y-axis indicates significant Blast2GO functional categories (p < 0.05) and the X-axis shows number of transcripts.
Figure 5
Figure 5
Gene network analysis. Network was constructed using gene expression data of 12 conditions from susceptible and resistant genotypes. Changes in expression profiles at different time points from two genotypes were captured in co-expression network. Each node represents a given protein associated with an EST (based on top BLAST hit against SwissProt) and an edge denotes a probability of two given proteins (nodes) potentially interacting based on the cytoprophet algorithm.
Figure 6
Figure 6
Gene sub-networks associated with pathostress and mapping transcription factor network. (a) cell organization and biogenesis, (b) transcription, and translation regulation, (c) signal transduction, (d) nucleic acid processing, cell cycle replication and metabolism response, (e) transcription factor network. Nodes and edges represent genes and coexpression between genes, respectively.
Figure 7
Figure 7
Modular network of wilt diseaseome and immunome. (a) wilt diseasome segregated into perception, penetration, colonization and disease development. (b) immunome assembled from gene expression data in correlation network framework segregated into four hubs encompassing PTI, ETI and CTI. Nodes and edges denote genes and interactions between genes, respectively.
Figure 8
Figure 8
Subcellular layers illustrating the PPI sub-network. Layered PPI network assembled from microarray data was separated into four cellular organelles. Degree of connectivity is mentioned in Supplementary Table S7.

Similar articles

Cited by

References

    1. Jones JD, Dangl JL. The plant immune system. Nature. 2006;16:323–329. doi: 10.1038/nature05286. - DOI - PubMed
    1. Katagiri F, Tsuda K. Understanding the plant immune system. Mol. Plant Microbe Interact. 2010;23:1531–1536. doi: 10.1094/MPMI-04-10-0099. - DOI - PubMed
    1. Navarro L, et al. The transcriptional innate immune response to flg22 Interplay and overlap with Avr gene-dependent defense responses and bacterial pathogenesis. Plant Physiol. 2004;135:1113–1128. doi: 10.1104/pp.103.036749. - DOI - PMC - PubMed
    1. Bozsó Z, et al. Transcriptome analysis of bacterially induced basal and hypersensitive response of Medicago truncatula. Plant Mol. Biol. 2009;70:627–646. doi: 10.1007/s11103-009-9496-8. - DOI - PubMed
    1. Tsuda K, Sato M, Stoddard T, Glazebrook J, Katagiri F. Network Properties of Robust Immunity in Plants. PLoS Genet. 2009;5:e1000772. doi: 10.1371/journal.pgen.1000772. - DOI - PMC - PubMed

Publication types

MeSH terms

LinkOut - more resources