. 2018 Apr 25;9(1):1661.
doi: 10.1038/s41467-018-03766-z.

Characterization of the enhancer and promoter landscape of inflammatory bowel disease from human colon biopsies

Affiliations

Characterization of the enhancer and promoter landscape of inflammatory bowel disease from human colon biopsies

Mette Boyd et al. Nat Commun. .

Abstract

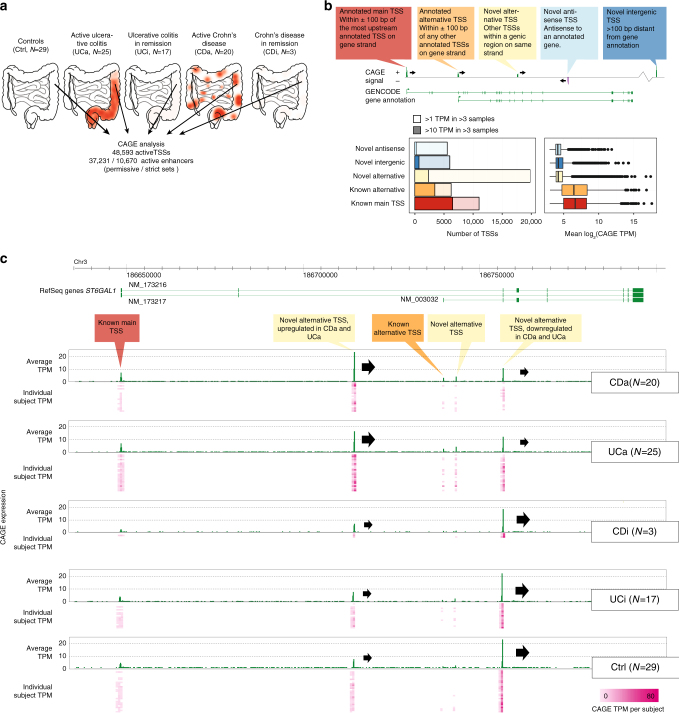
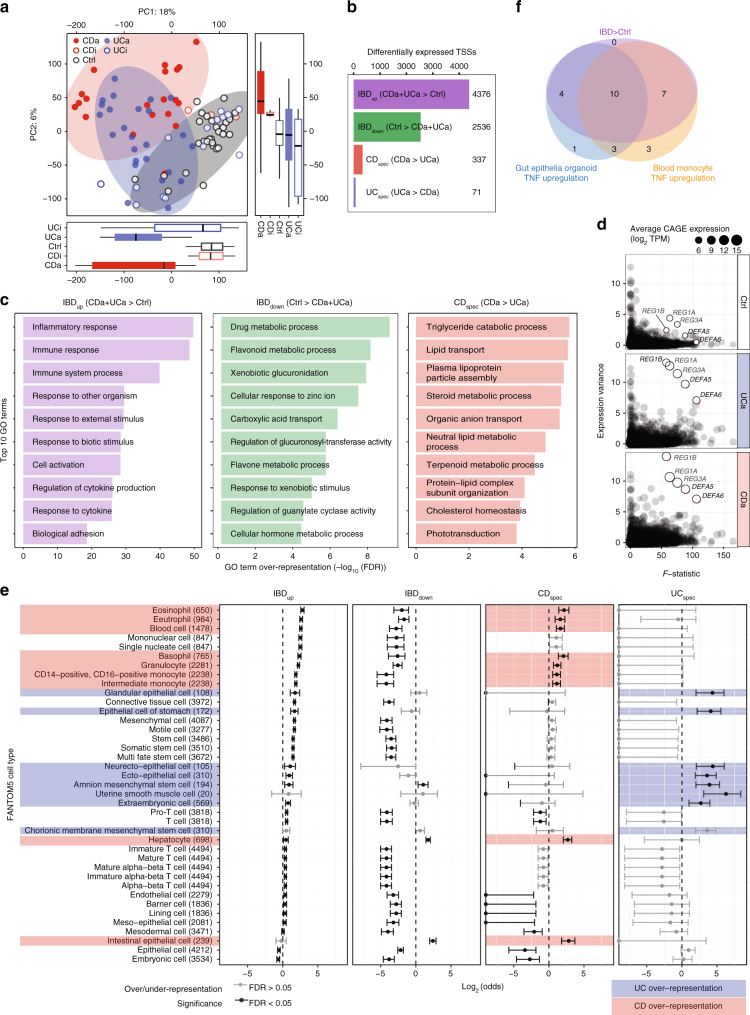
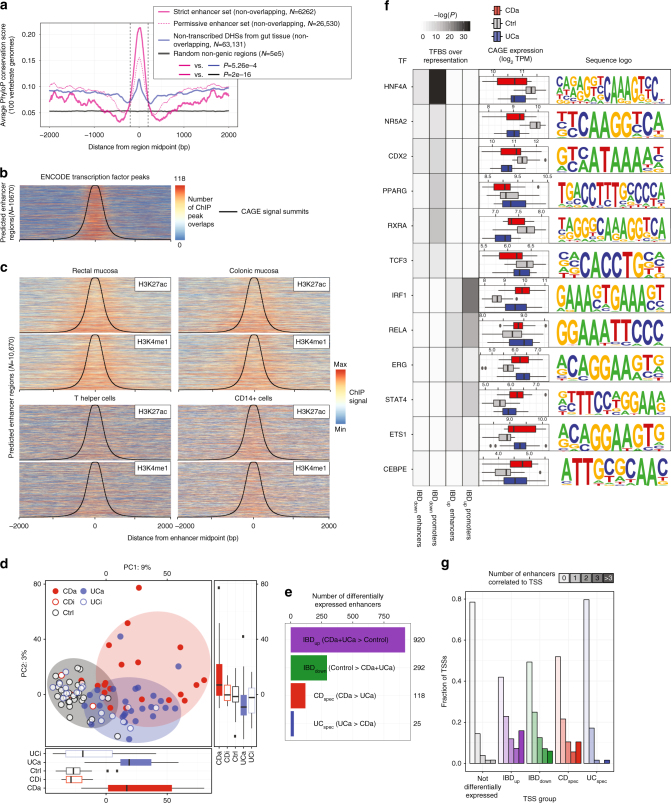
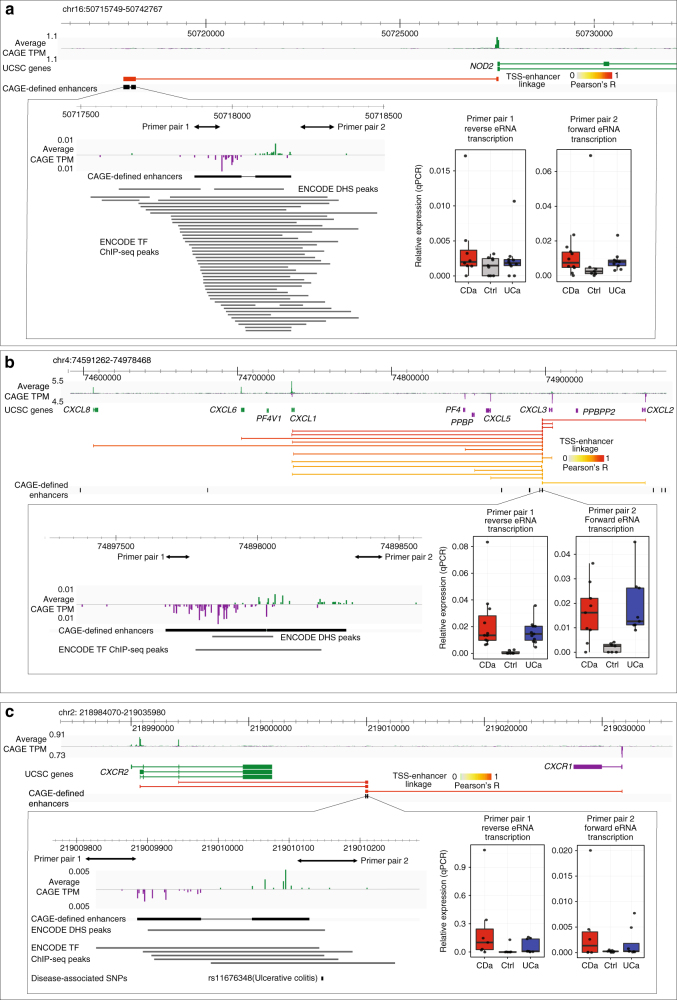
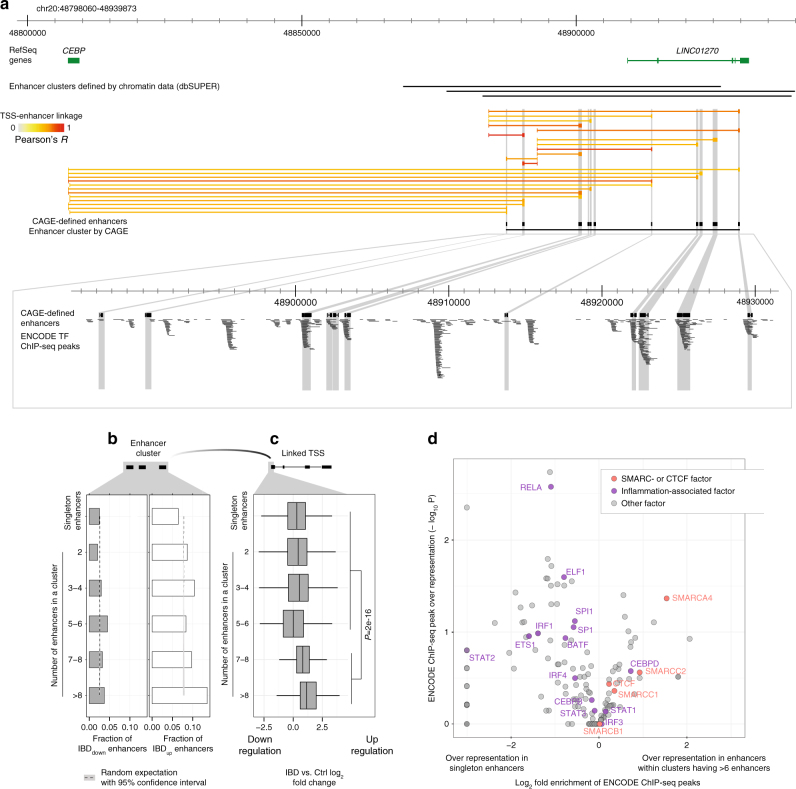
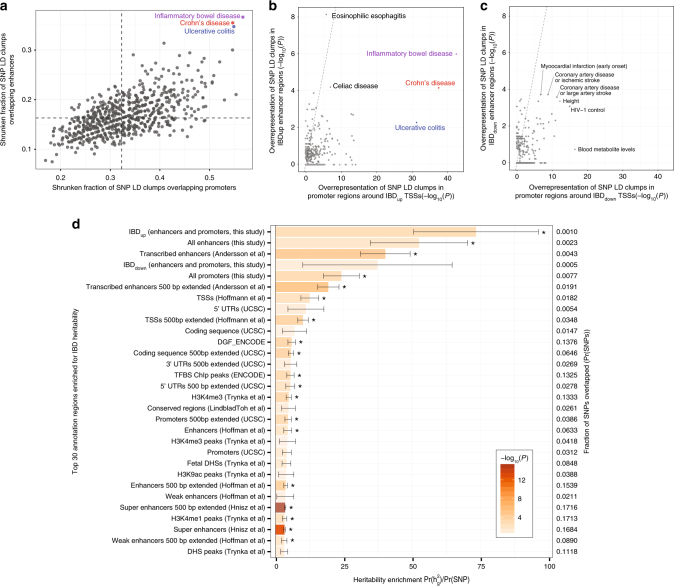
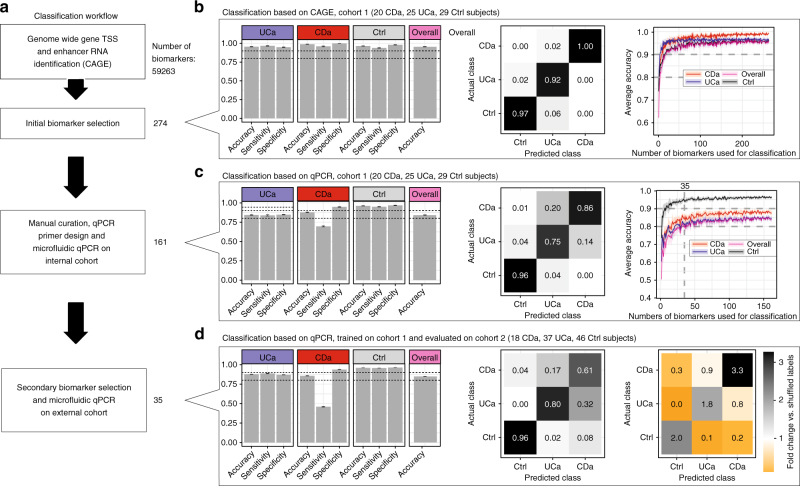
Inflammatory bowel disease (IBD) is a chronic intestinal disorder, with two main types: Crohn's disease (CD) and ulcerative colitis (UC), whose molecular pathology is not well understood. The majority of IBD-associated SNPs are located in non-coding regions and are hard to characterize since regulatory regions in IBD are not known. Here we profile transcription start sites (TSSs) and enhancers in the descending colon of 94 IBD patients and controls. IBD-upregulated promoters and enhancers are highly enriched for IBD-associated SNPs and are bound by the same transcription factors. IBD-specific TSSs are associated to genes with roles in both inflammatory cascades and gut epithelia while TSSs distinguishing UC and CD are associated to gut epithelia functions. We find that as few as 35 TSSs can distinguish active CD, UC, and controls with 85% accuracy in an independent cohort. Our data constitute a foundation for understanding the molecular pathology, gene regulation, and genetics of IBD.


Conflict of interest statement

The authors A.S., M.B., J.B., M.V., M.T., K.V.S., O.H.N. and J.B. have filed a patent for the method for classifying CD/UC vs. control based on qPCR, based on this study. The remaining authors declare no competing interests.

Figures

Fig. 1
Fig. 1
Defining the TSS landscape of IBD. a Overview of data set. Pinch biopsies from the descending colon were taken from 94 human subjects, classified into active ulcerative colitis (UCa), active Crohn’s disease (CDa), UC and CD patients in remission (UCi, CDi) and controls (Ctrl: subjects screened for IBD where all subsequent investigations turned out normal). For each biopsy, a CAGE library was produced, resulting in the detection of TSSs and enhancer regions. Schematics show the typical inflammatory patterns in the intestinal system, the approximate location of biopsy sampling and number of subjects in each group. b Detection and annotation of gene TSSs. Top panel shows an example gene with CAGE-defined TSSs, which are annotated as main, alternative or novel TSSs defined by their overlap with GENCODE gene annotation as indicated in callouts. CAGE-defined TSSs not falling into any of the categories were defined as novel intergenic TSSs. Left bottom panel shows the number of detected TSSs in each category (colors correspond to callouts in top panel), split by CAGE expression strength measured as tags per million (TPM). Right bottom panel shows the expression distribution of each category of TSSs as boxplots. c Genome-browser example of the detection of annotated and novel TSSs in the ST6GAL1 gene. From top to bottom, the browser plot shows the genomic location investigated, RefSeq gene annotation (exons are denoted as boxes, green indicate forward strand transcription). Below, CAGE TPM expression on the forward strand is shown as average across subjects (green bars) and for individuals (pink heat map, each row is one subject, columns are widened 5× for readability), split by subject group. Annotated and novel TSSs, annotated as in b are highlighted. Note that the first novel alternative TSS is upregulated in CDa and UCa vs. remaining groups, while the last novel alternative TSS has the opposite pattern (block arrows indicate TSSs and their overall strength in each subject group for these two TSSs). Conversely, the annotated TSSs are detected but not substantially changing between groups
Fig. 2
Fig. 2
Differential expression of TSSs and genes in IBD. a Principal component analysis (PCA) based on CAGE TSS regions. X- and Y-axes show principal components (PCs) 1 and 2, percent of variance explained is indicated. Dots correspond to subjects, colored by group. Boxplots at the bottom and right show the distribution of PC. Circles show three major groups: CDa, UCa, and non-inflamed samples (UCi, CDi, and Ctrl). b Number of differentially expressed TSSs. Bar plot shows the number of differentially expressed TSSs in the four defined groups. c Gene ontology (GO) term overrepresentation analysis of differentially expressed genes. X-axis shows GO term overrepresentation FDR values on −log10 scale for differentially expressed genes in the IBDup, IBDdown, and CDspec sets. Y-axis shows the top 10 GO terms, ordered by FDR. d Identification of IBD-upregulated genes with extreme variance across IBD patients. Y-axis shows the variance of CAGE expression across CDa, UCa, and Ctrl subjects. X-axis shows the F-statistic from edgeR. Dots correspond to genes, where size indicates the average CAGE expression in respective group. Five outliers are highlighted, corresponding to antibacterial peptides. e FANTOM5 cell type enrichment of differentially expressed TSSs. Differentially expressed TSS sets were analyzed for overlap with TSSs specifically expressed in cell types in FANTOM5. X-axis shows under/over-representation of a given cell type expressed as log2(odds). Whiskers indicate 95% confidence intervals. Whiskers with black lines indicate statistical significance (Fisher’s exact test, FDR < 0.05). Cell types are ordered by their log-odds ratio in IBDup. Numbers in parentheses indicate the number of IBD-expressed TSSs specifically expressed in respective cell type in FANTOM5. Red shading shows cell types only enriched in CDspec TSSs, blue indicates cell types only enriched in UCspec TSSs. f Correspondence of TSSs upregulated in IBD with TSSs upregulated after TNF stimulation in epithelial organoids and blood monocytes. Venn diagram shows the number of TSSs (out of 36) upregulated in IBD (UCa or CDa vs. Ctrl), upregulated after TNF stimulation in gut epithelia organoids or blood monocytes, measured by qPCR. Upregulation after 4 and 24 h of TNF stimulation are pooled; see Supplementary Fig. 3c for time-specific measurements
Fig. 3
Fig. 3
Discovery and characterization of enhancer activity in IBD a. Conservation analysis of enhancer regions. X-axis shows the distance from the center of regions. Y-axis shows average PhyloP100 vertebrate conservation score for strict and permissive enhancer sets, non-transcribed DHSs from gut and random non-genic regions. P-values indicate Mann–Whitney U tests between conservation scores in the ±200 bp region (dashed lines). Number of regions in each set are shown (overlapping regions were discarded). b Transcription factor binding enrichment within CAGE-defined enhancer regions. Heat map rows correspond to the 10,670 enhancer predictions, sorted by distance between bidirectional CAGE peaks. X-axis corresponds to the ±2000 bp region centered on enhancer midpoints. CAGE peak summits are shown as black lines. Color intensity corresponds to number of ENCODE transcription factor ChIP-seq peaks (all ENCODE cells) overlapping a given region. c H3K27ac and H3K4me1 ChIP-seq enrichment within enhancer regions identified by CAGE in gut biopsies. Heat maps are constructed as in b, but show ChIP-seq signal from H3K27ac and H3K4me1 from rectal/colonic mucosa, T helper and CD14+ cells. Colors are assigned based on observed min and max ChIP-seq intensity values within each heatmap. d Principal component analysis based on CAGE expression within enhancer regions. Plot is organized as Fig. 2a. e Number of differentially expressed enhancers. Bar plot shows the number of differentially expressed enhancers per group, organized as Fig. 2b. f Predicted transcription factor site enrichment in enhancer and TSS regions. Each row shows data related to one transcription factor. Left panel shows site enrichment P value in respective groups of differentially expressed enhancers or promoters for the sites corresponding to the relevant motif, as indicated by color scale. Middle panel shows the CAGE expression as log2 TPM for the transcription factor across groups as boxplots. Right panel shows motif sequence logo. g Linkage between enhancer and TSS through co-expression. Y-axis shows the fraction of CAGE TSSs that can be linked to enhancers within 500 kb through co-expression correlation, split by how many enhancers each TSS is linked to. X-axis shows sets of TSSs split by their differential expression as in Fig. 2b
Fig. 4
Fig. 4
Examples of IBD-upregulated enhancers and linked TSS and genes. Each larger panel shows: genome browser with the average CAGE expression in TPM on both strands, UCSC gene models, TSS-enhancer-linkage through expression correlations (Pearson correlation coefficients are indicated by color, only positive correlations are shown) and CAGE-defined enhancers (black). Green indicates data on forward strand, purple on the reverse strand. Left part of lower panel shows a zoom-in of the enhancer region, with CAGE signal intensity as above, ENCODE DHS peaks and TF ChIP-seq peaks,. ChIP-seq peaks are labeled with cognate TF name. Primer locations for qPCR analysis are indicated as double arrows. Right lower panel shows corresponding qPCR analysis of eRNA expression in CDa, UCa and Ctrl samples on both strands as boxplots, relative to the PIAS4 reference gene. a An enhancer upstream of the NOD2 TSS. An enhancer region was detected upstream of the TSS of NOD2, a key gene in IBD pathogenesis with strong support from ENCODE cell line data. b An enhancer in the CXCL1-3,5,6,8 cytokine cluster. Several enhancer regions within a cluster of chemokine genes (CXCL1-3, CXCL5-6, and CXCL8, all upregulated in IBD) were detected. The analysis is focused on a single enhancer linked to the above gene TSSs (for ease of visualization, only links between this enhancer and TSSs are shown). c An enhancer between CXCR1 and CXCR2. An enhancer between CXCR1 and CXCR2 (receptors for the cytokines in panel b) was detected. This enhancer overlapped multiple ENCODE TF ChIP-seq peaks, and the UC-associated rs11676348 SNP. Note the two alternative TSSs for CXCR2. In the lower panel, a track with disease-associated SNPs is shown
Fig. 5
Fig. 5
Characterization of enhancer clusters in IBD. a Example of an enhancer cluster in the CEBPB locus. Genome browser screenshot of the CEBPB locus, organized as in a but also showing chromatin-defined enhancer clusters from dbSUPER, and a CAGE derived enhancer cluster located ~150 kb downstream of CEBPB. Because CEBPB has two nearby alternative TSSs with similar activity, most enhancers are linked to both. Lower panel shows a zoom-in of the enhancer cluster where ENCODE transcription factor ChIP-seq peaks are displayed: each black line corresponds to one ChIP-seq peak. b Relation between enhancer IBD-up/downregulation and number of enhancers within an enhancer cluster. Bar plot shows the fraction of enhancers that are significantly downregulated (IBDdown, gray) or upregulated (IBDup, white) in UCa and CDa vs. Ctrl, grouped by the number of enhancers within an enhancer cluster. Enhancers not part of clusters are included for comparisons (singleton enhancers). The expected overlap by chance for each bar is indicated as dotted lines, with 95% confidence intervals. c Relation between the number of enhancers within an enhancer cluster and IBD upregulation of linked TSSs. Boxplots show the distribution of IBD vs. Ctrl log2 fold changes of TSSs linked to singleton enhancers or enhancer clusters as in b. TSSs are grouped by how many enhancers the linked enhancer cluster contains. d Overrepresentation of ENCODE TF ChIP-seq peaks in singleton enhancers vs. enhancer clusters with >6 members linked to IBD-upregulated TSSs. X-axis shows the log2 fold change in ENCODE ChIP-seq peak over-representation in single enhancers vs. enhancers within enhancer clusters having >6 enhancers, where 0 indicates no difference between sets. Only enhancers linked to IBDup TSSs are analyzed. Y-axis shows the associated over-representation P-value. Each dot corresponds to one type of ChIP-seq peak, colored by whether they are annotated as inflammation-associated factors (purple), SMARC- or CTCF factors (orange), or other factors (gray). Factors of interest are highlighted
Fig. 6
Fig. 6
Relation between IBD-associated SNPS and IBD-induced regulatory regions. a Overlap of GWAS catalog diseases and traits with identified TSSs and enhancers. Y-axis shows the fraction of SNP LD-clumps associated to each GWAS catalog disease/trait that overlaps enhancer regions identified in this study. X-axis shows the same statistic for promoter regions, defined from CAGE TSSs identified in this study. Fractions are shrunk towards the mean across all diseases/traits (dashed lines) using empirical Bayes. LD clumps associated to CD, UC, and IBD show the highest degree of overlap with both promoter and enhancer sets. b Enrichment of IBDup promoters and enhancers for GWAS catalog diseases/traits. Y-axis shows the overrepresentation of LD-clumps linked to GWAS catalog diseases/traits in IBDup enhancers vs. all enhancers expressed as Fisher’s Exact test P values. X-axis shows the same statistic for promoter regions corresponding to IBDup TSS vs. all TSSs. Each dot represents one GWAS catalog disease/trait. UC, CD, and IBD are the only shared enrichments between the two sets. c Enrichment of GWAS catalog diseases and traits for IBDdown promoters and enhancers. Plot is organized as in b, but showing LD-clump enrichment of IBDdown enhancers (Y-axis) and promoters corresponding to IBDdown TSSs (X-axis). d Partitioned heritability of IBD for different classes of genomic regions. Bar plots show the heritability enrichment of IBD, as estimated by stratified LD-score regression for each category, expressed as Prhg2PrSNPs in the respective regions. Whiskers show jackknife standard errors of the heritability enrichment. Y-axis shows the top enriched genome regions, defined in ref. , supplemented by regions defined in this study as indicated, sorted by enrichment score. Bar color indicates significance of enrichment in log10 scale; asterisks indicate FDR < 0.05. Percentages to the right indicate the fraction of the genome covered by each set of regions PrSNPs
Fig. 7
Fig. 7
Classification of UC, CD, and controls. a Overview of analyses. Starting from all TSSs and enhancers (referred to as biomarkers, N = 59,263) in cohort 1, we performed an initial feature selection using an ensemble approach, resulting in 274 features. We designed successful qPCR primer pairs for 161 biomarkers and applied microfluidic qPCR analysis to the same samples. A secondary feature selection process was used to reduce the set of biomarkers to 35. We analyzed the expression of these biomarkers in an independent validation cohort (cohort 2) using microfluidic qPCR. Classification analysis was performed at each step (panels bd). b Prediction of UCa/CDa/Ctrl diagnosis labels based on CAGE expression. CAGE expression data from cohort 1 from 274 selected biomarkers were used to train and evaluate a Random Forest model based on five-fold cross-validation 1000 times. Left panel: average accuracy, sensitivity, and specificity are shown for each subject group as bar plots along with overall accuracy. Error bars show 95% confidence intervals across cross-validations. Dotted lines indicate 0.8 and 0.9. Middle panel: confusion matrix showing average fractions of predictions that fall into each of the actual subject groups (columns add to 100%). Right panel: average prediction accuracy (Y-axis) as a function of number of biomarkers used for training (X-axis). Shaded areas indicate 95% confidence intervals across cross-validations. c Prediction of UCa/CDa/Ctrl diagnosis labels based on microfluidic qPCR expression. Plots are organized as in panel b, but based on microfluidic qPCR expression data from cohort 1 using 161 primers corresponding to selected biomarkers. d Validation using an independent cohort feature reduction based on the data in panel c resulted in the selection of 35 features. We trained a Random Forest model on microfluidic qPCR data from these biomarkers from cohort 1 and evaluated it on corresponding data from an independent cohort (cohort 2). Left and middle panels show classification results, as in panel b. Right panel shows a comparison between the confusion matrix (as in panel b) of our predictions and the confusion matrix obtained by repeating the analysis with randomly shuffled training labels. Numbers indicate the average fold changes of fractions (actual vs. shuffled)

References

    1. Bojesen RD, Riis LB, Høgdall E, Nielsen OH, Jess T. Inflammatory bowel disease and small bowel cancer risk, clinical characteristics, and histopathology: a population-based study. Clin. Gastroenterol. Hepatol. 2017;15:1900–1907.e2. doi: 10.1016/j.cgh.2017.06.051. - DOI - PubMed
    1. Ungero R, Mehandru S, Allen PB, Peyrin-Biroulet L, Columbel J. Ulcerative colitis. Lancet. 2016;369:1756–1770. - PMC - PubMed
    1. Torres J, Mehandru S, Colombel JF, Peyrin-Biroulet L. Crohn’s disease. Lancet. 2016;389:1741–1755. doi: 10.1016/S0140-6736(16)31711-1. - DOI - PubMed
    1. Ng SC, et al. Worldwide incidence and prevalence of inflammatory bowel disease in the 21st century: a systematic review of population-based studies. Lancet. 2017;390:2769–2778. doi: 10.1016/S0140-6736(17)32448-0. - DOI - PubMed
    1. Burisch J, Jess T, Martinato M, Lakatos PL. The burden of inflammatory bowel disease in Europe. J. Crohn’s Colitis. 2013;7:322–337. doi: 10.1016/j.crohns.2013.01.010. - DOI - PubMed

Publication types

MeSH terms