. 2018 Apr 25;9(1):1655.
doi: 10.1038/s41467-018-03812-w.

Uncovering inherent cellular plasticity of multiciliated ependyma leading to ventricular wall transformation and hydrocephalus

Affiliations

Uncovering inherent cellular plasticity of multiciliated ependyma leading to ventricular wall transformation and hydrocephalus

Khadar Abdi et al. Nat Commun. .

Abstract

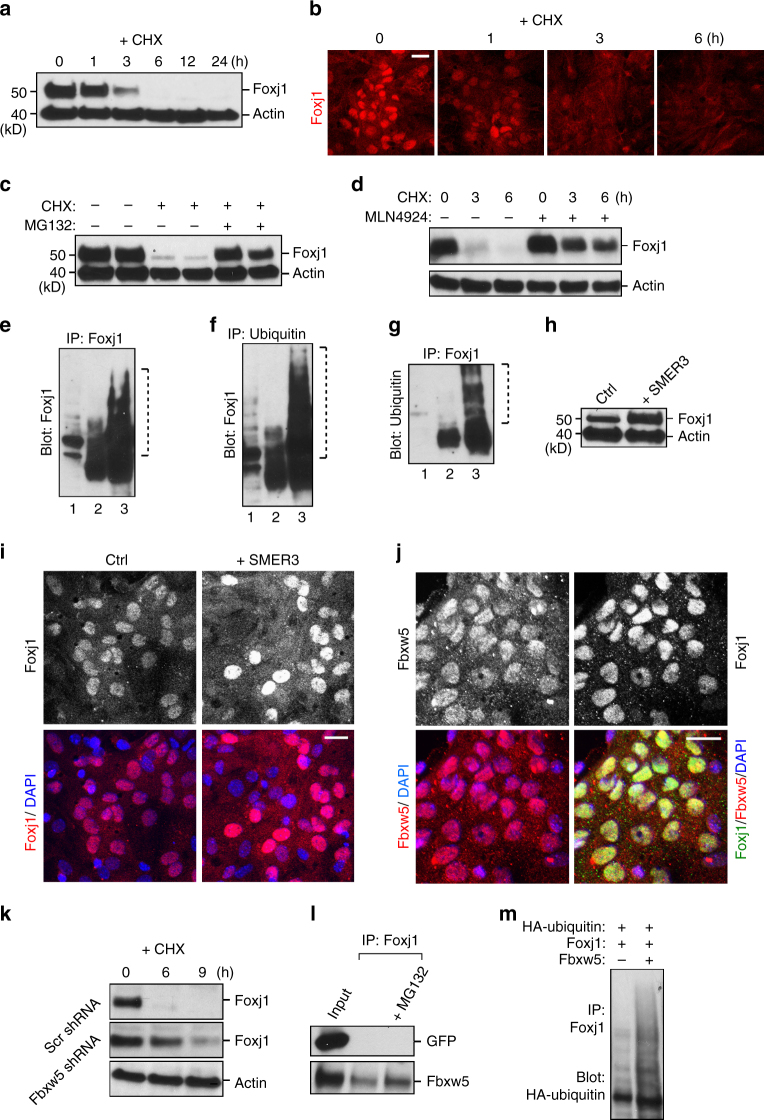
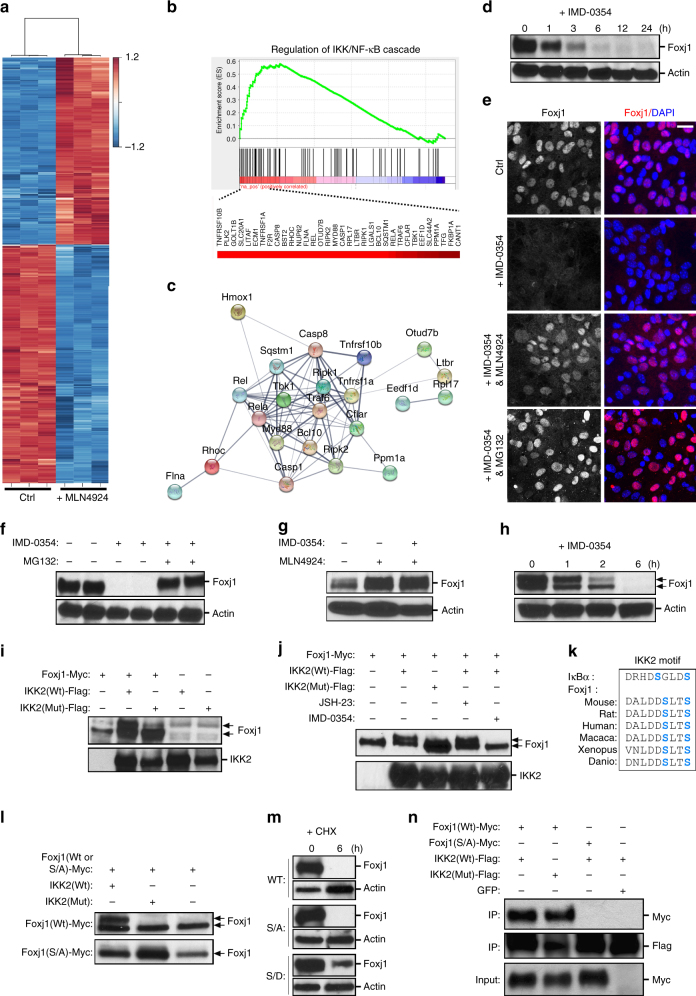
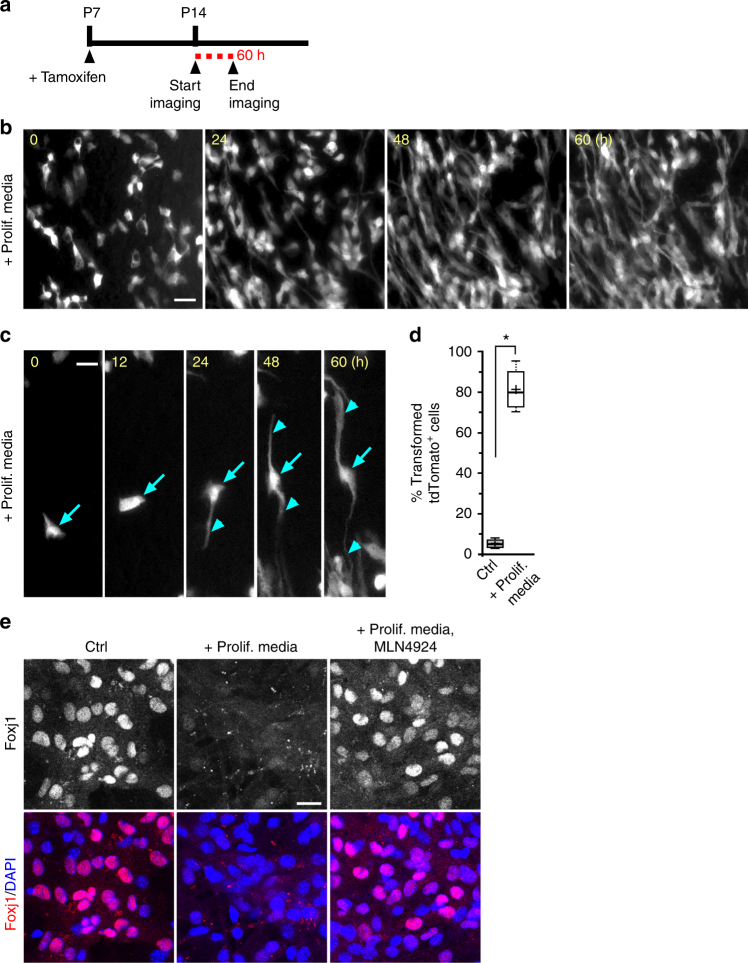
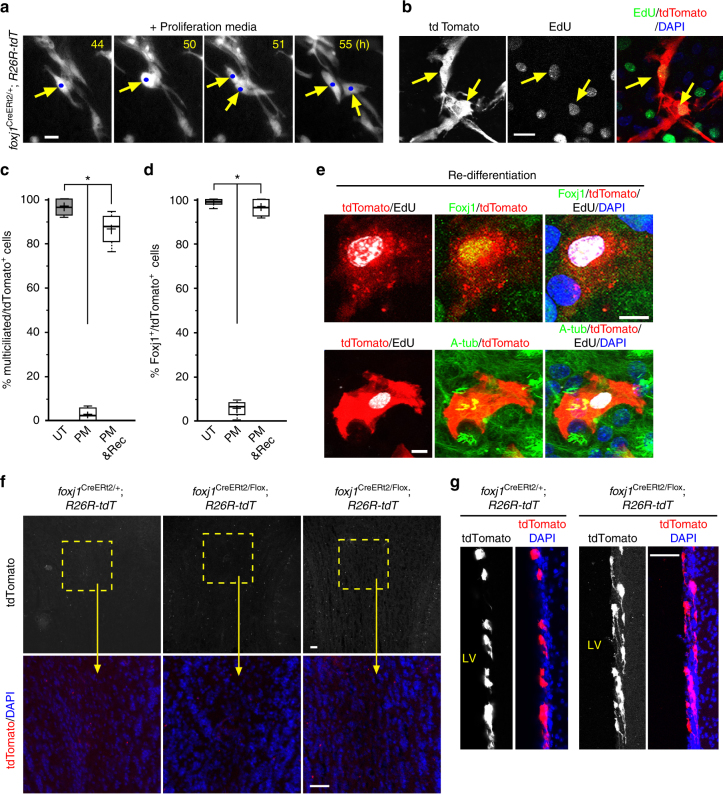
Specialized, differentiated cells often perform unique tasks that require them to maintain a stable phenotype. Multiciliated ependymal cells (ECs) are unique glial cells lining the brain ventricles, important for cerebral spinal fluid circulation. While functional ECs are needed to prevent hydrocephalus, they have also been reported to generate new neurons: whether ECs represent a stable cellular population remains unclear. Via a chemical screen we found that mature ECs are inherently plastic, with their multiciliated state needing constant maintenance by the Foxj1 transcription factor, which paradoxically is rapidly turned over by the ubiquitin-proteasome system leading to cellular de-differentiation. Mechanistic analyses revealed a novel NF-κB-independent IKK2 activity stabilizing Foxj1 in mature ECs, and we found that known IKK2 inhibitors including viruses and growth factors robustly induced Foxj1 degradation, EC de-differentiation, and hydrocephalus. Although mature ECs upon de-differentiation can divide and regenerate multiciliated ECs, we did not detect evidence supporting EC's neurogenic potential.


Conflict of interest statement

The authors declare no competing interests.

Figures

Fig. 1
Fig. 1
Effects of MLN4924 on ependymal Foxj1 transcription factor expression. a Representative IHC staining of control (Ctrl) and MLN4924-treated primary EC cultures, labeled with acetylated tubulin (A-tub) antibody and DAPI. Scale bar: 50 µm. b Quantification of multiciliated cell numbers as a fraction of DAPI+ nuclei. *P < 0.008, Wilcoxon two-sample test, n = 5, z = 1.107. c Representative IHC staining from Ctrl and MLN4924-treated primary EC cultures, labeled with Foxj1 antibody and DAPI. Scale bar: 30 µm. d Quantification of number of Foxj1+ cells as a fraction of DAPI nuclei in untreated and MLN4924-treated primary EC cultures. *P < 0.008, Wilcoxon two-sample test, n = 5, z = 1.331. e IHC staining of differentiated primary EC cultures without (Ctrl) or with MLN4924 treatment for 12 h, labeled with Foxj1 antibody and DAPI. Note the increase in relative fluorescence intensity for Foxj1 in MLN4924-treated cultures. Scale bar: 20 µm. f Western blot analysis showing relative Foxj1 protein levels from primary EC cultures without (Ctrl) or with MLN4924 treatment for 12 h. Actin is used as protein loading control. g Quantification of relative amounts of Foxj1 protein from western blot analyses in f. *P < 0.03, Wilcoxon two-sample test, n = 4, z = 1.316. h IHC staining of fixed ependymal wholemounts from P28 animal without (Ctrl) or with MLN4924 treatment for 6 h, labeled with Foxj1 and DAPI. Scale bar: 10 µm. i Quantification of cell numbers with indicated Foxj1 IHC fluorescence intensities, presented as histogram comparing untreated (blue) vs. 24 h MLN4924 treatment (orange). Dashed lines represent Gaussian fit distribution curve. *P < 0.0001, unpaired Student’s t test, n = 172 in each group, t171 = 49.780. Box plots show mean (+), median (−), quartiles (boxes), range (whiskers)
Fig. 2
Fig. 2
Ependymal Foxj1 protein instability and turnover. a, c, d, h, k Western blot (WB) analyses of protein lysates from primary EC cultures. a Foxj1 protein levels before and after treatment with cycloheximide (CHX) for indicated lengths of time. Actin = loading control. b IHC staining of EC cultures treated with CHX for the indicated lengths of time, labeled with Foxj1 antibody. Foxj1 is lost at a similar timescale as observed in WBs. c Foxj1 protein levels in untreated controls, CHX-treated for 3 h, or co-treated with CHX + MG132 for 3 h. Actin = loading control. d Foxj1 protein levels in untreated controls, CHX-treated, or co-treated with CHX + MLN4924 for the indicated lengths of time. Actin = loading control. e Immunoprecipitation (IP) of Foxj1 from EC cultures followed by WB probing for Foxj1 to reveal ubiquitin-induced laddering of Foxj1 protein. Lane 1 = input, lane 2 = IP Foxj1, lane 3 = IP of Foxj1 after MG132 treatment for 6 h. f IP of ubiquitin from EC cultures followed by WB probing for Foxj1. Lane 1 = input, lane 2 = IP ubiquitin, lane 3 = IP ubiquitin following MG132 treatment for 6 h. g IP of Foxj1 from EC cultures followed by WB probing for ubiquitin. Lane 1 = input, lane 2 = IP of Foxj1, lane 3 = IP of Foxj1 following MG132 treatment for 6 h. h Cultures treated with DMSO control (Ctrl) or SMER3, probed for Foxj1 and Actin. i Representative IHC staining of primary EC cultures without (Ctrl) or with SMER3 treatment, labeled with Foxj1 antibody and DAPI. Note the increased Foxj1 IHC signal in SMER3-treated EC cultures. j IHC staining of differentiated EC cultures labeled with Fbxw5, Foxj1 antibodies, and DAPI. k Cultures harboring scrambled control (Scr) shRNA or Fbxw5 shRNA, treated with CHX for indicated lengths of time, and probed for Foxj1 and Actin. l IP of Foxj1 from HEK293 cells either co-transfected with GFP and Foxj1-Myc expression constructs, or Fbxw5 and Foxj1-Myc constructs. WBs were probed with GFP or Fbxw5 antibodies. Lane 1 = inputs, Lane 2 = IP of Foxj1, Lane 3 = IP of Foxj1 following 6 h MG132 treatment. m IP of Foxj1 from HEK293 cell lysates following co-transfection with expression constructs as indicated (+), probed with anti-HA antibody to detect HA-ubiquitin. Scale bars: 20 µm
Fig. 3
Fig. 3
Inducible deletion of Foxj1 from mature ECs. a Schematic representation of foxj1CreERt2/+ gene targeting strategy, inserting CreERt2 into ATG site encoding Foxj1. N = NotI, E = EcoRI. Recombined allele was crossed to Rosa26-flp, removing neomycin selection cassette (neo) for proper CreERt2 recombinase expression from foxj1 gene locus. bg All experimental animals were tamoxifen induced at P14, samples harvested at P28. b Representative IHC staining of ependymal wholemount from foxj1CreERt2/+; R26R-tdT animal, labeled with acetylated tubulin (A-tub) and RFP antibodies. Dashed circles indicate multicilia bundles (upper panel) from individual tdTomato+ ECs. Quantification = % of tdTomato+ cells showing multicilia, from four animals. c Representative IHC staining of brain sections from foxj1CreERt2/+; R26R-tdT and foxj1CreERt2/Flox; R26R-tdT animals, labeled with A-tub and RFP antibodies, and DAPI, showing loss of multicilia in lineage-traced Foxj1 mutant tdTomato+ ECs. Quantification = % of tdTomato+ cells containing multicilia. *P < 0.008, Wilcoxon two-sample test, n = 5 mice, z = 1.583. d IHC images of brain sections from foxj1CreERt2/+; R26R-tdT and foxj1CreERt2/Flox; R26R-tdT animals, labeled with GLAST and RFP antibodies, and DAPI. Quantification = % of tdTomato+ ECs that are also GLAST+. *P < 0.008, Wilcoxon two-sample test, n = 5 mice, z = 1.228. e Imaris 3D rendering of tdTomato+ lineage-traced ECs from foxj1CreERt2/+; R26R-tdT and foxj1CreERt2/Flox; R26R-tdT animals, labeled with A-tub and RFP antibodies. XY (upper panels) and XZ (lower panels) views illustrate morphological changes of Foxj1-mutant ECs extending basal processes (arrowheads). f Quantification of e: number of basal processes in tdTomato+ ECs from foxj1CreERt2/+; R26R-tdT (Ctrl) vs. foxj1CreERt2/Flox; R26R-tdT (cKO) animals, performed via Imaris 3D filament tracing. *P < 0.0001, unpaired Student’s test; n = 20, t18 = 6.664. g Imaris 3D rendering of a representative tdTomato+ mutant EC from foxj1CreERt2/Flox; R26R-tdT animal, labeled with CD31 and RFP antibodies. Dashed box = close-up views shown in lower panels, revealing contact between basal process from mutant EC and CD31+ vasculature (arrowheads). Scale bars: 10 µm. Box plots show mean (+), median (−), quartiles (boxes), range (whiskers)
Fig. 4
Fig. 4
IKK function in Foxj1 stability. a Transcriptome heatmap (FDR ≤ 0.05) comparing EC cultures without (Ctrl) or with MLN4924 treatment, Z-score normalized. Samples/genes are clustered by correlation distance with complete linkage. b Gene enrichment plot of IKK/NF-κB cascade identified from gene set enrichment analysis (GSEA), using gene ontology (GO) database. Genes ranked on significance and direction of change (t-statistic). List of genes enriched within pathway (listed beneath) is presented with correlated heatmap varying in color from black to red. c Protein interaction network from identified genes within IKK/NF-κB cascade, using STRING functional protein association network. Connecting line thickness corresponds to network association confidence. d, f, g, m Western blot (WB) analyses of protein lysates from primary EC cultures. d Cultures treated with IMD-0354 for the indicated lengths of times, and probed for Foxj1, Actin (loading control). e Representative IHC staining of primary EC cultures without (Ctrl) or with addition of indicated compounds and combinations for 6 h, labeled with Foxj1 antibody and DAPI. Scale bar: 20 µm. f Cultures treated for 6 h with IMD-0354 alone or IMD-0354 + MG132, and probed for Foxj1, Actin. g Cultures untreated or treated for 6 h with MLN4924 or IMD-0354 + MLN4924, and probed for Foxj1, Actin. h Modified SDS-page gel protocol separating closely migrating molecular weight bands followed by WB for Foxj1, Actin. ECs were treated with IMD-0354 for indicated lengths of time. i, j, l Western blot (WB) analyses of protein lysates from HEK293 cells. i Cultures transfected with indicated expression constructs, and probed with anti-Foxj1 and anti-Flag (IKK2) antibodies. IKK2-Flag levels are used as expression controls. Note the formation of a Foxj1 doublet in the presence of IKK2(Wt) but not the IKK2(Mut) (kinase dead) conditions. j Cultures co-transfected with the indicated expression constructs and drug treatments, probed with anti-Foxj1, anti-Flag (IKK2) antibodies. IKK2-Flag levels = expression controls (lower lane). k IKK2 phosphorylation motif, comparing IκBα, Foxj1 proteins from several species. Alignment of target serines highlighted in blue. l Cultures co-transfected with expression constructs as indicated (+), probed with anti-Foxj1 antibody. m Cultures expressing indicated Foxj1 constructs, probed with anti-Myc antibody. Comparison of cultures untreated vs. treated with CHX for 6 h, showing enhanced stability of S32D/S35D (S/D)-Foxj1-Myc mutant protein (not S/A-Foxj1-Myc). n IP from HEK293 cell lysates co-transfected with expression constructs as indicated (+), probed with Myc(Foxj1) and Flag(IKK2) antibodies. IKK2-Flag and Foxj1-Myc levels are used as expression controls (lower lanes)
Fig. 5
Fig. 5
IKK-inhibiting viral degradation of Foxj1 and CSF/brain barrier disruption. a IHC staining of primary EC cultures without (Ctrl) or with indicated treatment conditions, labeled with Foxj1 and VP16 antibodies, and DAPI. Cultures were treated with viruses for 16 h. Quantifications showing Foxj1+ cells per total DAPI nuclei in treatment conditions as percentage of Ctrl condition in each experiment (read dashed line). * P < 0.03, Wilcoxon two-sample test, n = 4, z = 1.225. Scale bar: 15 µm. b IHC staining of ependymal wholemounts from P28 FOXJ1-GFP animals injected with PBS (Ctrl, left panels) or HSV-1 (right panels), labeled with GFP and acetylated tubulin (A-tub) antibodies. Samples were harvested 3 days after injection. Note the large GFP+ ependymal gaps in HSV-1 injected condition, showing ventricular wall breakdown exposing underlying brain parenchyma (A-tub+ cellular patches). Scale bar: 50 µm. c Representative IHC staining of ependymal wholemounts from P28 animals treated with PBS (Ctrl), HSV-1, or HSV-1 + MLN4924, labeled with VP16 antibody showing infected areas (VP16+). Samples were harvested 2 days after treatments. Scale bar: 50 µm. d DAPI IHC staining of ependymal wholemounts, comparing HSV-1 treated or HSV-1 + MLN4924 co-treated conditions. Image stacks represent the top 20 µm from ependymal surface. Dashed lines indicate areas of ventricular disruption where cell patches are absent from the surface. Quantifications represent average number of cellular gaps observed during each condition. * P < 0.0004, Wilcoxon two-sample test, n = 6, z = 1.988. Scale bar: 25 µm. Box plots show mean (+), median (−), quartiles (boxes), range (whiskers)
Fig. 6
Fig. 6
Ex vivo live imaging of mature ependymal cell transformation. a foxj1CreERt2/+; R26R-tdT mice tamoxifen induction and wholemount imaging (dashed red line) schedule. b Representative time-lapsed images from foxj1CreERt2/+; R26R-tdT ependymal wholemount sample cultured in high serum proliferation media (Prolif. media) condition. Note the cellular transformation of tdTomato+ ECs over time. c Representative close-up view of individual tdTomato+ EC in Prolif. media condition, showing morphological transformation over time, with radial glial-like processes (arrowheads) emanating from cell body (arrows). d Quantification of transformed tdTomato+ EC numbers for control (Ctrl) and Prolif. media conditions. *P < 0.0002, unpaired Student’s test, n = 50, t4 = 13.732. e Representative IHC images of untreated (Ctrl) EC cultures; + Prolif. media; or cultured with Prolif. media then treated with MLN4924 for 12 h, labeled with Foxj1 antibody and DAPI. Scale bars: 20 µm. Box plots show mean (+), median (−), quartiles (boxes), range (whiskers)
Fig. 7
Fig. 7
De-differentiation, cell division, and re-differentiation of mature ECs. a Representative time-lapsed images from P14 foxj1CreERt2/+; R26R-tdT ependymal wholemount sample, tamoxifen-induced at P7, cultured in proliferation media for indicated hours. Note the lineage-traced tdTomato+ cell (arrows) undergoing cell division (tracked by blue dots). Scale bar: 20 µm. b IHC staining of ependymal wholemount from P14 foxj1CreERt2/+; R26R-tdT animal, P7 tamoxifen-induced, cultured in proliferation media condition for 72 h, and labeled with RFP, EdU (pulsed at 36 h), and DAPI, showing EdU incorporation in lineage-traced tdTomato+ cells (arrows). Scale bar: 20 µm. c Quantification = % of lineage-traced tdTomato+ cells containing multicilia (marked by A-tub). *P < 0.0001, F2,9 = 15.692 (PM), one-way ANOVA, n= 4 independent cultures in all groups. UT = untreated; PM = proliferation media; Rediff = re-differentiation. Scale bar: 10 µm. d Quantification = % of lineage-traced tdTomato+ cells expressing Foxj1. *P < 0.0001, F2,9 = 12.358 (PM), one-way ANOVA, n= 4 independent cultures in all groups. e Representative IHC staining of mature EC cultures from foxj1CreERt2/+;R26R-tdT animals, tamoxifen induced in vitro, incubated with proliferation media for 4 days then re-differentiated for 10 additional days, labeled with A-tub + RFP antibodies, EdU, DAPI (upper panels) or Foxj1 + RFP antibodies, EdU, DAPI (lower panels), showing EdU+ re-differentiated ECs. Scale bar: 20 µm. f, g Representative IHC images of olfactory bulb (f) or lateral ventricle (LV) wall (g) sections from foxj1CreERt2/+; R26R-tdT or foxj1CreERt2/Flox; R26R-tdT animals, labeled with RFP antibody and DAPI. All animals were induced with tamoxifen in vivo at P14, and harvested: 2 weeks post induction (f, left and middle panels, g); 4 weeks post induction (f, right panels). Areas in dashed boxes enlarged in lower panels (f). Scale bars: 40 µm

References

    1. Del Bigio MR. Ependymal cells: biology and pathology. Acta Neuropathol. 2010;119:55–73. doi: 10.1007/s00401-009-0624-y. - DOI - PubMed
    1. Spassky N, et al. Adult ependymal cells are postmitotic and are derived from radial glial cells during embryogenesis. J. Neurosci. 2005;25:10–18. doi: 10.1523/JNEUROSCI.1108-04.2005. - DOI - PMC - PubMed
    1. Jacquet BV, et al. FoxJ1-dependent gene expression is required for differentiation of radial glia into ependymal cells and a subset of astrocytes in the postnatal brain. Development. 2009;136:4021–4031. doi: 10.1242/dev.041129. - DOI - PMC - PubMed
    1. Paez-Gonzalez P, et al. Ank3-dependent SVZ niche assembly is required for the continued production of new neurons. Neuron. 2011;71:61–75. doi: 10.1016/j.neuron.2011.05.029. - DOI - PMC - PubMed
    1. Tan FE, et al. Myb promotes centriole amplification and later steps of the multiciliogenesis program. Development. 2013;140:4277–4286. doi: 10.1242/dev.094102. - DOI - PMC - PubMed

Publication types

MeSH terms