. 2018 Apr 25;8(1):6531.
doi: 10.1038/s41598-018-24976-x.

Skeletal muscle phosphatidylcholine and phosphatidylethanolamine respond to exercise and influence insulin sensitivity in men

Affiliations

Skeletal muscle phosphatidylcholine and phosphatidylethanolamine respond to exercise and influence insulin sensitivity in men

Sindre Lee et al. Sci Rep. .

Erratum in

Abstract

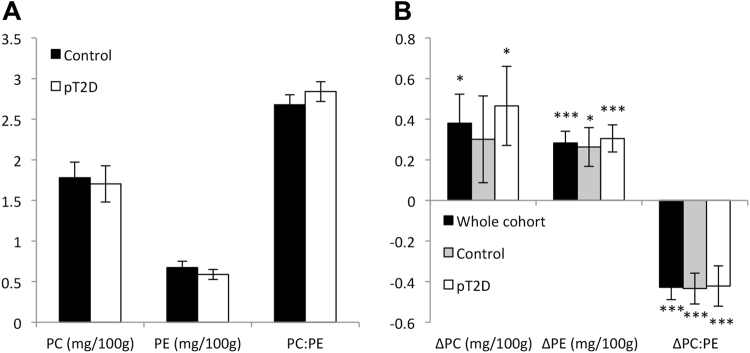
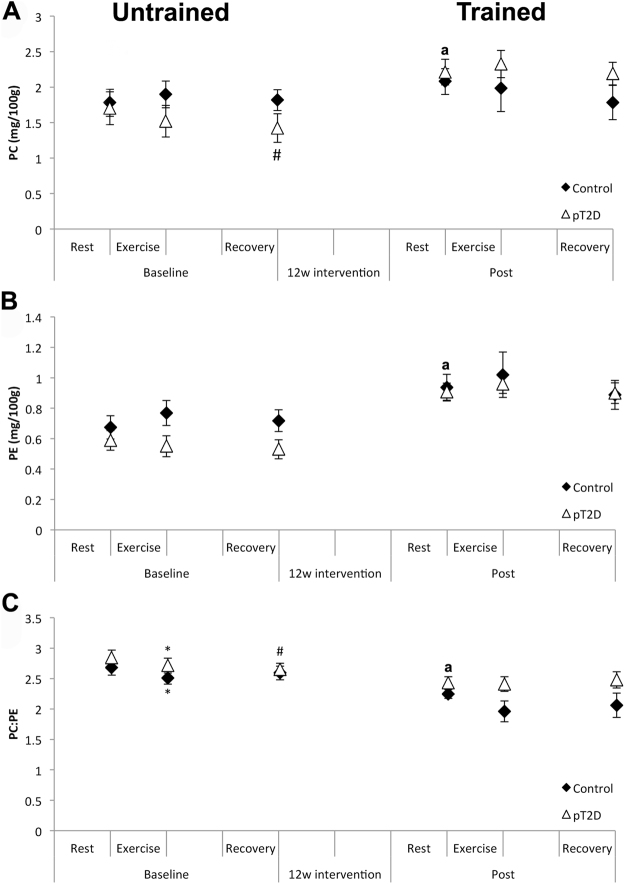
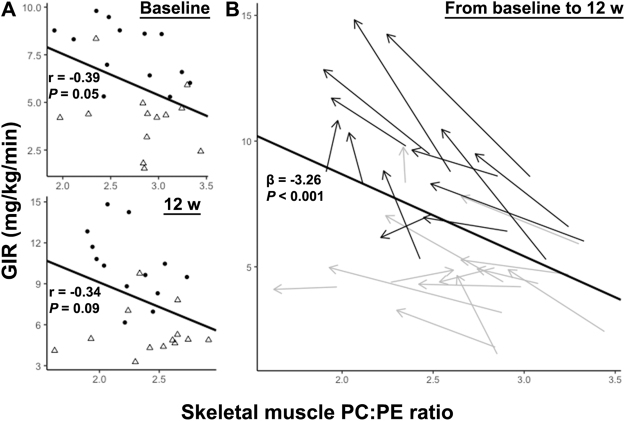
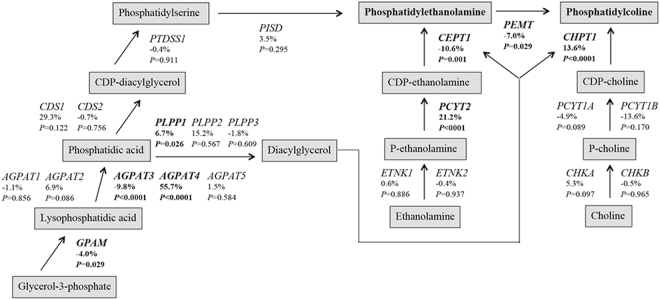
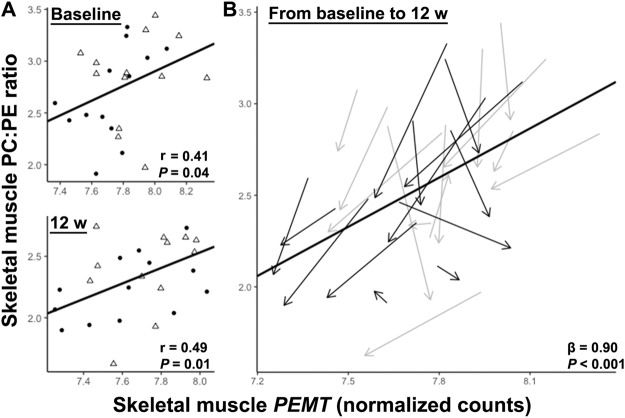
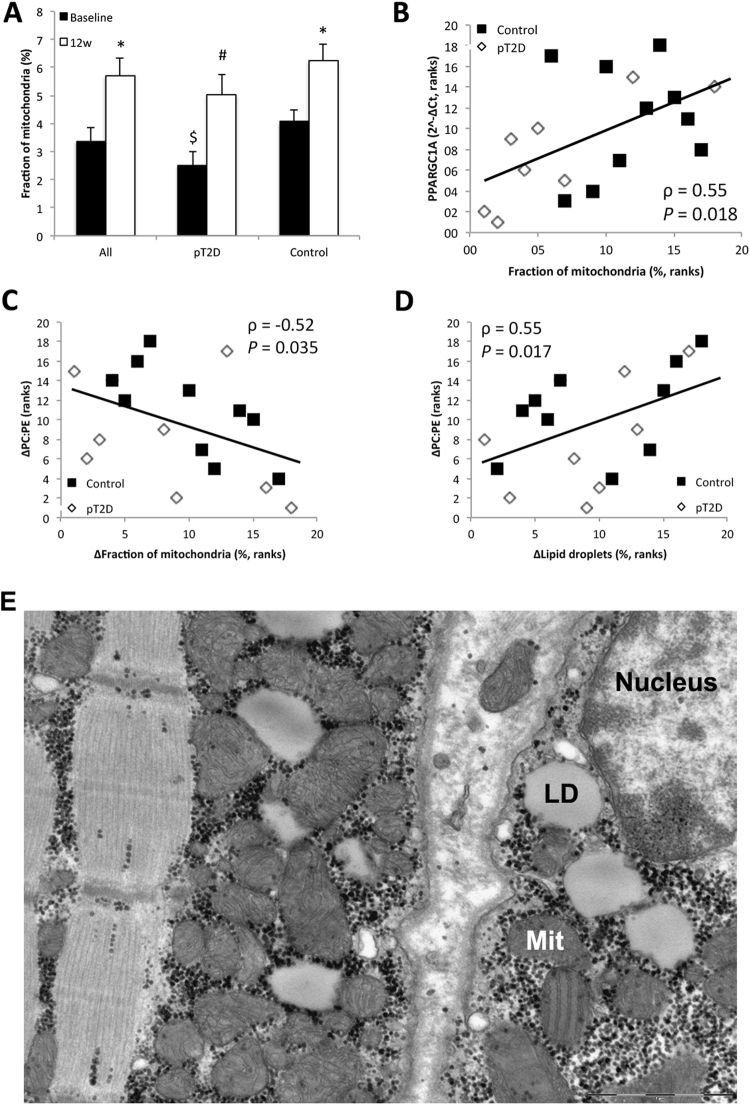
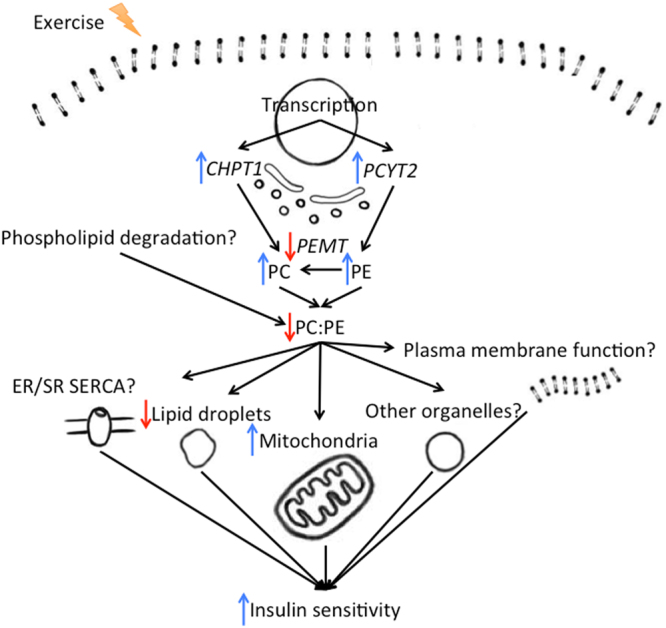
Phosphatidylcholine (PC) and phosphatidylethanolamine (PE) composition in skeletal muscle have been linked to insulin sensitivity. We evaluated the relationships between skeletal muscle PC:PE, physical exercise and insulin sensitivity. We performed lipidomics and measured PC and PE in m. vastus lateralis biopsies obtained from 13 normoglycemic normal weight men and 13 dysglycemic overweight men at rest, immediately after 45 min of cycling at 70% maximum oxygen uptake, and 2 h post-exercise, before as well as after 12 weeks of combined endurance- and strength-exercise intervention. Insulin sensitivity was monitored by euglycemic-hyperinsulinemic clamp. RNA-sequencing was performed on biopsies, and mitochondria and lipid droplets were quantified on electron microscopic images. Exercise intervention for 12 w enhanced insulin sensitivity by 33%, skeletal muscle levels of PC by 21%, PE by 42%, and reduced PC:PE by 16%. One bicycle session reduced PC:PE by 5%. PC:PE correlated negatively with insulin sensitivity (β = -1.6, P < 0.001), percent area of mitochondria (ρ = -0.52, P = 0.035), and lipid droplet area (ρ = 0.55, P = 0.017) on EM pictures, and negatively with oxidative phosphorylation and mTOR based on RNA-sequencing. In conclusion, PC and PE contents of skeletal muscle respond to exercise, and PC:PE is inversely related to insulin sensitivity.

Trial registration: ClinicalTrials.gov NCT01803568.


Conflict of interest statement

The authors declare that there is no conflict of interest that could be perceived as prejudicing the impartiality of the reported research except for A.A., T.E.G. and C.A.D. who are associated to Vitas Ltd. A.A. and T.E.G. are employed in Vitas. T.E.G. and C.A.D. are cofounders and stock owners, and C.A.D. is a board member and a consultant for Vitas Ltd.

Figures

Figure 1
Figure 1
Study design of MyoGlu. Participants underwent several tests before and after the 12 w combined strength- and endurance-exercise intervention. The pre-tests (clamp → MRI → strength/VO2max → acute bicycle challenges) and post-test (strength/VO2max → clamp + MRI → acute bicycle challenges) were standardized on preceding activity and rest. Blood and muscle samples were obtained during the acute bicycle challenges at 70% of VO2max (top panel).
Figure 2
Figure 2
Skeletal muscle PC and PE levels and the PC:PE ratio. (A) Resting levels of PC and PE, and the PC:PE ratio in skeletal muscle from dysglycemic overweight men (pT2D; n = 13) and normal weight control men (Control; n = 13). (B) Changes in PC- and PE-levels, and the PC:PE ratio in response to 12 w exercise among all participants combined (n = 26, black bars), and in the two groups separately (n = 13, grey and white bars). Units are indicated on the x-axis, not the y-axis, because the PC:PE ratio is by definition without an unit. Data represent means ± SEM. *P < 0.05 and ***P < 0.0001 for the change being zero. Data were analyzed using linear (mixed) regression and presented as mg/100 g wet weight.
Figure 3
Figure 3
PC- and PE-levels, and the PC:PE ratio in skeletal muscle after acute exercise in the untrained and trained state. (A) PC- and (B) PE-levels and the (C) PC:PE ratio were measured at rest, after 45 min cycling and after 2 h recovery, before (untrained, left) as well as after (trained, right) 12 w exercise intervention. Comparisons were performed using linear (mixed) regression. pT2D = dysglycemic overweight men; control = normal weight men. Data represent means ± SEM. *P < 0.05; rest vs. exercise, #P < 0.05 rest vs. recovery. aResting values of PC and PE were increased, whereas the PC:PE ratio was decreased between post and baseline, as presented in Fig. 2B.
Figure 4
Figure 4
Prediction of insulin sensitivity based on the skeletal muscle PC:PE ratio. (A) Negative correlations between the skeletal muscle PC:PE ratio and GIR were observed at baseline and after 12 w exercise intervention across all men. Between-subjects Pearson’s correlations at baseline (top) and after 12 w of intervention (bottom) are presented. pT2D = open triangles; control = black dots. (B) Individual changes in skeletal muscle PC:PE ratios and GIR during the training period. pT2D = grey arrows and control = black arrows indicating the change from baseline to 12 w. Arrow lengths indicate the magnitude of change.
Figure 5
Figure 5
Comparison of skeletal muscle transcripts based on RNA-Seq for enzymes in the PC and PE biosynthetic pathways in response to 12 w exercise intervention. Changes in the glycerolphosphate and Kennedy pathways were analyzed using DESeq2. P-values are reported along with %-changes in response to 12 w exercise. Significant changes (P < 0.05 and FDR < 0.1) are bolded. AGPAT, 1-acylglycerol-3-phophate acyltransferase; CDS, CDP-diacylglycerol synthase; CEPT, choline/ethanolamine phosphotransferase; CHK, choline kinase; CHPT1, choline phosphotransferase; ETNK, ethanolamine kinase; GPAM, glycerol-3-phosphate acyltransferase; PCYT1, choline phosphate cytidylyltransferase; PCYT2, ethanolamine phosphate cytidylyltransferase; PEMT, phosphatidylethanolamine N-methyltransferase; PISD, phosphatidylserine decarboxylase; PLPP, phospholipid phosphatase; PTDSS, phosphatidylserine synthase. The results were similar analyzing the two MyoGlu groups together (shown) and separately (not shown).
Figure 6
Figure 6
Prediction of skeletal muscle PC:PE ratios based on skeletal muscle PEMT mRNA transcription. (A) Skeletal muscle PEMT mRNA levels correlated positively with the PC:PE ratio both at baseline and after 12 w exercise intervention across all men. Between-subjects correlations at baseline and after 12 w of exercise intervention are presented. pT2D = open triangles; control = black dots. (B) Individual changes in skeletal muscle PEMT mRNA levels and PC:PE ratios during the training period. pT2D = grey arrows and control = black arrows indicating the change from baseline to 12 w. Arrow lengths indicate the magnitude of change.
Figure 7
Figure 7
Percent (%) area of skeletal muscle cells covered by mitochondria. (A) The % area of mitochondria before and after 12 w exercise intervention. (B) The % area of mitochondria correlated with mRNA levels of PGC-1α at baseline. (C) Changes in the % area of mitochondria in response to 12 w exercise correlated negatively with changes in the PC:PE ratio. (D) Changes in the % area of lipid droplets in response to 12 w exercise correlated with changes in the PC:PE ratio. (E) Mitochondria (Mit) and lipid droplets (LD) in skeletal muscle cells were quantified from electron micrographs using point counting. See methods for details. Two skeletal muscle fibers are depicted interspersed with extracellular matrix. Mitochondria exhibit cristae, and LDs and grains of glycogen are seen. Eight dysglycemic overweight men (pT2D) and 10 normal weight (control) men were available for mitochondrial and LD quantification. Data represent means ± SEM. *P < 0.05 compared to baseline. #P < 0.1 compared to baseline. $P < 0.1 compared to control. Linear (mixed) regression and Spearman’s rank correlations were performed.
Figure 8
Figure 8
Summary of findings and potential links between physical exercise, PC, PE, and insulin sensitivity. Skeletal muscle PC:PE ratio is responsive to physical exercise, inversely related to GIR (largely reflecting skeletal muscle insulin sensitivity), and proportional to skeletal muscle transcriptional levels of phospholipid synthesizing enzyme mRNA. The skeletal muscle PC:PE ratio also correlates with intramyocellular lipid droplets and mitochondria, sarco/endoplasmic reticulum Ca2+-ATPase, mRNA of oxidative enzymes in mitochondria, and plasma membrane insulin receptors, suggesting a complex role for PC and PE in skeletal muscle insulin sensitivity.

References

    1. Goodyear LJ, Kahn BB. Exercise, glucose transport, and insulin sensitivity. Annual review of medicine. 1998;49:235–261. doi: 10.1146/annurev.med.49.1.235. - DOI - PubMed
    1. Stuart CA, Shangraw RE, Prince MJ, Peters EJ, Wolfe RR. Bed-rest-induced insulin resistance occurs primarily in muscle. Metabolism: clinical and experimental. 1988;37:802–806. doi: 10.1016/0026-0495(88)90018-2. - DOI - PubMed
    1. Wilson PW, McGee DL, Kannel WB. Obesity, very low density lipoproteins, and glucose intolerance over fourteen years: The Framingham Study. American journal of epidemiology. 1981;114:697–704. doi: 10.1093/oxfordjournals.aje.a113240. - DOI - PubMed
    1. Helmrich SP, Ragland DR, Leung RW, Paffenbarger RS., Jr. Physical activity and reduced occurrence of non-insulin-dependent diabetes mellitus. The New England journal of medicine. 1991;325:147–152. doi: 10.1056/NEJM199107183250302. - DOI - PubMed
    1. Soman VR, Koivisto VA, Deibert D, Felig P, DeFronzo RA. Increased insulin sensitivity and insulin binding to monocytes after physical training. The New England journal of medicine. 1979;301:1200–1204. doi: 10.1056/NEJM197911293012203. - DOI - PubMed

Publication types

MeSH terms

Associated data