. 2018 May;557(7703):112-117.
doi: 10.1038/s41586-018-0064-8. Epub 2018 Apr 25.

LUBAC is essential for embryogenesis by preventing cell death and enabling haematopoiesis

Affiliations

LUBAC is essential for embryogenesis by preventing cell death and enabling haematopoiesis

Nieves Peltzer et al. Nature. 2018 May.

Abstract

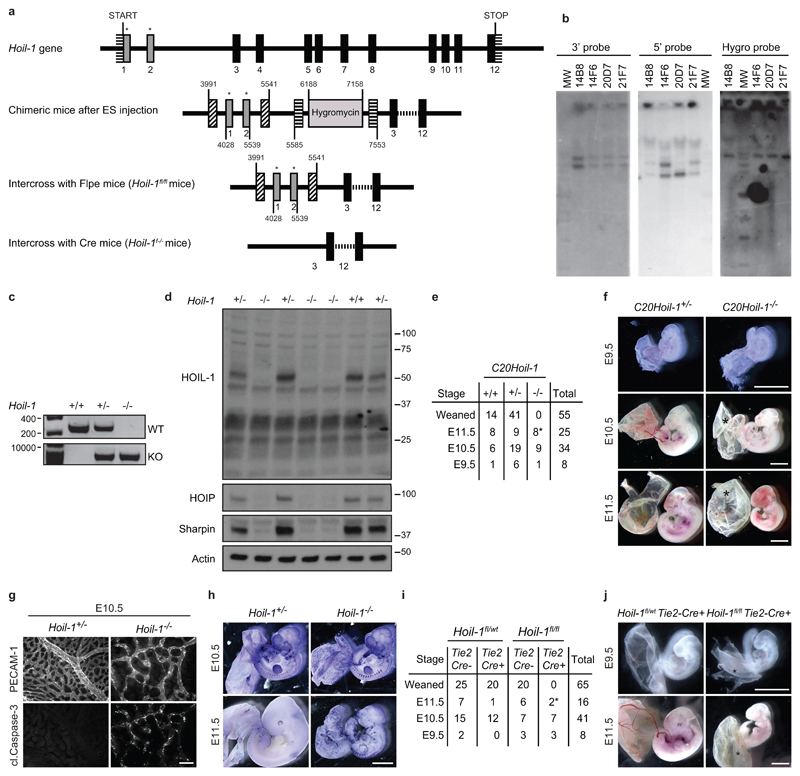
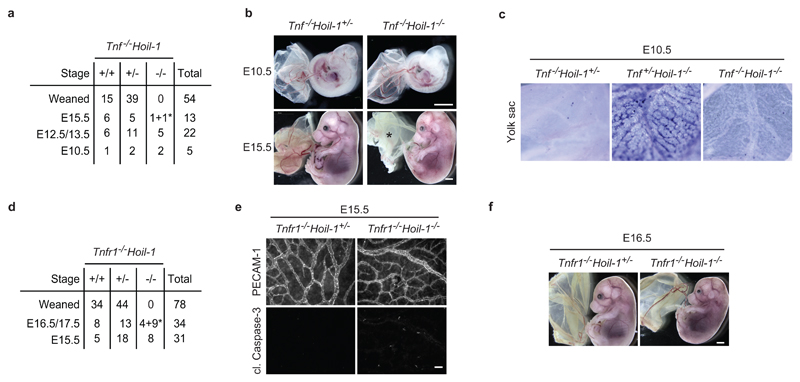
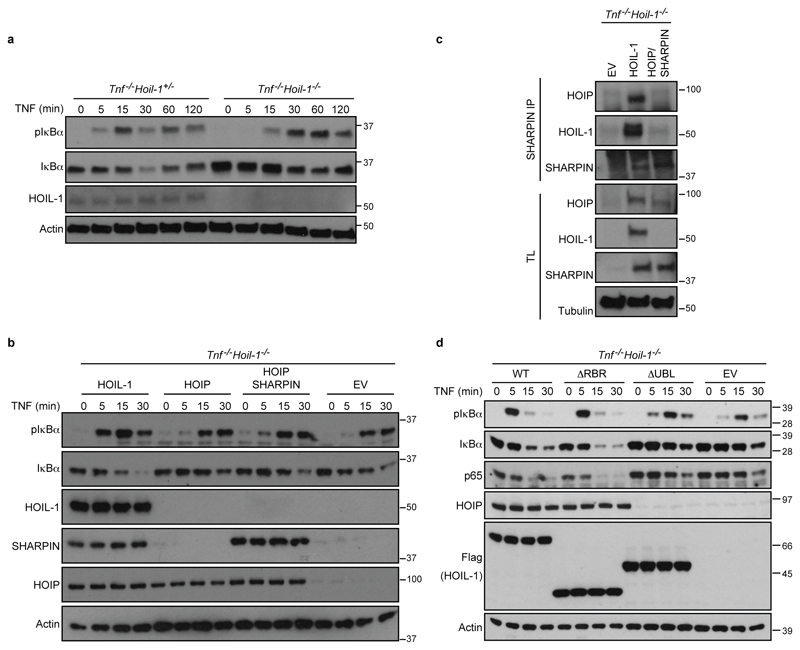
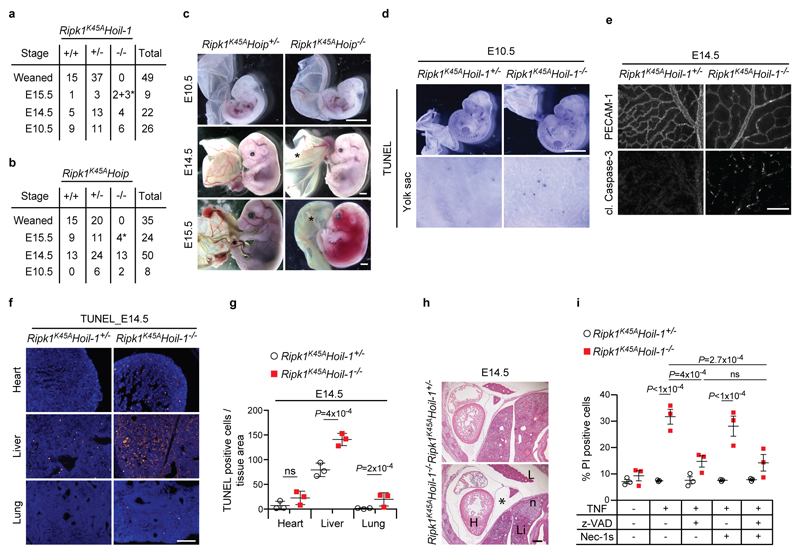
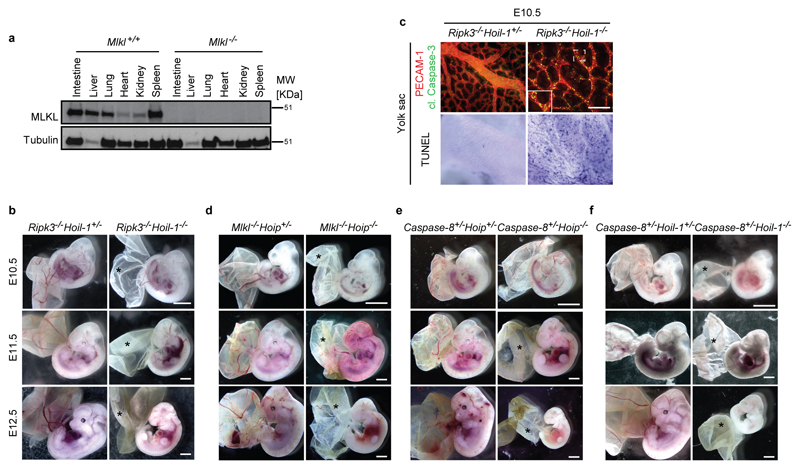
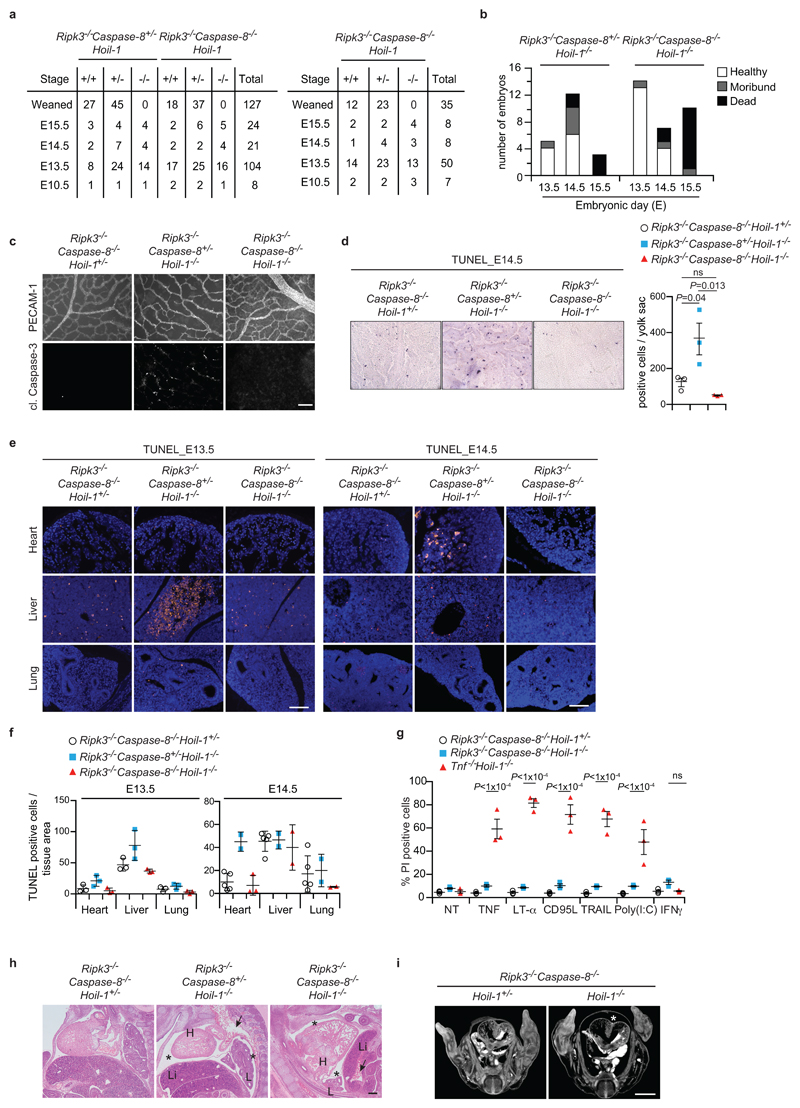
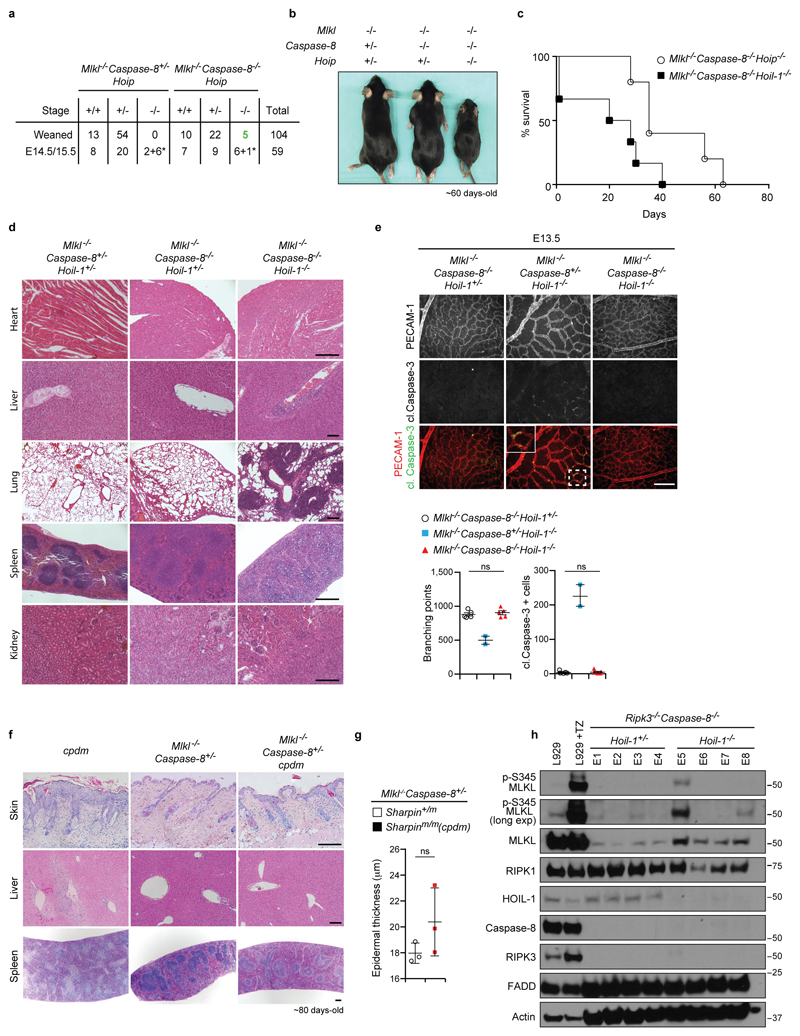
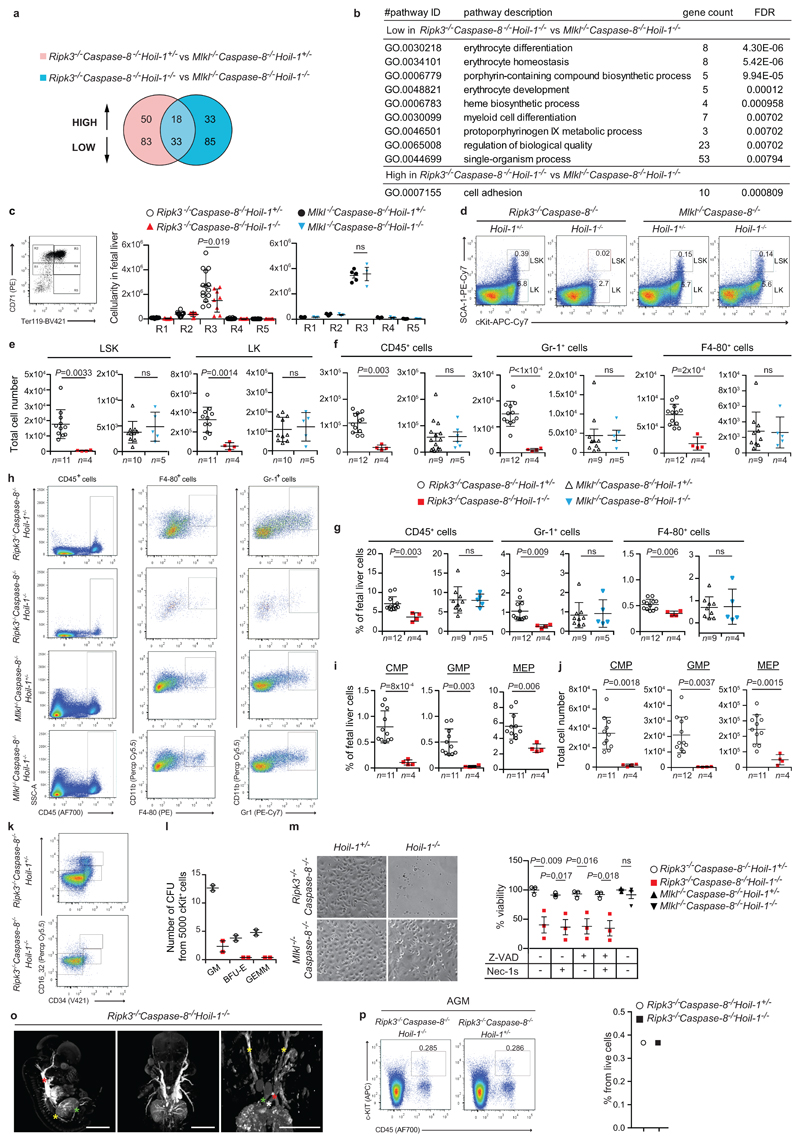
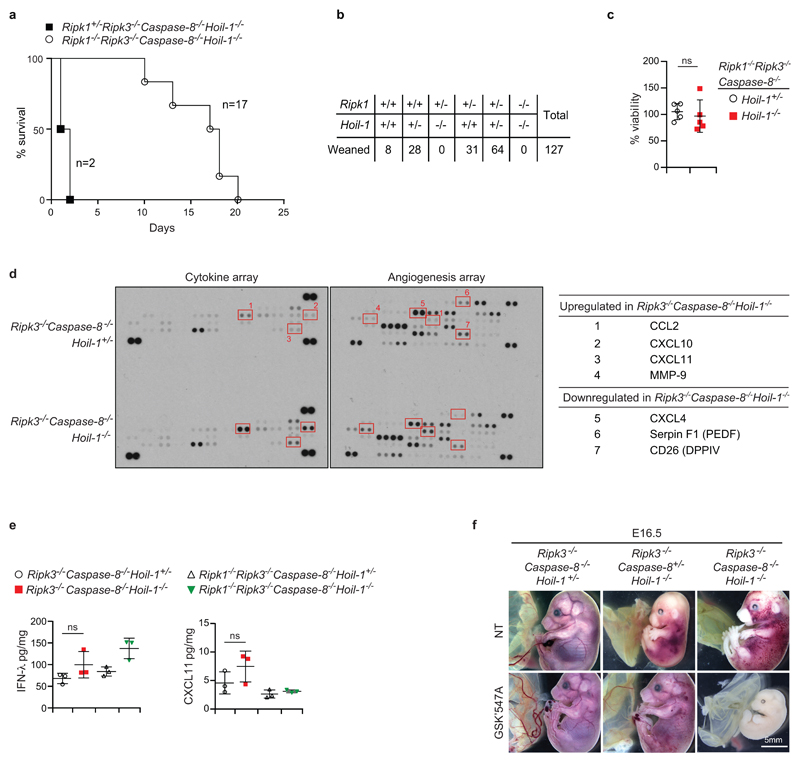
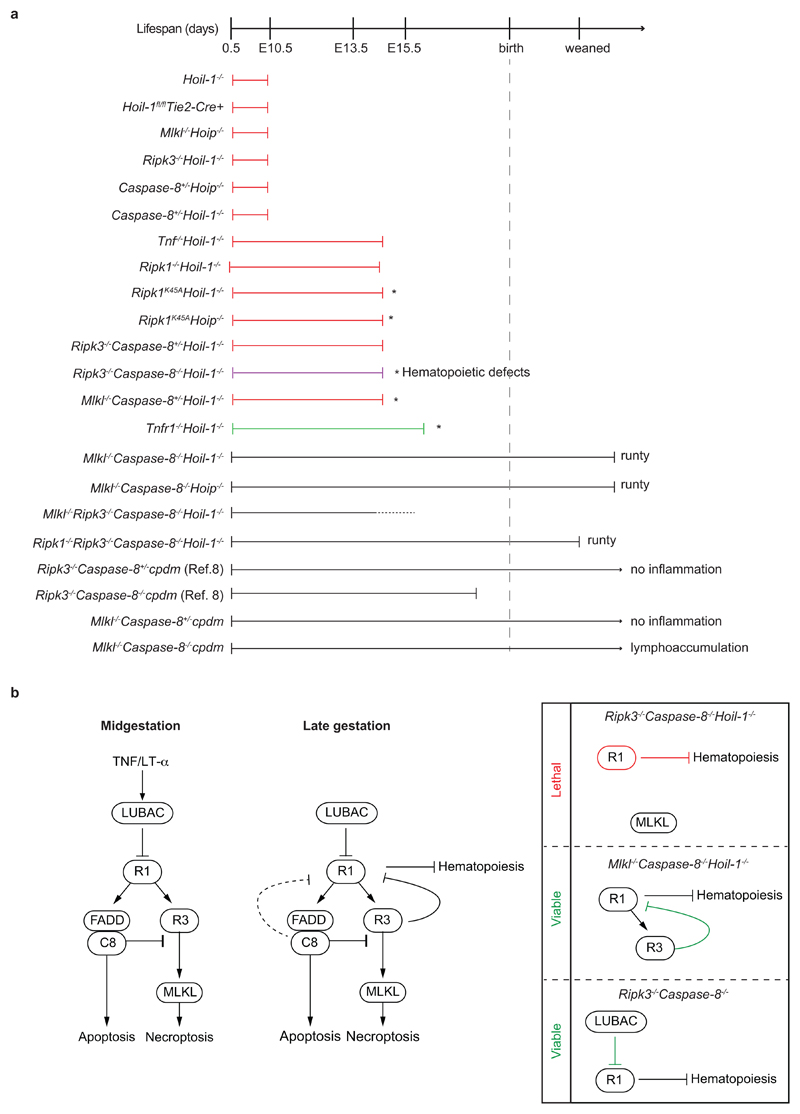
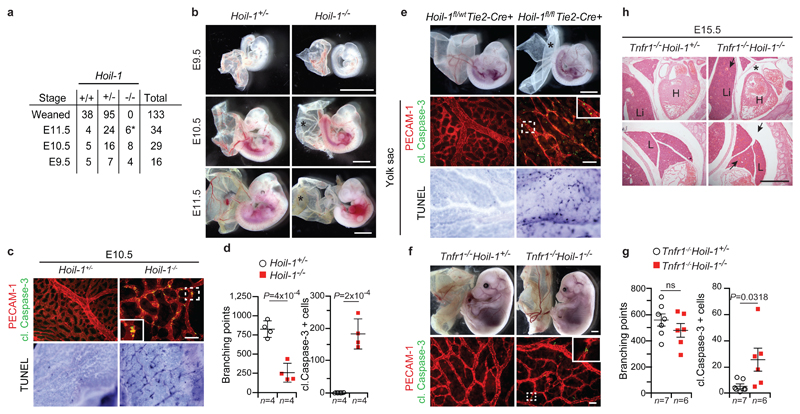
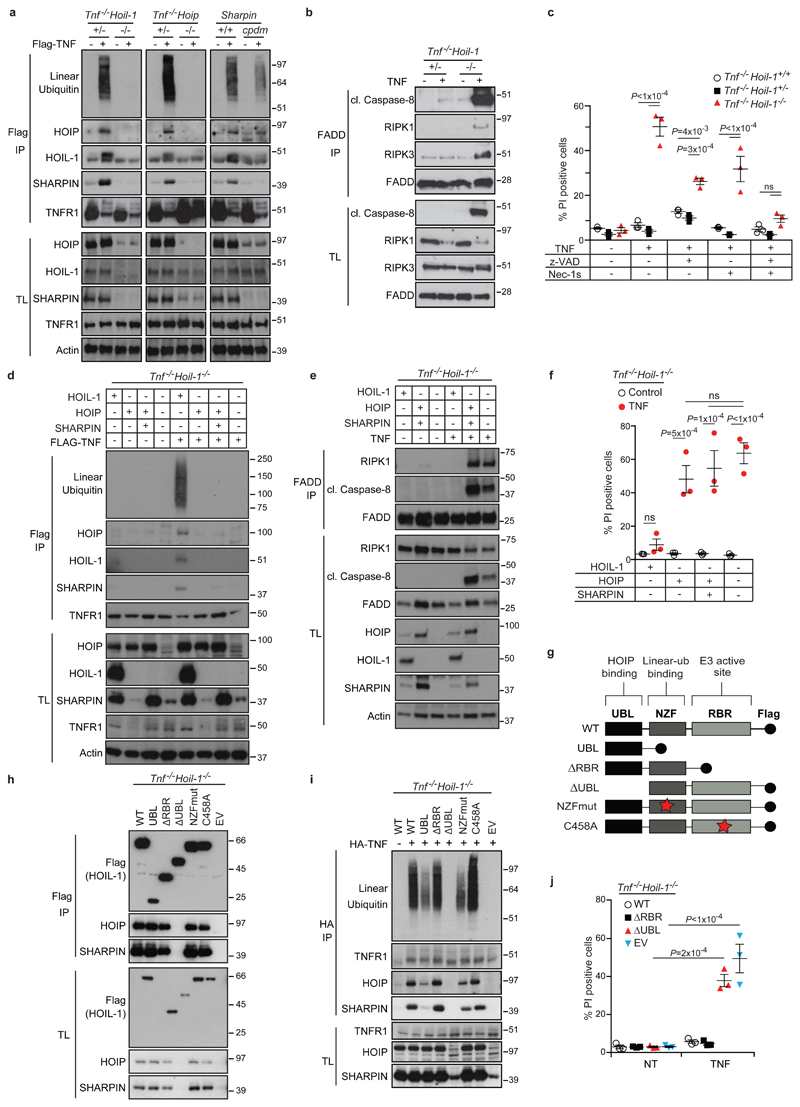
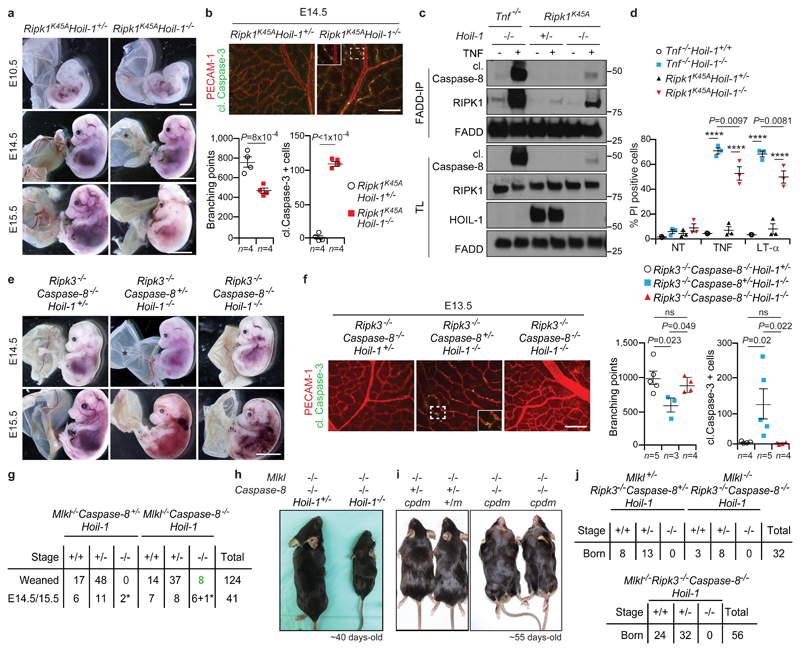
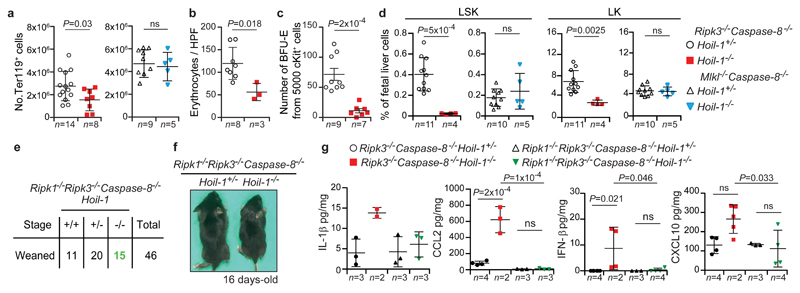
The linear ubiquitin chain assembly complex (LUBAC) is required for optimal gene activation and prevention of cell death upon activation of immune receptors, including TNFR1 1 . Deficiency in the LUBAC components SHARPIN or HOIP in mice results in severe inflammation in adulthood or embryonic lethality, respectively, owing to deregulation of TNFR1-mediated cell death2-8. In humans, deficiency in the third LUBAC component HOIL-1 causes autoimmunity and inflammatory disease, similar to HOIP deficiency, whereas HOIL-1 deficiency in mice was reported to cause no overt phenotype9-11. Here we show, by creating HOIL-1-deficient mice, that HOIL-1 is as essential for LUBAC function as HOIP, albeit for different reasons: whereas HOIP is the catalytically active component of LUBAC, HOIL-1 is required for LUBAC assembly, stability and optimal retention in the TNFR1 signalling complex, thereby preventing aberrant cell death. Both HOIL-1 and HOIP prevent embryonic lethality at mid-gestation by interfering with aberrant TNFR1-mediated endothelial cell death, which only partially depends on RIPK1 kinase activity. Co-deletion of caspase-8 with RIPK3 or MLKL prevents cell death in Hoil-1-/- (also known as Rbck1-/-) embryos, yet only the combined loss of caspase-8 with MLKL results in viable HOIL-1-deficient mice. Notably, triple-knockout Ripk3-/-Casp8-/-Hoil-1-/- embryos die at late gestation owing to haematopoietic defects that are rescued by co-deletion of RIPK1 but not MLKL. Collectively, these results demonstrate that both HOIP and HOIL-1 are essential LUBAC components and are required for embryogenesis by preventing aberrant cell death. Furthermore, they reveal that when LUBAC and caspase-8 are absent, RIPK3 prevents RIPK1 from inducing embryonic lethality by causing defects in fetal haematopoiesis.


Conflict of interest statement

The authors declare no competing financial interest. J.B and A.L. are GSK employees.

Figures

Extended data Figure 1
Extended data Figure 1. HOIL-1-deficient mice die at mid-gestation
a, Schematic representation of the Hoil-1 knockout strategy. Solid boxes represent Hoil-1 exons and grey boxes with a star indicate the targeted exons. Boxes with diagonal and horizontal strips represent LoxP and Frt sites, respectively. b, Specificity of gene recombination was assessed by Southern blotting with 5’ and 3’ probes external to the construct in four clones (14B8, 14F6, 20D7 and 21F7). Digest of the DNA with ApaI, followed by hybridisation with the 3’ probe was expected to show a 5700 bp band for the WT allele and a 7700 bp band for the mutant allele. All four clones appeared to have the correct recombination on the 3’ side. Digest of the DNA with SphI and hybridisation with the 5’ probe was expected to show a 4500 bp WT band and a 6200 bp band for the mutated allele. Clones 14B8, 14F6 and 21F7 appeared to be correctly recombined on the 5’ side. Finally, cutting the DNA with ApaI and hybridising with a hygro probe showed a single band in all clones, indicative of a single integration of the construct in all four ES clones. Clones 14B8 and 14F6 were selected for generation of the two Hoil-1-/- strains. c, PCR analysis of Hoil-1 wild-type, heterozygous and knockout mice. d, Protein levels of HOIL-1, HOIP and SHARPIN in whole embryo lysates (n= 3 for Hoil-1+/- and Hoil-1-/- embryos and n=1 for Hoil-1+/+ embryos). For gel source data (c, d), see Supplementary Figure 1. e, Quantification of genotypes of animals obtained from inter-crossing C20Hoil-1+/- mice. *indicates dead embryos. f, Representative images of C20Hoil-1+/- and C20Hoil-1-/- embryos from E9.5 to E11.5 as quantified in (e). Scale bar: 2 mm. g, Single staining showing vascularisation (PECAM-1, top panel) and apoptosis (cleaved Caspase-3, bottom panel) of yolk sacs. Merged image is shown in Fig. 1c. h, Whole-mount TUNEL staining of embryos at the indicated stages (embryo/genotype n=2 at E10.5, n=8 for Hoil-1+/- and n=5 for Hoil-1-/- at E11.5). Scale bar: 2 mm. i, Quantification of genotypes of animals obtained from inter-crossing Hoil-1fl/wtTie2-Cre+ with Hoil-1fl/flTie2-Cre- mice. *indicates dead embryos. j, Representative images of embryos with conditional deletion of Hoil-1 in Tie2-Cre expressing cells as quantified in (i). Scale bar: 2 mm. *: poorly vascularised yolk sac.
Extended data Figure 2
Extended data Figure 2. TNFR1 signalling drives cell death and lethality of HOIL-1-deficient mice at mid-gestation.
a, d, Quantification of genotypes of animals obtained from inter-crosses of Tnf-/-Hoil-1+/- (a) and Tnfr1-/-Hoil-1+/- (d) mice. *: dead embryos. b, Representative images of embryos quantified in (a) at E10.5 and E15.5, *; poor yolk sac. c, Cell death as detected by whole-mount TUNEL staining in yolk sacs at E10.5 (n= 3 embryos/genotype). e, Single staining showing vascularisation (PECAM-1, top panel) and apoptosis (cleaved Caspase-3, bottom panel) of yolk sacs. Merged image is shown in Fig. 1g. Scale bar: 50 µm. f, Representative images of embryos at E16.5 (n=2 for Tnfr1-/-Hoil-1+/- and n=4 for Tnfr1-/-Hoil-1-/-).
Extended data Figure 3
Extended data Figure 3. HOIL-1 is required for optimal TNF-induced NF-kB activation independently of its RBR domain.
a, b, d, Western blot analysis of the indicated proteins in whole-cell lysates from MEFs of the indicated genotypes after they had been stimulated with TNF (or left untreated) for the indicated time points in minutes (min) (a), overexpressing the different LUBAC components (b) or the indicated mutant forms of HOIL-1 (d) (n=2 independent experiments). c, SHARPIN-IP was performed in Tnf-/-Hoil-1-/- MEFs reconstituted with HOIL-1 or a combination of HOIP and SHARPIN and analysed by Western blotting (n=2 independent experiments). TL: total lysate, EV: empty vector. For gel source data, see Supplementary Figure 1.
Extended data Figure 4
Extended data Figure 4. Ablation of the kinase activity of RIPK1 in HOIL-1- or HOIP-deficient embryos prevents cell death and lethality at mid-gestation but not at late gestation.
a, b, Quantification of genotypes of animals obtained after inter-crossing Ripk1K45AHoil-1+/- (a) and Ripk1K45AHoip+/- (b) mice. *indicates dead embryos. c, Representative images of embryos quantified in (b) *; poor yolk sac vascularisation. Scale bar: 2 mm. d, Whole-mount TUNEL staining of embryos (n=2 embryos). Scale bar: 2 mm. e, Single staining showing vascularisation (PECAM-1, top panel) and apoptosis (cleaved (cl.) Caspase-3, bottom panel) of yolk sacs. Merged image is shown in Fig. 3b. f, g, Representative images of cell death in different organs (f) and quantification (g) as detected by TUNEL staining at E14.5 (n=3 embryos/genotype). Scale bar: 50 μm (f). Mean ± s.e.m. (n=3 embryos/genotype) and P values from one-way ANOVA are reported (g). h, Representative images of H&E staining on whole-embryo paraffin sections (n=3 embryos/genotype). *; pericardial effusion, n, necrotic area. H, heart; L, lung; Li, liver. Scale bar: 200 µm. i, Cell death was analysed by PI staining in MEFs stimulated or not with TNF for 24 h plus the indicated cell death inhibitors. Mean ± s.e.m. (n=3 independent experiments) and P values from two-way ANOVA are reported.
Extended data Figure 5
Extended data Figure 5. Individual deletion of mediators of apoptosis or necroptosis does not prevent cell death and lethality at mid-gestation of HOIL-1- or HOIP-deficient embryos.
a, Western blot analysis of MLKL expression in the indicated organs derived from control Mlkl-/- mice (n=2 mice/genotype). For gel source data, see Supplementary Figure 1. b, d, e, f, Representative images of embryos at different stages of gestation (E10.5: n=7 for Ripk3-/-Hoil-1+/- and n=5 for Ripk3-/-Hoil-1-/-; E11.5: n=5 for Ripk3-/-Hoil-1+/- and n=2 for Ripk3-/-Hoil-1-/-; E12.5: n=9 for Ripk3-/-Hoil-1+/- and n=2 for Ripk3-/-Hoil-1-/- (b), E10.5: n=16 for Mlkl-/-Hoip+/- and n=6 for Mlkl-/-Hoip-/-; E11.5: n=8 for Mlkl-/-Hoip+/- and n=6 for Mlkl-/-Hoip-/-; E12.5: n=10 for Mlkl-/-Hoip+/- and n=5 for Mlkl-/-Hoip-/- (d), E10.5: n=5 for Caspase-8+/-Hoip+/- and n=4 for Caspase-8+/-Hoip-/-; E11.5: n=6 for Caspase-8+/-Hoip+/- and n=3 for Caspase-8+/-Hoip-/-; E12.5: n=3 for Caspase-8+/-Hoip+/- and n=2 for Caspase-8+/-Hoip-/- (e), E10.5: n=2 for Caspase-8+/-Hoil-1+/- and n=4 for Caspase-8+/-Hoil-1-/-; E11.5: n=2 for Caspase-8+/-Hoil-1+/- and n=5 for Caspase-8+/-Hoil-1-/-; E12.5: n=6 for Caspase-8+/-Hoil-1+/- and n=3 for Caspase-8+/-Hoil-1-/- (f)). *: poor yolk sac vascularisation. Scale bar: 2 mm. c, Representative images of yolk sac vascularisation and cell death at E10.5 as detected by PECAM-1 (red) and cleaved (cl.) Caspase-3 staining (green) (top panel) and whole mount TUNEL staining (bottom panel) (n=4 per genotype). Scale bar: 50 µm.
Extended data Figure 6
Extended data Figure 6. Combined deletion of RIPK3 and Caspase-8 prevents cell death but not embryonic lethality at late gestation that is caused by the loss of HOIL-1.
a, Quantification of genotypes of animals obtained from inter-crosses of Ripk3-/-Caspase-8+/-Hoil-1+/- with Ripk3-/-Caspase-8-/-Hoil-1+/- mice (left panel) or Ripk3-/-Caspase-8-/-Hoil-1+/- mice (right panel). b, Health status of Ripk3-/-Caspase-8+/-Hoil-1-/- and Ripk3-/-Caspase-8-/-Hoil-1-/- embryos at different developmental stages. c, Single staining showing vascularisation (PECAM-1, top panel) and apoptosis (cleaved (cl.) Caspase-3, bottom panel) of yolk sacs. Merged image is shown in Fig. 3f. Scale bar: 50 µm. d, Cell death as detected by whole-mount TUNEL staining in yolk sacs at E14.5 (left panel) and respective quantification (right panel). Mean ± s.e.m. (n=3 embryos/genotype) and P values from one-way ANOVA are reported. e, f Representative images (e) and quantification (f) of cell death in different organs as detected by TUNEL staining at E13.5 (n=3 embryos/genotype) and E14.5 (n=5 for Ripk3-/-Caspase-8-/-Hoil-1+/-, n=2 for Ripk3-/-Caspase-8-/-Hoil-1-/- and Ripk3-/-Caspase-8-/-Hoil-1-/- lung and liver and n=3 Ripk3-/-Caspase-8-/-Hoil-1-/- heart). Scale bar: 50 µm (e). Mean ± s.e.m. values are shown (f). g, Cell death was analysed by PI staining in MEFs stimulated or not with the indicated ligands for 24 h. Mean ± s.e.m. (n=3 independent experiments) and P values from two-way ANOVA are reported. h, Representative images of H&E staining on E13.5 whole-embryo paraffin embedded sections (n=3 for Ripk3-/-Caspase-8-/-Hoil-1+/- and Ripk3-/-Caspase-8-/-Hoil-1-/- and n=2 for Ripk3-/-Caspase-8+/-Hoil-1-/-). *: pericardial effusion, arrows; congested vessels H, heart; L, lung; Li, liver. Scale bar: 200 µm. i, Representative images of micro-focus CT scan images of whole E13.5 embryos (n=3 embryos/genotype). *: pericardial effusion
Extended data Figure 7
Extended data Figure 7. Combined deletion of MLKL and Caspase-8 promotes survival of LUBAC-deficient mice.
a, Quantification of genotypes of animals obtained from inter-crosses of Mlkl-/-Caspase-8+/-Hoip+/- with Mlkl-/-Caspase-8-/-Hoip+/- mice. *: dead embryos. b, Representative images of adult mice as quantified in (a). c, Kaplan-Meier plot of mouse survival (n=6 for Mlkl-/-Caspase-8-/-Hoip-/- and n=9 for Mlkl-/-Caspase-8-/-Hoil-1-/- mice). d, Representative images of H&E staining of the indicated organs (n=3 mice/genotype). Scale bar: 200 µm. e, Representative images of yolk sac vascularisation (PECAM-1, red) and apoptosis (cleaved (cl.) Caspase-3, green) (top panel) at E13.5 and respective quantifications (bottom panel). Mean ± s.e.m (n=5 for Mlkl-/-Caspase-8-/-Hoil-1+/- and Mlkl-/-Caspase-8-/-Hoil-1-/- and n=2 for Mlkl-/-Caspase-8+/-Hoil-1-/-) are shown and results were analysed with unpaired two-tailed t-tests comparing Mlkl-/-Caspase-8-/-Hoil-1+/- and Mlkl-/-Caspase-8-/-Hoil-1-/- embryos. f, Representative images of H&E staining of the indicated organs (n=3 embryos/genotype). Scale bar: 200 µm. g, Epidermal thickness quantification of mice of the indicated genotypes in (f). Mean ± s.e.m values (n=3 mice/genotype) are shown and results were analysed with unpaired two-tailed t-tests. h, Western blot analysis of lysates from whole E13.5 embryos of the indicated genotypes as well as L929 cells treated or not with TNF plus zVAD-fmk for 2 h as antibody validation (n=4 embryos/genotype performed twice). For gel source data, see Supplementary Figure 1.
Extended data Figure 8
Extended data Figure 8. Combined deletion of RIPK3 and Caspase-8 causes haematopoietic defects and RIPK1-dependent embryonic lethality in HOIL-1-deficient mice.
a, Venn diagram depicting genes differentially expressed by RNAseq analysis between E13.5 embryos of the indicated genotypes. b, Gene Ontology (GO) enrichment analysis of differentially (85 low and 35 high in (a)) expressed genes. FDR: false discovery rate. c, Representative FACS profile of E13.5 foetal liver cells with different erythroblast populations gated according to their CD71 and TER119 expression levels (R1-R5). R1 contains immature RBC progenitors, including BFU-E and CFU-E; R2 comprises mainly pro-erythroblasts and early basophilic erythroblasts; R3 contains both early and late basophilic erythroblasts; R4 is composed of chromatophilic and orthochromatophilic erythroblasts; and R5 consists of late orthochromatophilic erythroblasts and reticulocytes and quantification. Mean ± s.e.m. (n=14 Ripk3-/-Caspase-8-/-Hoil-1+/-, n=8 Ripk3-/-Caspase-8-/-Hoil-1-/-, n=5 for Mlkl-/-Caspase-8-/-Hoil-1-/- and n=3 for Mlkl-/-Caspase-8-/-Hoil-1-/- foetal livers) and P values from two-way ANOVA are reported. d, h, k Representative FACS profile of E13.5 foetal liver cells for the indicated haematopoietic populations (sample size specified in (e-g, i, j)). e, f, j Total cell number of the different haematopoietic cell subsets in foetal liver cell suspensions from E13.5 embryos of the indicated genotypes gated as in (d), (h) and (k), respectively. Total number of multipotent progenitors (LSK and LK cells) (e), mature CD45+ blood cells, including granulocytes (GR-1+) and macrophages (F4-80+) (f) and myeloid progenitors (CMP, GMP and MEP) (j). Mean ± s.e.m. and P values from unpaired two-tailed t-tests are reported. g, i, Percentages of mature CD45+ leucocytes, GR-1+ and F4-80+ cells (g) and CMP, GMP and MEP (i). Mean ± s.e.m. and P values from unpaired two-tailed t-tests are reported. l, Differentiation of E13.5 foetal liver (c-KIT+) progenitors into CFU-granulocytes and macrophages (GM), burst forming units-erythrocyte (BFU-E) or and CFU-granulocyte, erythroid, macrophage, megakaryocyte (GEMM). Mean ± s.e.m. (n=2 foetal livers). m, Micrographs of differentiated macrophages (n=3 Ripk3-/-Caspase-8-/-Hoil-1+/- and Ripk3-/-Caspase-8-/-Hoil-1-/-, n=5 Mlkl-/-Caspase-8-/-Hoil-1+/- and n=4 Mlkl-/-Caspase-8-/-Hoil-1-/- foetal livers) and percentage viability of macrophages from E13.5 foetal liver cell suspensions from embryos of the indicated genotypes in the presence or absence of the indicated inhibitors as measured by Cell Titer Glo. Mean ± s.e.m. (n=3 Ripk3-/-Caspase-8-/-Hoil-1+/- and Ripk3-/-Caspase-8-/-Hoil-1-/-, n=5 Mlkl-/-Caspase-8-/-Hoil-1+/- and n=4 Mlkl-/-Caspase-8-/-Hoil-1-/- foetal livers) and P values from two-way ANOVA are reported. o, MicroCT scan images of Ripk3-/-Caspase-8-/-Hoil-1-/- embryos showing maximum intensity projections, with windowing applied to highlight vasculature (high contrast). No anatomical defects that would explain destruction of RBCs or poor distribution of blood to the peripheries were found (n=3 embryos). Left image: yellow star: distal aorta, green star: umbilical vessels and red star: descending thoracic aorta. Right image, yellow star: carotid artery, red star: descending thoracic aorta, white star: ductus arteriosus, blue star: ascending thoracic aorta. p, Representative FACS profile of a pool of three E11.5 dorsal aortas, containing the AGM region, per indicated genotype and quantification. This experiment was performed once with 3 embryos per genotype.
Extended data Figure 9
Extended data Figure 9. Concomitant deletion of RIPK1 prevents embryonic lethality of Ripk3-/-Caspase-8-/-Hoil-1-/- mice.
a, Kaplan-Meier plot of mouse survival (n=17 for Ripk1-/ Ripk3-/-Caspase-8-/-Hoip-/- and n=2 for Ripk+/-Ripk3-/-Caspase-8-/-Hoip-/- mice). b, Quantification of genotypes of animals obtained from inter-crosses of Ripk1+/-Hoil-1+/- mice. For simplicity not all possible genotypes are represented. c, Percentage viability of macrophages from E13.5 foetal liver cell suspensions from embryos of the indicated genotypes as measured by Cell Titer Glo. Mean ± s.e.m. (n=5 foetal livers/genotype) are reported and results were analysed with unpaired two-tailed t-tests. d, Cytokine arrays from Ripk3-/-Caspase-8-/-Hoil-1+/- and Ripk3-/-Caspase-8-/-Hoil-1-/- embryos (left panels) and table listing the altered cytokines (right panel). Red squares highlight the differences (n=1 for each genotype). For gel source data, see Supplementary Figure 1. e, Cytokine analysis in homogenates from embryos of the indicated genotypes. Mean ± s.e.m. (n=3 embryos/genotype) and P values from one-way ANOVA are reported. f, Representative images of E16.5 embryos from control mothers or mothers fed with the RIPK1 kinase inhibitor GSK’457A from mating and throughout gestation (embryos treated with GSK'457A n=5 for Ripk3-/-Caspase-8-/-Hoil-1+/- and n=7 Ripk3-/-Caspase-8+/-Hoil-1-/- and n=3 for Ripk3-/-Caspase-8-/-Hoil-1-/-). Scale bar: 5 mm.
Extended data Figure 10
Extended data Figure 10. Schematic representation of findings in this study
a, Diagram indicating extent of viability and phenotypes of single, double, triple and quadruple knockout mice. Red lines indicate cell death and loss of yolk sac vascularisation phenotype. Green line indicates mild cell death phenotype without loss of yolk sac vascularisation. Asterisk (*) indicates that heart defects were observed. b, Proposed model of LUBAC function during embryogenesis. At mid-gestation (left panel), LUBAC maintains vascular tissue integrity by preventing aberrant TNF/LT-α-mediated Caspase-8- and RIPK3/MLKL-induced cell death. At late gestation, LUBAC is not only required to prevent aberrant cell death but also to prevent severe defects in haematopoiesis that are driven by RIPK1 but can be prevented by RIPK3 (middle panel). Genetic ablation of LUBAC and of different components of the cell death machinery indicates that (right panel): 1) in the absence of LUBAC, Caspase-8 and RIPK3, RIPK1 provokes lethality most likely by depleting multipotent progenitors in the haematopoietic compartment; 2) in the absence of Caspase-8 and MLKL, cell death induced by loss of LUBAC is prevented and RIPK3 is present to exert its protective role on foetal haematopoiesis by precluding aberrant RIPK1 signalling; and 3) in the absence of Caspase-8 and RIPK3, the presence of LUBAC is sufficient to prevent RIPK1 from causing severe defects in haematopoiesis and lethality since Ripk3-/-Caspase-8-/- mice are viable,,. This indicates that RIPK3 and LUBAC can compensate for each other to block aberrant RIPK1 signalling.
Figure 1
Figure 1. HOIL-1 deficiency causes embryonic lethality at mid-gestation due to TNFR1-mediated endothelial cell death
a, Mendelian frequencies obtained from inter-crossing Hoil-1+/- mice, *: dead embryos. b, Representative images of embryos from E9.5 to E11.5 quantified in (a), *: poor yolk sac vascularisation. Scale bar: 2 mm. c, Representative images of yolk sac vascularisation (PECAM-1, red) and cell death (cleaved (cl.) Caspase-3 staining, green) at E10.5 (top panel) (n=4 yolk-sacs/genotype), and whole-mount TUNEL staining (bottom, panel) (n=2 yolk-sacs/genotype). Scale bar: 50 µm. d, g, Quantification of branching points (g) and cleaved Caspase-3 positive cells (g). Mean ± s.e.m. values and P values from unpaired two-tailed t-tests are shown. e, Representative images of embryos at E10.5 (n=14 Hoil-1fl/wtTie2-Cre+ and n=7 Hoil-1fl/flTie2-Cre+ embryos, top panel). *: poor yolk sac vascularisation. Scale bar: 2 mm. Yolk sac vascularisation (PECAM-1, red) and apoptosis (cleaved Caspase-3, green) (middle panel). Scale bar: 50 µm. Yolk sac whole-mount TUNEL staining (n=6 Hoil-1fl/wtTie2-Cre+ and n=2 Hoil-1fl/flTie2-Cre+ yolk-sacs/genotype, bottom panel). f, Representative images of embryos at E15.5 (top panel, n=6 Tnfr1-/-Hoil-1-/- and n=19 Tnfr1-/-Hoil-1+/- embryos), scale bar: 2 mm, and yolk sac vascularisation (PECAM-1, red) and apoptosis (cleaved Caspase-3, green) (bottom panel), Scale bar: 50 µm. h, Representative images of H&E staining on whole-embryo paraffin sections (n=3 embryos/genotype). *: pericardial effusion, arrows; congested vessels. H, heart; L, lung; Li, liver. Scale bar: 50 µm.
Figure 2
Figure 2. The UBL domain but not the RBR domain of HOIL-1 is essential for LUBAC activity at the TNFR1-SC and to prevent TNF/TNFR1-induced cell death.
a, d, TNFR1-SC pull-down by FLAG- immunoprecipitation (IP) in MEFs derived from mice of the indicated genotypes ± FLAG-TNF for 15 min (n=2 independent experiments) (a) and reconstituted with HOIL-1, HOIP or HOIP and SHARPIN (n=4 independent experiments) (d). b, e, FADD-IP performed in MEFs of the indicated genotypes treated for 4 h with the caspase inhibitor zVAD-fmk ± TNF (b) and reconstituted as indicated (e) (n=2 independent experiments (b,e)). c, f, j, Cell death analysed by propidium iodide (PI) staining in MEFs with the indicated genotypes ± TNF ± the indicated inhibitors for 24 h (c), reconstituted (f) or transduced (j) as indicated (f, j). Mean ± s.e.m. (n=3 independent experiments) and P values from two-way ANOVA are shown. g, Schematic overview of HOIL-1 constructs used to transduce Tnf-/-Hoil-1-/- MEFs. h, Flag-IP of indicated HOIL-1 mutants (n=2 independent experiments). i, Endogenous TNFR1-SC pull-down by HA-IP in reconstituted Tnf-/-Hoil-1-/- MEFs ± HA-TNF for 15 min (n=2 independent experiments). TL: total lysate, NT: not treated, EV: empty vector. For gel source data (a,b,d,e,h,i), see Supplementary Figure 1.
Figure 3
Figure 3. Concomitant loss of MLKL and Caspase-8, but not loss of RIPK1 kinase activity or combined loss of RIPK3 and Caspase-8, promotes survival of LUBAC-deficient mice
a, Representative images of E10.5 (n=6 embryos/genotype), scale bar: 2 mm, E14.5 (n=12 Ripk1K45AHoil-1+/-, n=5 Ripk1K45AHoil-1-/- embryos/genotype) and E15.5 embryos (n=3 embryos/genotype). Scale bar: 5 mm. *: poor yolk sac vascularisation. b, f, Representative images of yolk sac vascularisation (PECAM-1, red) and apoptosis (cleaved (cl.) Caspase-3, green) at E14.5 (b) or E13.5 (f) and quantification. Mean ± s.e.m. and P values from unpaired two-tailed t-tests (b) or one-way ANOVA (f) are shown. Scale bar: 50 µm. c, FADD-IP in MEFs treated for 3 h with zVAD-fmk ± TNF (n=2 independent experiments). For gel source data, see Supplementary Figure 1. d, Cell death by PI incorporation in MEFs ± TNF (10 ng/ml) or LT-α. Mean ± s.e.m. (n=3 independent experiments) and P values (****P<0.0001) from two-way ANOVA are reported. NT: not treated. e, Representative images of E14.5 (n=11 Ripk3-/-Caspase-8-/-Hoil-1+/-, Ripk3-/-Caspase-8+/-Hoil-1-/- and n=7 Ripk3-/-Caspase-8-/-Hoil-1-/-) and E15.5 embryos (n=5 Ripk3-/-Caspase-8-/-Hoil-1+/-, n=4 Ripk3-/-Caspase-8+/-Hoil-1-/- and n=8 Ripk3-/-Caspase-8-/-Hoil-1-/-). *: poor yolk sac vascularisation. Scale bar: 5 mm. g, j, Mendelian frequencies obtained from inter-crossing Mlkl-/-Caspase-8+/-Hoil-1+/- with Mlkl-/-Caspase-8-/-Hoil-1+/- mice (g) or Mlkl+/-Ripk3-/-Caspase-8-/-Hoil-1+/- with Mlkl-/-Ripk3-/-Caspase-8-/-Hoil-1+/- mice (top) or Mlkl-/-Ripk3-/-Caspase-8-/-Hoil-1+/- mice (bottom) (j). *: dead embryos. h, i, Representative images of adult mice quantified in (g) for (h) or n=3 mice/genotype in (i). m: cpdm mutation.
Figure 4
Figure 4. Combined deletion of RIPK3 and Caspase-8 causes haematopoietic defects and RIPK1-dependent embryonic lethality in HOIL-1-deficient mice.
a, b, Number (No.) of the TER119+ (erythroid) cells (a) and enucleated erythrocytes/high-power field (HPF) (b) in E13.5 foetal livers with the indicated genotypes. Mean ± s.e.m. and P values from unpaired two-tailed t-tests are shown. c, Differentiation of E13.5 foetal liver (c-KIT+) progenitors into burst forming units-erythrocyte (BFU-E). Mean ± s.e.m. and P values from unpaired two-tailed t-tests are reported. d, Percentage of haematopoietic progenitors negative for mature lineage markers (Lin-) and SCA-1+c-KIT+ (LSK) and SCA-1-c-KIT+ (LK) in E13.5 foetal livers with the indicated genotypes. Mean ± s.e.m. and P values from unpaired two-tailed t-tests are reported. e, Mendelian frequencies obtained from inter-crossing Ripk1-/-Ripk3-/-Caspase-8-/-Hoil-1+/- mice. f, Representative images of mice of the indicated genotypes quantified in (e). g, Cytokine levels in embryo homogenates with the indicated genotypes. Mean ± s.e.m and P values from one-way ANOVA are reported.

References

    1. Shimizu Y, Taraborrelli L, Walczak H. Linear ubiquitination in immunity. Immunological reviews. 2015;266:190–207. doi: 10.1111/imr.12309. - DOI - PMC - PubMed
    1. Sasaki Y, et al. Defective immune responses in mice lacking LUBAC-mediated linear ubiquitination in B cells. EMBO J. 2013;32:2463–2476. doi: 10.1038/emboj.2013.184. - DOI - PMC - PubMed
    1. Emmerich CH, et al. Activation of the canonical IKK complex by K63/M1-linked hybrid ubiquitin chains. Proc Natl Acad Sci U S A. 2013;110:15247–15252. doi: 10.1073/pnas.1314715110. - DOI - PMC - PubMed
    1. Berger SB, et al. Cutting Edge: RIP1 kinase activity is dispensable for normal development but is a key regulator of inflammation in SHARPIN-deficient mice. J Immunol. 2014;192:5476–5480. doi: 10.4049/jimmunol.1400499. - DOI - PMC - PubMed
    1. Gerlach B, et al. Linear ubiquitination prevents inflammation and regulates immune signalling. Nature. 2011;471:591–596. doi: 10.1038/nature09816. - DOI - PubMed

Publication types

MeSH terms