. 2018 May;557(7703):43-49.
doi: 10.1038/s41586-018-0063-9. Epub 2018 Apr 25.

Genomic variation in 3,010 diverse accessions of Asian cultivated rice

Wensheng Wang  1 Ramil Mauleon  2 Zhiqiang Hu  1   3 Dmytro Chebotarov  2 Shuaishuai Tai  4 Zhichao Wu  1   5 Min Li  6   7 Tianqing Zheng  1 Roven Rommel Fuentes  2 Fan Zhang  1 Locedie Mansueto  2 Dario Copetti  2   8 Millicent Sanciangco  2 Kevin Christian Palis  2 Jianlong Xu  1   5   6 Chen Sun  3 Binying Fu  1   6 Hongliang Zhang  9 Yongming Gao  1   6 Xiuqin Zhao  1 Fei Shen  9 Xiao Cui  3 Hong Yu  10 Zichao Li  9 Miaolin Chen  3 Jeffrey Detras  2 Yongli Zhou  1   6 Xinyuan Zhang  5 Yue Zhao  3 Dave Kudrna  8 Chunchao Wang  1 Rui Li  3 Ben Jia  3 Jinyuan Lu  3 Xianchang He  3 Zhaotong Dong  3 Jiabao Xu  4 Yanhong Li  4 Miao Wang  4 Jianxin Shi  3 Jing Li  3 Dabing Zhang  3 Seunghee Lee  8 Wushu Hu  4 Alexander Poliakov  11 Inna Dubchak  11   12 Victor Jun Ulat  2 Frances Nikki Borja  2 John Robert Mendoza  13 Jauhar Ali  2 Jing Li  3 Qiang Gao  4 Yongchao Niu  4 Zhen Yue  4 Ma Elizabeth B Naredo  2 Jayson Talag  8 Xueqiang Wang  9 Jinjie Li  9 Xiaodong Fang  4 Ye Yin  4 Jean-Christophe Glaszmann  14   15 Jianwei Zhang  8 Jiayang Li  1   10 Ruaraidh Sackville Hamilton  2 Rod A Wing  16   17 Jue Ruan  18 Gengyun Zhang  19   20 Chaochun Wei  21   22 Nickolai Alexandrov  23 Kenneth L McNally  24 Zhikang Li  25   26 Hei Leung  2
Affiliations

Genomic variation in 3,010 diverse accessions of Asian cultivated rice

Wensheng Wang et al. Nature. 2018 May.

Abstract

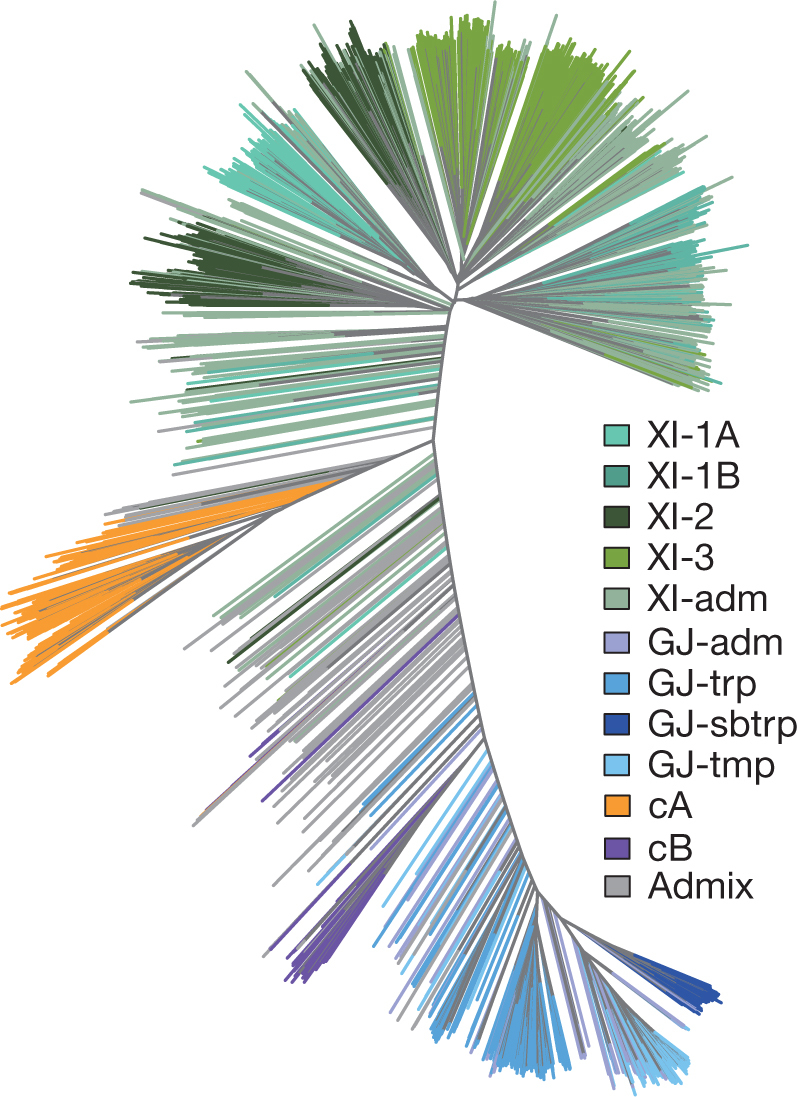
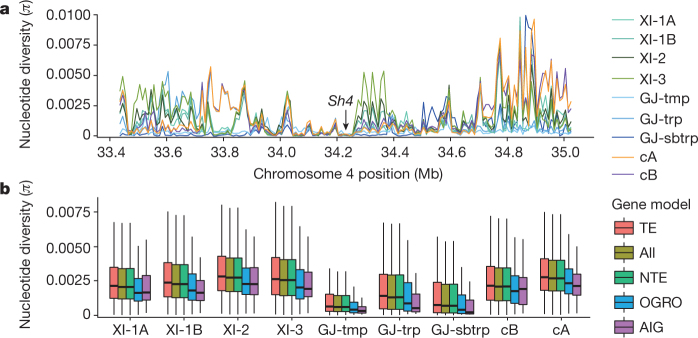
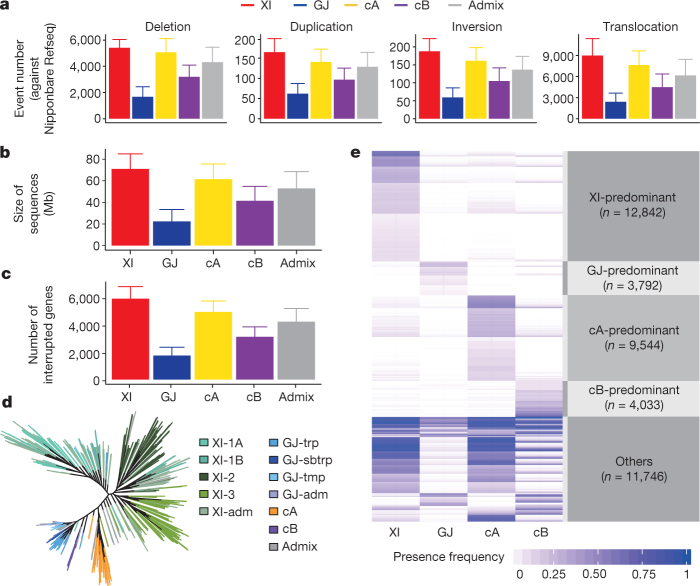
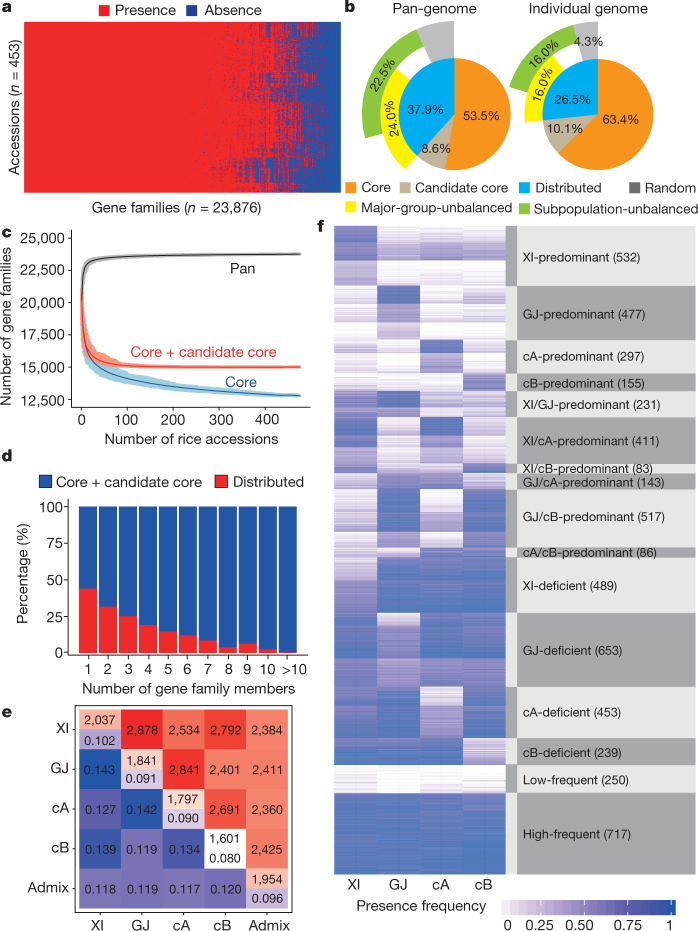
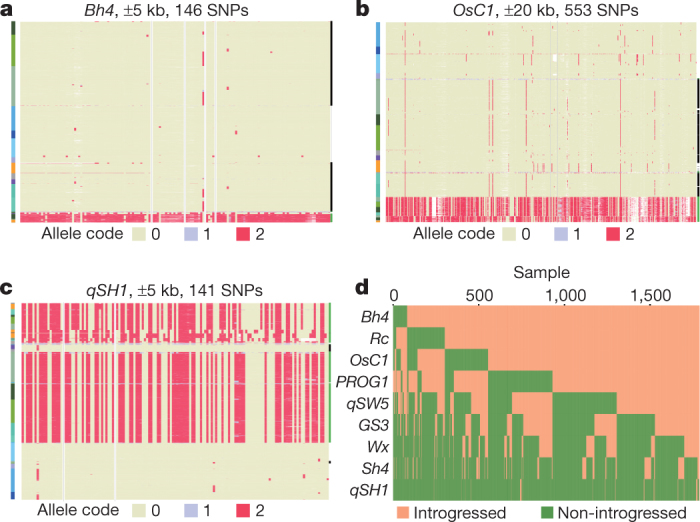
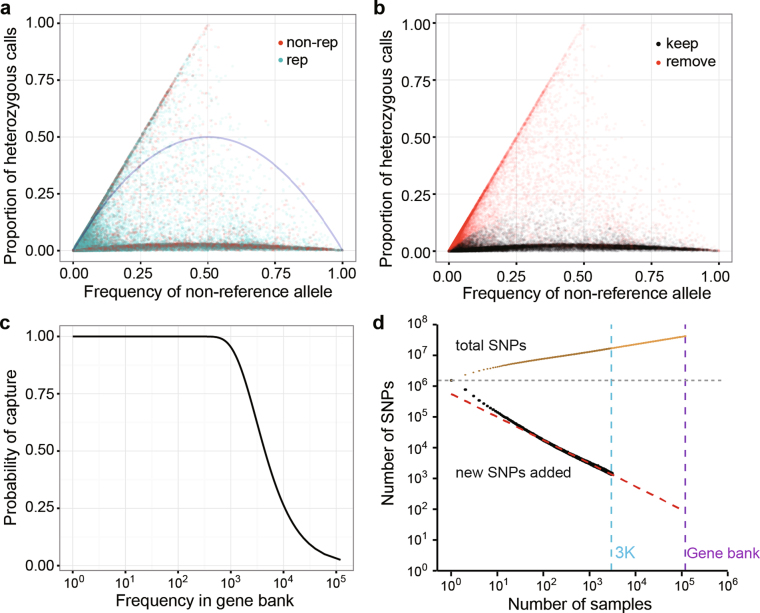
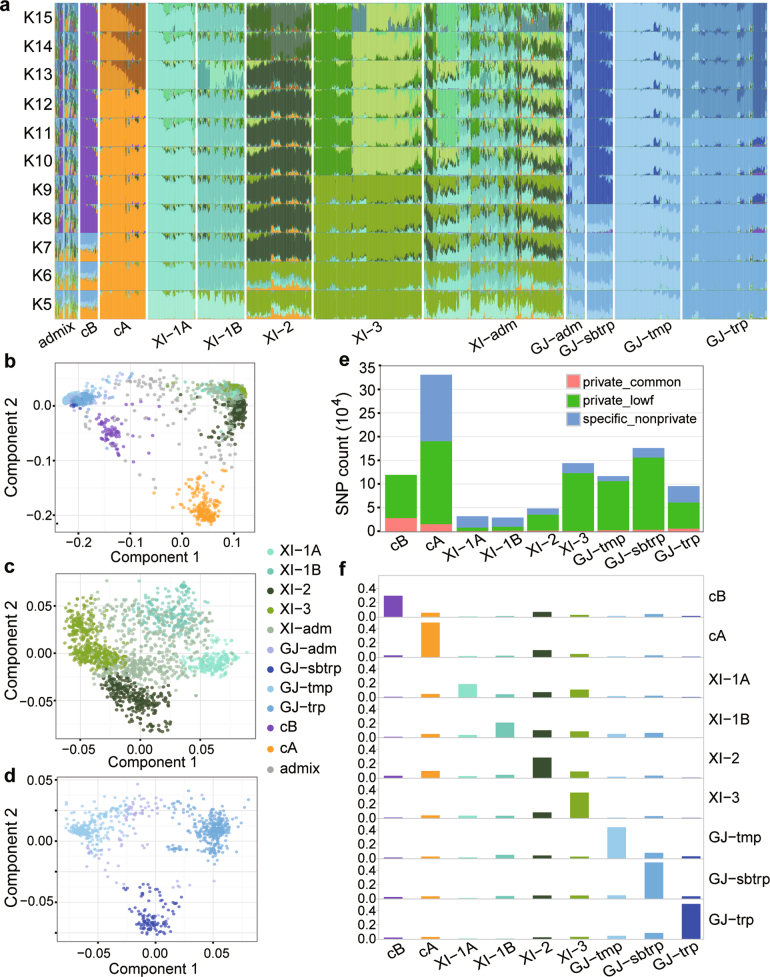
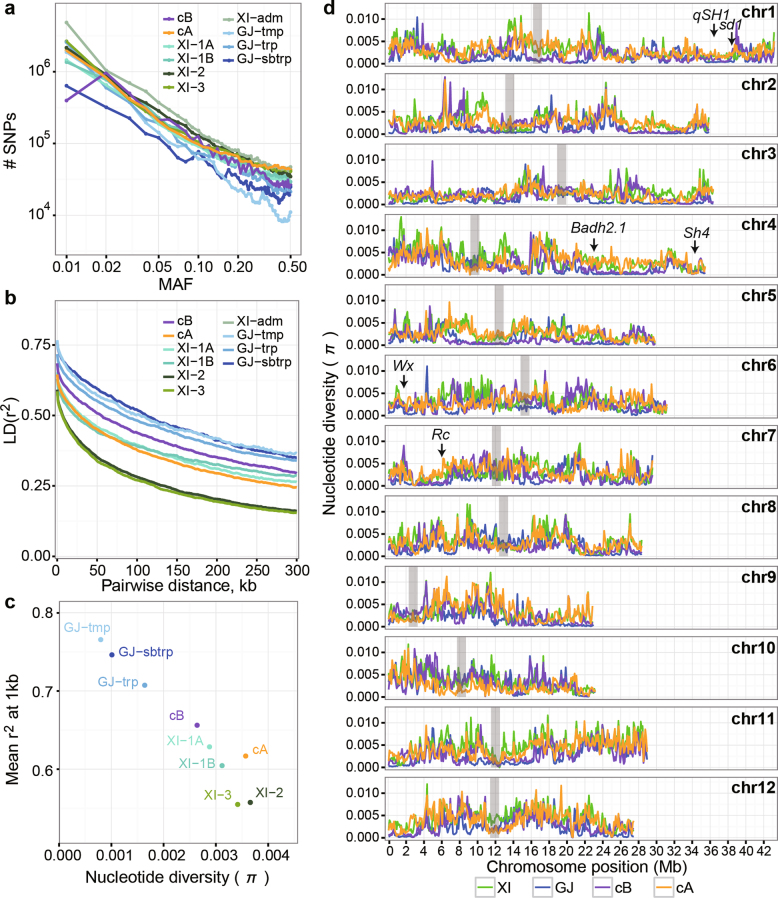
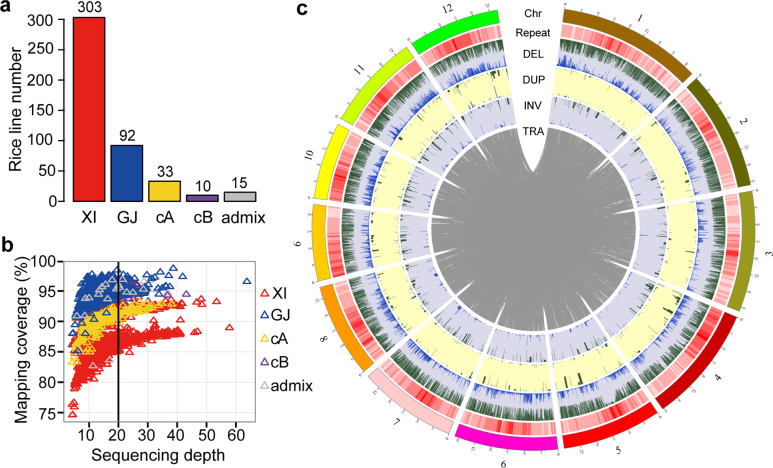
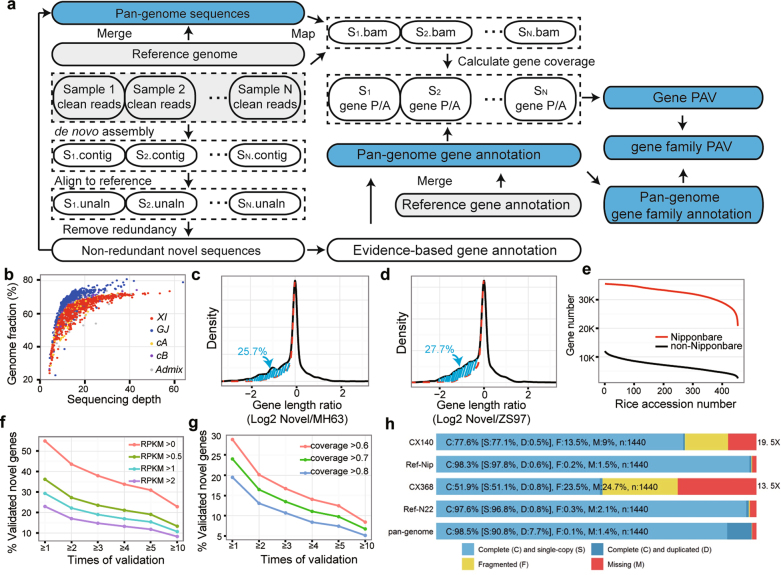
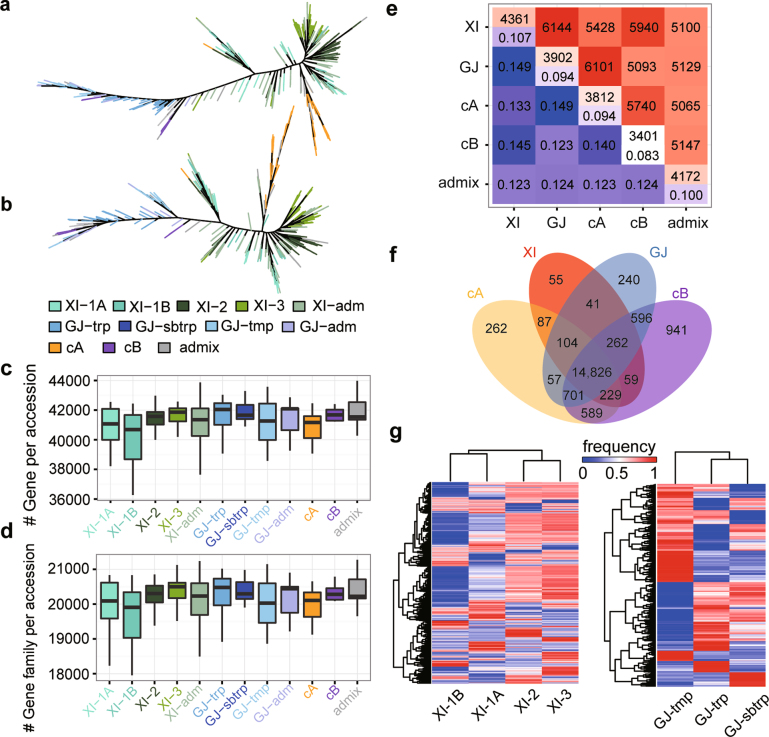
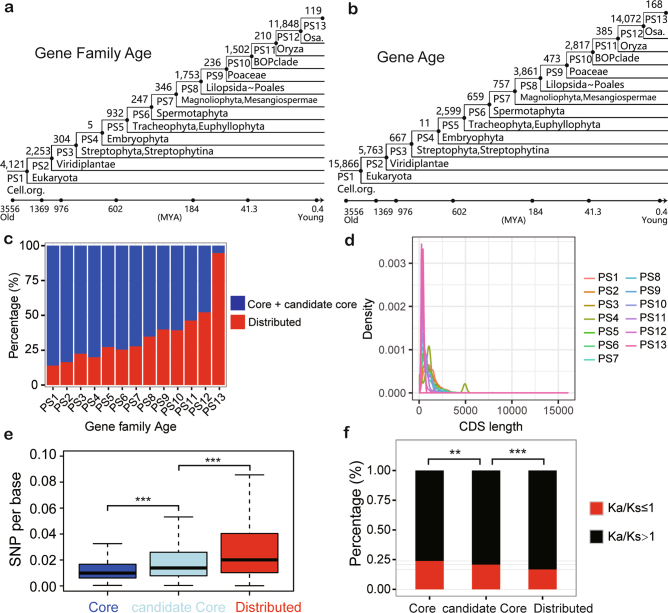
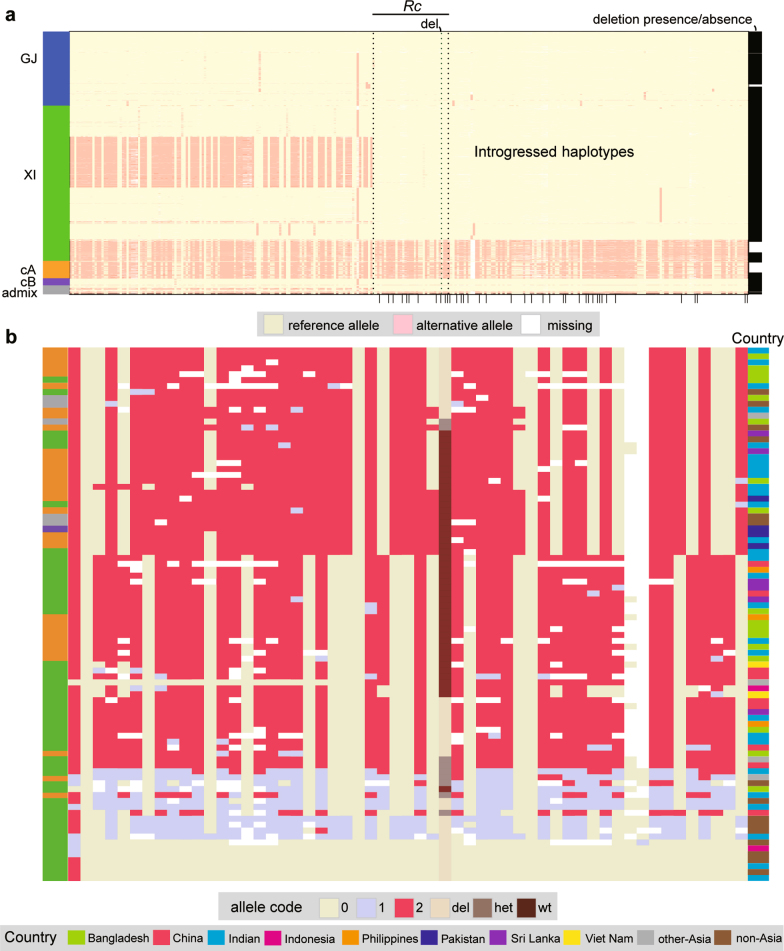
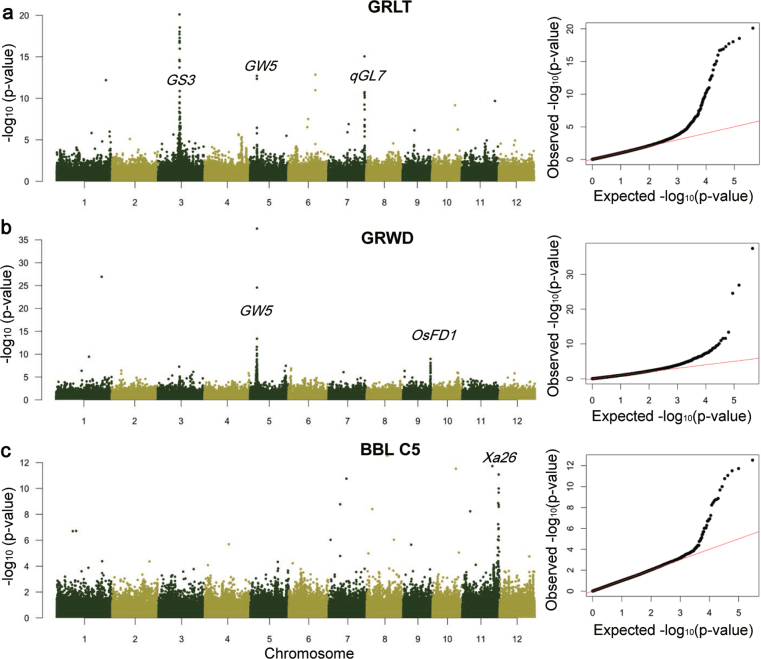
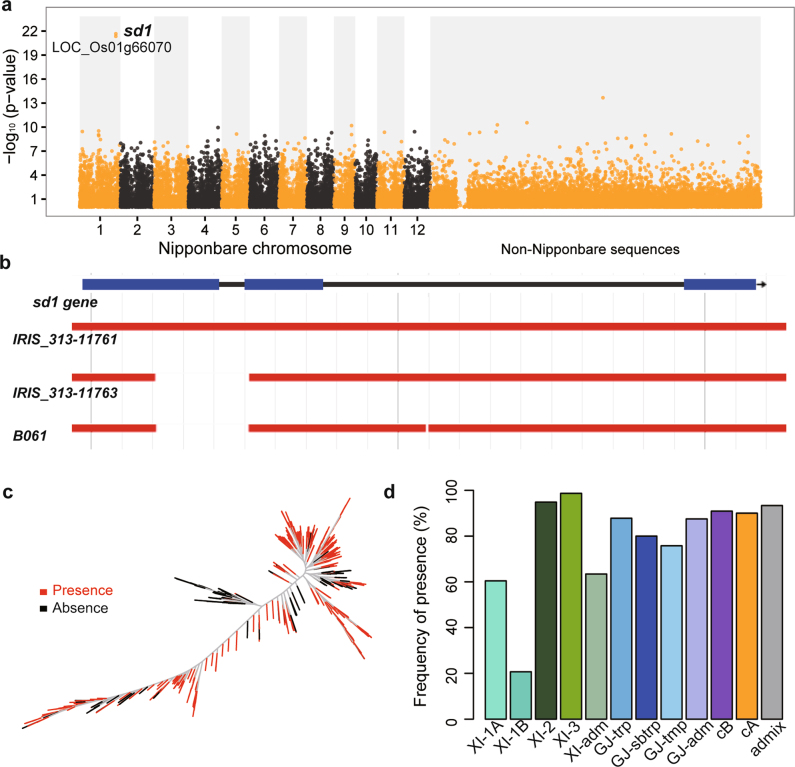
Here we analyse genetic variation, population structure and diversity among 3,010 diverse Asian cultivated rice (Oryza sativa L.) genomes from the 3,000 Rice Genomes Project. Our results are consistent with the five major groups previously recognized, but also suggest several unreported subpopulations that correlate with geographic location. We identified 29 million single nucleotide polymorphisms, 2.4 million small indels and over 90,000 structural variations that contribute to within- and between-population variation. Using pan-genome analyses, we identified more than 10,000 novel full-length protein-coding genes and a high number of presence-absence variations. The complex patterns of introgression observed in domestication genes are consistent with multiple independent rice domestication events. The public availability of data from the 3,000 Rice Genomes Project provides a resource for rice genomics research and breeding.


Conflict of interest statement

The authors declare no competing interests.

Figures

Fig. 1
Fig. 1. Unweighted neighbour-joining tree based on 3,010 samples and computed on a simple matching distance matrix for filtered SNPs.
Samples are coloured by their assignment to k = 9 subpopulations from ADMIXTURE.
Fig. 2
Fig. 2. Nucleotide diversity.
a, Differential nucleotide diversity between subpopulations at the Sh4 locus on chromosome 4 using 10-kb sliding windows. b, Box plots of the distribution of π in 100-kb regions surrounding gene models across the genome. Box plots are shown for k = 9 subpopulations for all 100-kb windows (All) (n = 3,728 in total) and those containing genes annotated as transposable elements (TE) (n = 3,305 windows), NTE (n = 3,709), from the OGRO/QTARO database (OGRO) (n = 828) and the subset of 78 domestication-related genes (AIG) (n = 61 windows). Box plots show the median, box edges represent the first and third quartiles, and the whiskers extend to farthest data points within 1.5× interquartile range outside box edges.
Fig. 3
Fig. 3. Summary of SVs for the 453 high-coverage rice accessions.
a, Number of deletions, duplications, inversions and translocations. b, Genome sizes affected by SVs. c, Numbers of genes affected (included or interrupted) by the SVs. d, Phylogenetic relationship of 453 rice accessions built from 10,000 randomly selected SVs. e, Characterization of the 42,207 major-group-unbalanced SVs unevenly distributed among XI, GJ, cA and cB on the basis of two-sided Fisher’s exact tests. Bar plots in a–c are mean ± s.d. and numbers of accessions in XI, GJ, cA, cB and admix are 303, 92, 33, 10 and 15, respectively.
Fig. 4
Fig. 4. Pan-genome of O. sativa.
a, Landscape of gene-family PAVs. Gene families were sorted by their occurrence and rice accessions were clustered with k-means method (k = 10). b, Compositions of the pan-genome and an individual genome. c, Simulation of the pan-genome and core genome based on 500 randomizations of rice genome orders. d, Proportions of the core and distributed gene families binned by gene family sizes. e, The average number of gene families that are different between two accessions. f, Characterization of 5,733 major-group-unbalanced gene families detected by two-sided Fisher’s exact tests.
Fig. 5
Fig. 5. Haplotype analyses and introgression.
a–c, Haplotypes around the domestication genes Bh4(a), OsC1(b) and qSH1(c). Rows correspond to samples and columns correspond to SNPs. Grey vertical lines mark the gene position. Left colour bar represents the k = 9 subpopulations. Right colour bar shows introgression status of the XI samples (green, no introgression; black, putative introgression from GJ). d, A heat map showing results of an introgression test of 1,789 XI samples at each of the nine domestication genes. y axis, genes; x axis, XI samples.
Extended Data Fig. 1
Extended Data Fig. 1. SNP filtering, discovery rate, and projected discovery upon further sequencing.
a, Proportion of heterozygous calls versus allele frequency. Each dot represents a SNP from a random sample of 100,000 SNPs. Blue curve shows theoretical Hardy–Weinberg equilibrium. The points have opacity of 5%, such that regions with higher point densities are highlighted. The bulk of SNPs lie on the Hardy–Weinberg equilibrium curve scaled by a factor of about 0.05, which implies a Wright’s inbreeding coefficient of F = 0.95. b, The same plot with colour representing the outcome of filtering. The SNPs that are marked ‘keep’ (black) form the base SNP set. c, The estimated proportion of gene bank SNPs captured by 3K-RG samples, per frequency. The 3,010 samples capture more than 99.99% of gene-bank SNPs of frequency greater than 0.25%. d, Projected new SNP discovery rate based on simulations. For a given number of samples (x axis), the graph shows estimated mean number of new SNPs discovered in the last sample.
Extended Data Fig. 2
Extended Data Fig. 2. Population structure and subpopulation differentiation.
a, ADMIXTURE analyses for k = 5 to k = 15. bd, Multidimensional scaling plots for all (n = 3,010) (b), XI (n = 1,786) (c) and GJ (n = 849) (d) accessions. e, Private and specific SNPs in each subpopulation. Private alleles are defined as being present in at least 4 accessions in a subpopulation and not found in other subpopulations; population-specific alleles are common in the subpopulation (≥20%) but of low frequency (<2%) in others. f, Doubleton sharing—that is, SNPs shared by two accessions—within and between subpopulations, with values normalized by the sample sizes.
Extended Data Fig. 3
Extended Data Fig. 3. Genetic diversity within subpopulations.
a, MAF histogram. b, Genome-wide linkage disequilibrium. c, Nucleotide diversity versus linkage disequilibrium. d, Diversity scans (π) for all chromosomes for major groups (XI, GJ, cA and cB) using 100-kb windows in which centromeric regions are highlighted in grey.
Extended Data Fig. 4
Extended Data Fig. 4. Selection of high-depth accessions and summary of SVs.
a, Number of accessions with sequencing depths ≥ 20× and mapping depth ≥ 15×. b, Mapping coverage of the 3,010 rice genomes to the Nipponbare RefSeq as a function of sequence depth. c, Circular presentation of different types of structural variation detected in 453 high-coverage rice genomes when compared against the Nipponbare RefSeq. Chr, outermost circle represents 12 rice chromosomes with marks in Mb; Repeat, red heat map represents repeat content in 500-kb windows; DEL, green/blue colour with inner/outer bars represents the average frequencies of deletions detected in XI and GJ; DUP, green/blue colour with inner/outer bars represents the average frequencies of duplications detected in XI and GJ; INV, green/blue colour with inner/outer bars represents the average frequencies of inversions detected in XI and GJ; TRA, grey colour represents translocations across each genome with an average frequency > 0.3 in either XI or GJ.
Extended Data Fig. 5
Extended Data Fig. 5. Map-to-pan strategy for rice pan-genome analyses.
a, Map-to-pan pipeline for pan-genome analyses: (1) pan-genome sequences were derived by combining Nipponbare RefSeq and de novo assembled non-redundant novel sequences; (2) gene annotations were derived by combining Nipponbare RefSeq annotations and evidence-based gene predictions on novel sequences; (3) reads from each sample were mapped to pan-genome sequences; and (4) gene presence or absence was determined by coverage of mapped reads. Raw data for this pipeline is shown in grey boxes and the main output is shown in blue. P/A: presence/absence. b, Proportions of assembled genomes as a function of the sequencing depth (based on the Nipponbare RefSeq). c, d, Gene-length differences between the novel pan-genome genes and genes derived from the genome of Minghui 63 (MH63) (c) or Zhenshan 97 (ZS97) (d). Generally, the distribution should be symmetric: a ratio of > 0 means the novel gene is longer and a ratio < 0 means the novel gene is shorter. The dashed red lines show the symmetric distributions of the >0 part and the blue regions show the gene proportion with shorter lengths. eg, Genomic (e) and transcriptomic (f, g) validation of novel genes. e, Validation based on genomic sequencing data, in which numbers of the Nipponbare RefSeq and non-Nipponbare RefSeq genes identified (>95% CDS coverage and >85% gene-body coverage) are shown against the numbers of supporting rice accessions in the 453 rice lines; f, g, Validation based on the mapping rates of the publicly available RNA sequencing data of rice, including gene expression (f) and coverage of the coding sequence (g). h, BUSCO evaluation for 1,440 highly conserved genes; CX140, the assembly of Illumina sequencing data of Nipponbare accessions; Ref-Nip, Nipponbare RefSeq. CX368, the assembly of Illumina sequencing data of accession N 22; Ref-N22, assembly of N 22 PacBio sequencing data.
Extended Data Fig. 6
Extended Data Fig. 6. Representative enriched biological processes of core and distributed gene families.
a, b, Representative enriched biological processes of core (a) and distributed gene families (b) are shown, with all terms sorted by their enriched P values (red bars). One-sided hypergeometric test built in the GOstats R package was used to calculate the P value of each GO term. The numbers of gene families involved in each GO term are shown in blue.
Extended Data Fig. 7
Extended Data Fig. 7. Characterization of gene or gene family presence or absence variations.
a, b, Phylogenetic trees of the 453 rice accessions constructed on the basis of the presence or absence of the distributed genes (a) and gene families (b); both of which classified the 453 accessions into two major groups (XI and GJ), with each being further divided into several subpopulations that are tagged with different colours representing their classifications based on the SNP. c, d, Gene (c) or gene family (d) numbers per accession in different subpopulations; gene or gene family numbers were significantly different among XI subpopulations (Kruskal–Wallis tests, P value = 9.8 × 10−8 (gene) or 1.0 × 10−6 (gene family)). Box plots show the median, box edges represent the first and third quartiles and the whiskers extend to 1.5× interquartile range. e, The average number of genes that are different between two accessions in which all combinations of the 453 accessions were considered, and the proportions were calculated as the number of such differentiating genes adjusted by the gene numbers held in common by the two genome types. f, Venn diagram of the numbers of the core + candidate core gene families among the major groups of O. sativa. g, Cluster analysis of 4,270 XI-subpopulation-unbalanced gene families and 1,384 GJ-subpopulation-unbalanced gene families.
Extended Data Fig. 8
Extended Data Fig. 8. Evolution of the pan-genome of O.sativa.
ab, The numbers of gene families (a) and genes (b) that emerged at different evolutionary times, from PS1 (single-cell organisms) to PS13 (O. sativa). c, The age distribution of the core and distributed gene families. d, Coding sequence length distribution for Nipponbare RefSeq genes with different ages. e, f, SNP variation of the core and distributed genes against the Nipponbare RefSeq. e, The density of SNPs in the coding region of core and distributed genes in the 3,010 rice lines; SNP density in core genes is lower than that in candidate core genes (two-sided Wilcoxon test) and SNP density in candidate core genes is lower than that in distributed genes (two-sided Wilcoxon test). Box plots show the median, box edges represent the first and third quartiles, and the whiskers extend to 1.5× interquartile range. f, Ka/Ks of the core and distributed genes. After removing genes with no synonymous SNPs, there are 3,144 core, 455 candidate core and 800 distributed genes with Ka/Ks > 1 and 10,005 core, 1,727 candidate core and 3,957 distributed genes with Ka/Ks < 1. Two sided χ-square tests were used to determine the difference of the proportions. **P < 0.01, ***P < 0.001.
Extended Data Fig. 9
Extended Data Fig. 9. Haplotypes around the red pericarp (Rc) gene.
Rows correspond to samples and columns correspond to SNPs. The colour of the rectangle denotes the number of non-Nipponbare alleles in a genotype. a, Haplotypes of 3,010 samples in a region ±25 kb around Rc show the presence of many distinctly non-GJ haplotypes that carry either the wild-type or domesticated allele at the causative deletion site. b, Zoomed-in view of a subset of 90 samples and 53 SNPs within the Rc gene and 15-kb downstream highlights the wide dispersal of non-GJ domesticated haplotypes.
Extended Data Fig. 10
Extended Data Fig. 10. Genome-wide association for grain length, grain width and bacterial blight isolate C5.
ac, GWAS for grain length (GRLT, n = 2,012) (a), grain width (GRWD, n = 2,012) (b) and bacterial blight isolate C5 (BBL C5, n = 381) (c). GWAS was performed using filtered and linkage disequilibrium-pruned SNPs for historical trait data on source accessions for grain length and grain width (223,743 SNPs) and for newly acquired lesion length data for bacterial blight isolate C5 (148,999 SNPs). Manhattan plots for linkage disequilibrium-pruned datasets are shown to the left and quartile–quartile plots for expected versus observed −log(P) values to the right. Major peaks are annotated for known gene loci.
Extended Data Fig. 11
Extended Data Fig. 11. sd1 gene and its correlation with plant height.
a, The plot shows the correlation of the gene presence or absence variation with plant height (n = 323). The P values were calculated with Spearman’s correlation. b, Examples show that semi-dwarfism results from an approximately 385-bp deletion in the sd1 locus. c, Distribution of the presence or absence of the sd1 gene in the 453 rice accessions. d, sd1 frequencies in rice subpopulations.

References

    1. Seck PA, Diagne A, Mohanty S, Wopereis MC. Crops that feed the world 7: rice. Food Secur. 2012;4:7–24. doi: 10.1007/s12571-012-0168-1. - DOI
    1. Huang X, et al. A map of rice genome variation reveals the origin of cultivated rice. Nature. 2012;490:497–501. doi: 10.1038/nature11532. - DOI - PMC - PubMed
    1. Li LF, Li YL, Jia Y, Caicedo AL, Olsen KM. Signatures of adaptation in the weedy rice genome. Nat. Genet. 2017;49:811–814. doi: 10.1038/ng.3825. - DOI - PubMed
    1. Wang H, Vieira FG, Crawford JE, Chu C, Nielsen R. Asian wild rice is a hybrid swarm with extensive gene flow and feralization from domesticated rice. Genome Res. 2017;27:1029–1038. doi: 10.1101/gr.204800.116. - DOI - PMC - PubMed
    1. Ting Y. Origination of the rice cultivation in China. J. College of Agric. Sun Yat-Sen University. 1949;7:11–24.

Publication types