. 2018 May;557(7704):190-195.
doi: 10.1038/s41586-018-0062-x. Epub 2018 Apr 25.

Cryo-EM structure of substrate-bound human telomerase holoenzyme

Affiliations

Cryo-EM structure of substrate-bound human telomerase holoenzyme

Thi Hoang Duong Nguyen et al. Nature. 2018 May.

Abstract

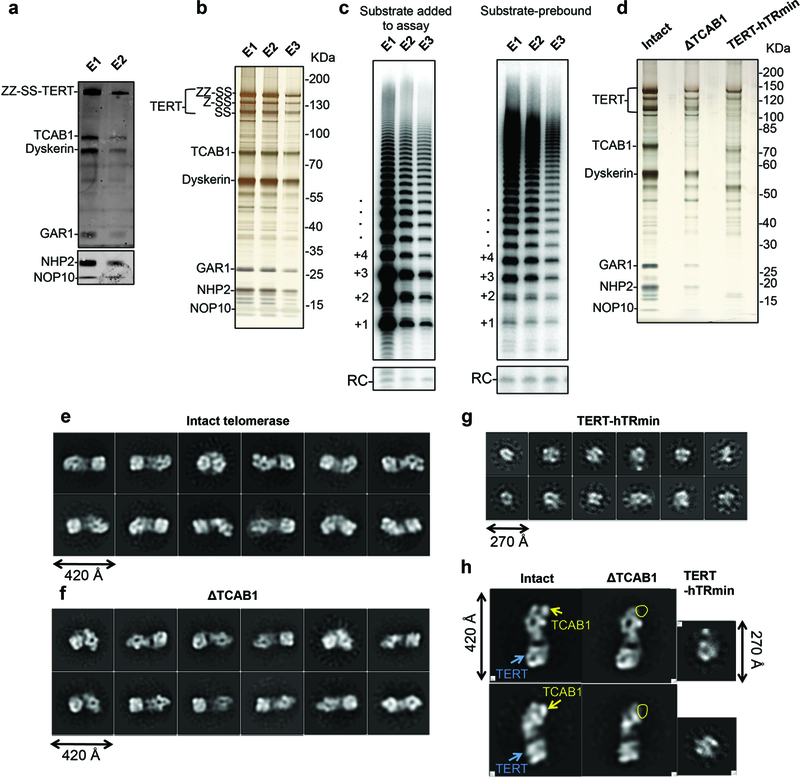
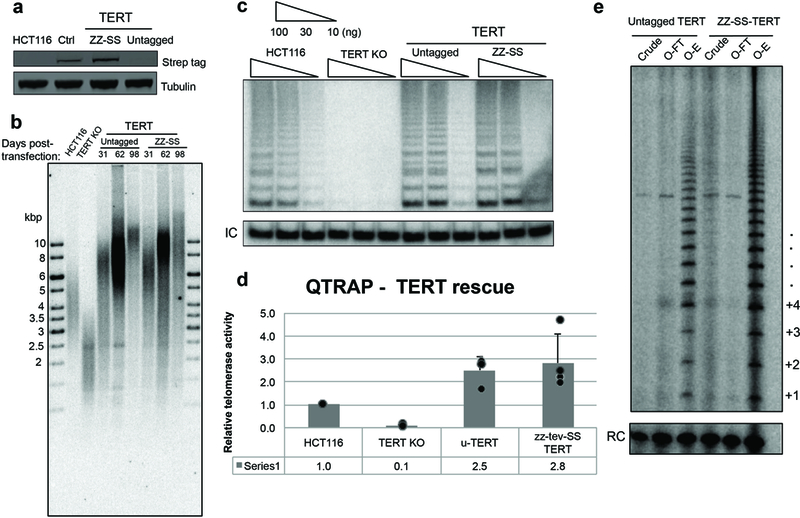
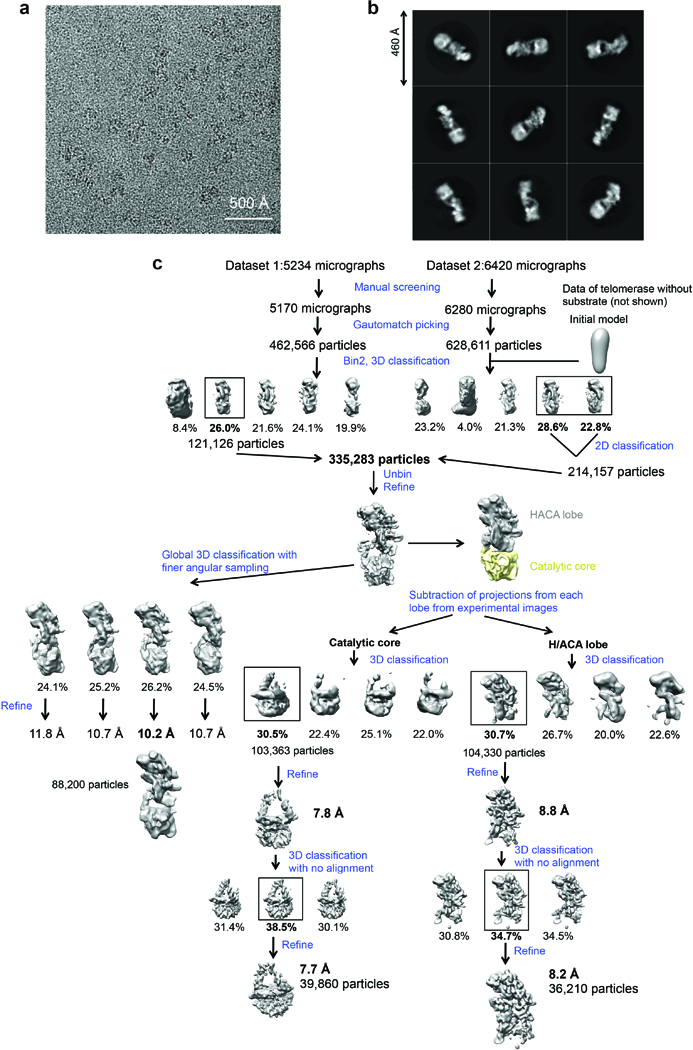
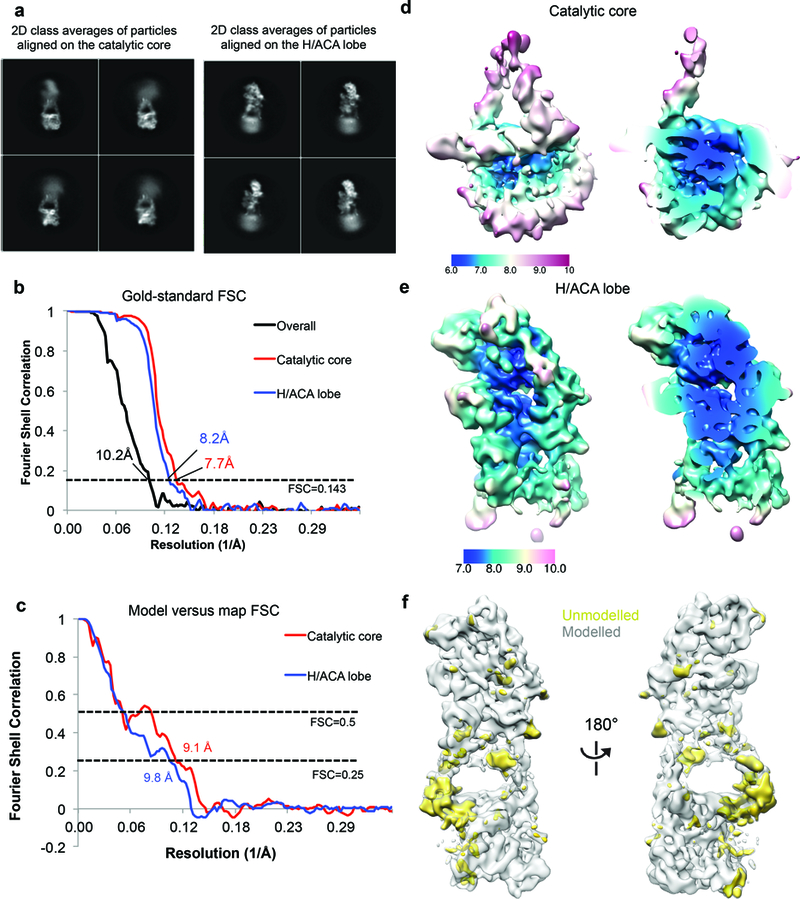
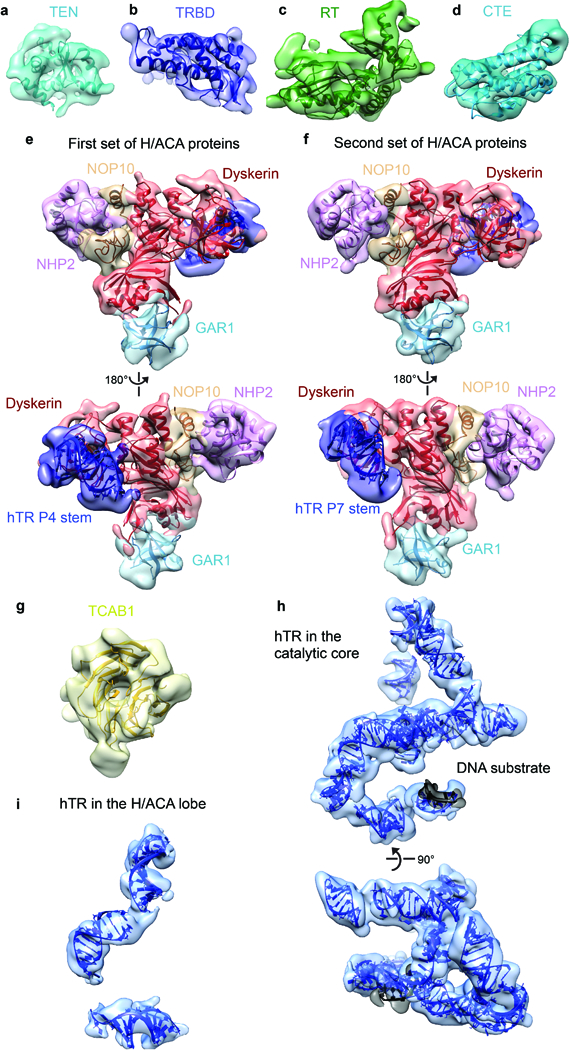
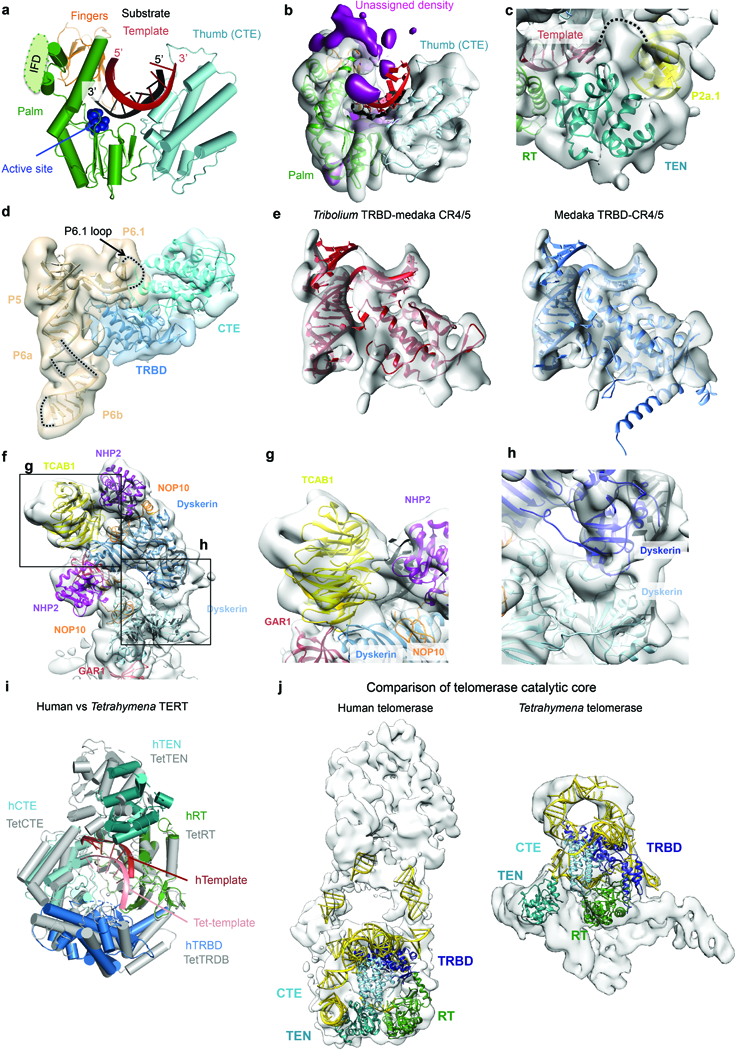
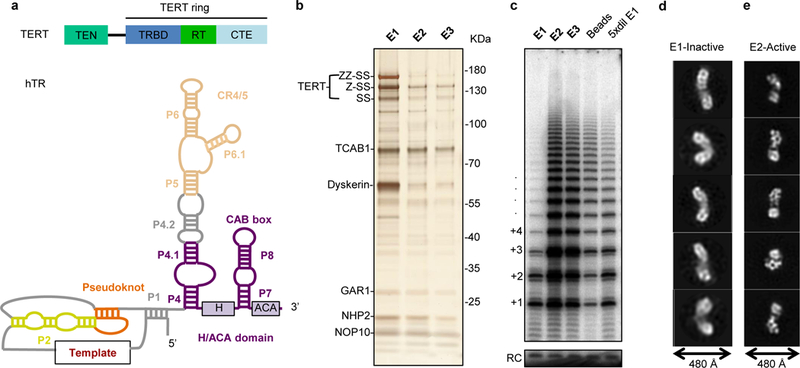
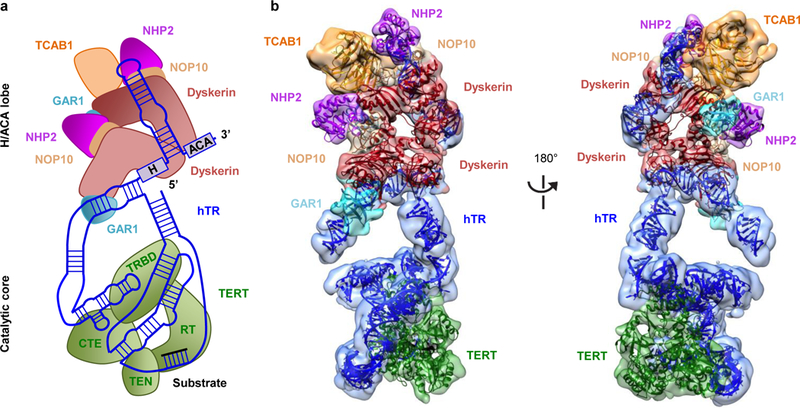
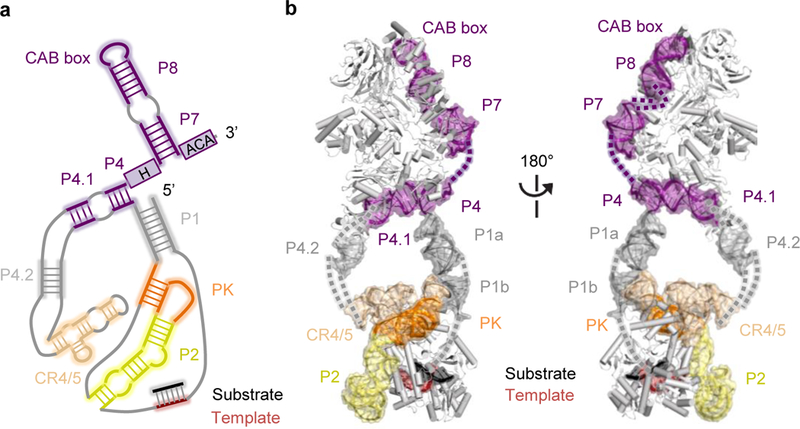
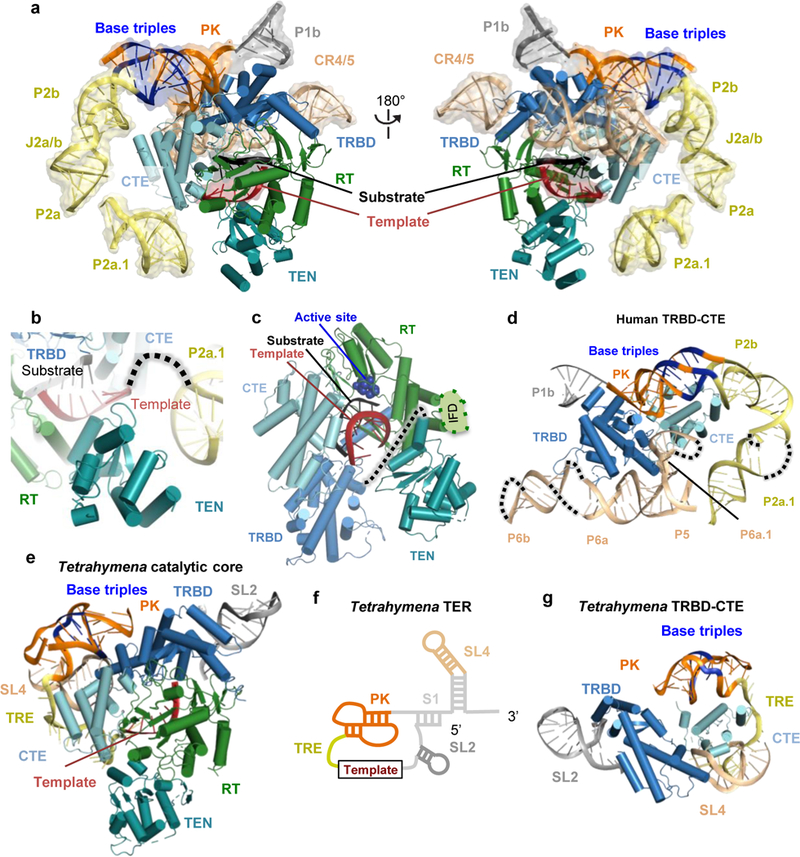
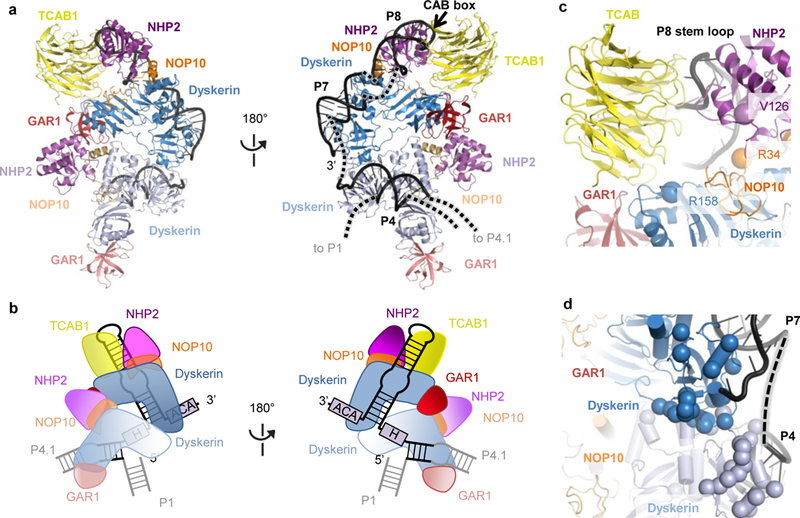
The enzyme telomerase adds telomeric repeats to chromosome ends to balance the loss of telomeres during genome replication. Telomerase regulation has been implicated in cancer, other human diseases, and ageing, but progress towards clinical manipulation of telomerase has been hampered by the lack of structural data. Here we present the cryo-electron microscopy structure of the substrate-bound human telomerase holoenzyme at subnanometre resolution, showing two flexibly RNA-tethered lobes: the catalytic core with telomerase reverse transcriptase (TERT) and conserved motifs of telomerase RNA (hTR), and an H/ACA ribonucleoprotein (RNP). In the catalytic core, RNA encircles TERT, adopting a well-ordered tertiary structure with surprisingly limited protein-RNA interactions. The H/ACA RNP lobe comprises two sets of heterotetrameric H/ACA proteins and one Cajal body protein, TCAB1, representing a pioneering structure of a large eukaryotic family of ribosome and spliceosome biogenesis factors. Our findings provide a structural framework for understanding human telomerase disease mutations and represent an important step towards telomerase-related clinical therapeutics.


Figures

Extended Data Figure 1 |
Extended Data Figure 1 |. Protein identification by immunoblotting, enriching active telomerase, substrate pre-binding, and comparison of wild-type (WT), ΔTCAB1, and TERT-hTRmin RNPs.
a, Immunoblotting of TERT, TCAB1, dyskerin, GAR1, NHP2 and NOP10 in telomerase purified after CHAPS lysis protocol as shown in Fig. 1b. We used primary antibodies against each protein, except ZZ-SS-TERT, for which we used rabbit IgG. Due to the wide range of the molecular weights of the proteins in our sample, TERT, TCAB1, dyskerin and GAR1 were detected in one blot, while NHP2 and NOP10 were detected in a separate blot. The use of the same sample to probe all proteins was performed only once, but TERT, dyskerin and TCAB1 were also probed individually twice. b, Silver-stained SDS-PAGE gel of purified telomerase fractions obtained from adherent cells lysed using the hypotonic lysis method that enriches active telomerase. This experiment was repeated over five times with similar results. c, Direct primer-extension assays of the purified telomerase fractions shown in b, confirming that E1 is no longer inactive (left panel), and of the substrate-bound purified telomerase fractions with additional DNA substrate omitted from the assays (right panel). The activity observed confirmed that purified telomerase contains the DNA substrate. The activity assays with substrate added were repeated over five times and the activity assays with substrate pre-bound were repeated twice. All repeats showed similar results. d, Silver-stained SDS-PAGE gel of purified intact and ΔTCAB1 telomerase and TERT-hTRmin telomerase prepared for subunit assignments. This experiment was done only once to provide a direct comparison between these different purified telomerase complexes. e, f, g, Negative-stained 2D class averages of intact and ΔTCAB1 telomerase and TERT-hTRmin, respectively. h, Comparison of representative 2D class averages intact and ΔTCAB1 and TERT-hTRmin showing the inferred localization of TCAB1 and TERT. For gel source data, see Supplementary Figure 1.
Extended Data Figure 2 |
Extended Data Figure 2 |. Cellular function of the tagged TERT used for structural analysis.
a, Western blot detection of ZZ-SS-TERT in TERT knock-out (KO) cells rescued by untagged TERT or ZZ-SS-TERT expression. Whole-cell extracts were probed using Strep antibody. HCT116 is the parental cell line. Lysate prepared from HEK 293T cells transiently transfected with ZZ-SS-TERT and hTR was used as a positive control (Ctrl). Tubulin was detected as a loading control. This experiment was performed only once to confirm the success of ZZ-SS-TERT incorporation into the HCT116 TERT KO cells. b, Telomeric restriction fragment analysis of HCT116 parental cells, TERT KO cells (before senescence), and TERT KO cells rescued with untagged or ZZ-SS-TERT transgene. Transgene-expressing cells were sampled at 31, 62 and 98 days post-transfection with transgene vectors. This experiment was performed twice with similar results. c, TRAP assay detection of telomerase activity in HCT116 parental cells, TERT KO cells, and TERT KO cells rescued with untagged TERT or ZZ-SS-TERT transgene. Whole-cell extracts were normalized by total protein concentration and assayed at 100, 30 or 10 ng of total protein per reaction. IC is an internal control. This experiment was repeated four times with similar results. d, Quantification of Q-TRAP assay detection of telomerase activity in HCT parental cells, TERT KO cells and TERT KO cells rescued with untagged TERT or ZZ-SS-TERT transgene. Error bars were calculated by taking the standard deviation of the average ΔCt from four different time points. Data points were shown as overlays. e, Direct primer-extension assay of telomerase after template-complementary oligonucleotide purification from extracts of TERT KO cells rescued by untagged TERT or ZZ-SS-TERT transgene. Assays were performed on clarified cell lysate (crude), flow-through (O-FT) and elution (OE) using equivalent amounts of cell extract. This experiment was performed only once to re-confirm the results in c. For gel source data, see Supplementary Figure 1.
Extended Data Figure 3 |
Extended Data Figure 3 |. Image processing procedures.
a, Representative raw micrograph. We collected a total of 11,654 micrographs for this study. b, Representative 2D class averages obtained from reference-free 2D classification. c, Data processing strategy used in this study.
Extended Data Figure 4 |
Extended Data Figure 4 |. Resolution estimation and analysis of the flexibility of the complex.
a, Representative 2D class averages obtained from 2D classification without alignment of particles that were aligned on either the catalytic core or the H/ACA lobe. For both cases, the other lobe adopts a wide range of conformations, as illustrated by the blurriness of the density. b, FSC curves for the overall map and the maps of the catalytic core and H/ACA lobe resulting from focused classification with signal subtraction and gold-standard refinement. c, Model versus map FSC curves for the catalytic core and the H/ACA RNP. We fitted only homology models as rigid bodies into the map and did not perform model coordinate refinement due to the limited resolutions of the maps. Therefore, we used a lower FSC threshold of 0.25 for resolution estimates. d, e, Local resolution for the catalytic lobe (d) and the H/ACA lobe (e) estimated by RELION 2.0 (ref. 64). Most of the catalytic core is resolved at 6-8 Å while most of the H/ACA lobe is resolved at 7-9 Å. f, Front (left panel) and back (right panel) views of the reconstruction showing modeled (grey) and unmodelled (gold) density. Most of the unmodelled density corresponds to single stranded RNA regions or RNA bulges, and human protein extensions that cannot be built de novo at this resolution.
Extended Data Figure 5 |
Extended Data Figure 5 |. Fittings of proteins and RNA into the cryo-EM map.
a-d, Domains of TERT. a, The TEN domain from Tetrahymena (PDB 2B2A). b, The truncated medaka TRBD domain (PDB 4O26). c, d, The RT and CTE domains from Tribolium (PDB 3KYL). e, Front (top) and back (bottom) views of the 5’ hairpin set of H/ACA proteins (dyskerin, red; GAR1, cyan; NOP10, wheat; NHP2, pink) bound to P4 stem (dark blue) fit by the archaeal H/ACA RNP (PDB 2HVY). f, Front (top) and back (bottom) views of the 3’ hairpin set of H/ACA proteins using the same model and color scheme as e. g, Homology model of TCAB1 WD40 domain. h, Front (top) and bottom (bottom) views of hTR in the catalytic core. i, hTR in the H/ACA lobe.
Extended Data Figure 6 |
Extended Data Figure 6 |. Sequence alignment of TERT with secondary structure assignments based on known structures.
a, Sequence alignment of Tetrahymena and human TEN domains. The secondary structure assignments of the Tetrahymena TEN domain (PDB 2B2A) are shown above the aligned sequences. Regions removed prior to fitting are indicated with dashed lines below the sequences. b, Sequence alignment of the Tribolium, human and Tetrahymena TERT, with the latter two N-terminally truncated to match Tribolium. Secondary structure assignments of the Tribolium TERT are shown on top, with conserved motifs labeled in blue. Throughout the figure, the η symbol refers to a 310-helix. Strict β-turns and strict α-turns are displayed as TT and TTT. The three catalytic aspartic acids are indicated with black arrowheads. ESpript was used to generate this figure.
Extended Data Figure 7 |
Extended Data Figure 7 |. Selected protein-protein and protein-RNA interactions in telomerase holoenzyme and comparisons between human and Tetrahymena TERT.
a, Interactions between the RT and CTE domains of TERT and the substrate-template duplex. The RT domain is divided into two subdomains, the palm (green) and fingers (orange) that are commonly observed in retroviral reverse transcriptases. The CTE (cyan) is the putative thumb. The IFD insertion that is missing in the Tribolium TERT is indicated. b, Region of the cryo-EM reconstruction shown in a. Unassigned density close to the IFD insertion is highlighted in magenta. c, Cryo-EM density of the TEN domain in the same view as that in Fig. 4b. Connecting density is observed between the template region and the P2a.1 stem. d, Map of the CR4/5 three-way junction (wheat) and the nearby TERT domains highlighting the position of the P6.1 loop near the interface of the CTE (cyan) and TRBD (blue) domains of TERT. This loop was not ordered in medaka CR4/5 bound to the TRBD alone. e, Comparison of the Tribolium (left panel) and medaka TRBD (right panel) with the medaka CR4/5 domain of hTR,. Extensions of the medaka TRBD that did not fit the map were truncated for visualization. f, Cryo-EM map with H/ACA components fitted. Detailed views of regions boxed in f show TCAB1 interactions with dyskerin, GAR1 and the P8 stem-loop (g); and interactions between the two dyskerin molecules (h), where a cluster of DC mutations are found (Fig. 5d). i, Comparison of the human and Tetrahymena TERT superposed on the RT domain. Domains of human TERT are colored as in Fig. 1a, while Tetrahymena TERT is colored in grey. The bound human and Tetrahymena templates are colored in dark and light red, respectively. j, Comparison of human and Tetrahymena catalytic core fitted into the corresponding cryo-EM maps. Domains of TERT were colored as in Fig. 1a and TER is colored as yellow. We used the catalytic core and H/ACA lobe densities resulting from our focused classification/refinement for the human telomerase and the overall 9.4 Å Tetrahymena telomerase map (EMD-6442).
Extended Data Figure 8 |
Extended Data Figure 8 |. Sequence alignments of H/ACA proteins with secondary structure assignments based on known structures.
a-d, Sequence alignments of Pyrococcus furiosus (archaeal) and human Cbf5/dyskerin (a), GAR1 (b), NOP10 (c), and L7Ae/NHP2 (d). Secondary structure assignments displayed on the top are from the archaeal H/ACA RNP structure (PDB 2HVY). The η symbol refers to a 310-helix. Strict β-turns and strict α-turns are displayed as TT and TTT. Known human dyskeratosis congenita and Hoyeraal-Hreidarsson disease mutations in H/ACA proteins are indicated with arrowheads. Blue arrowheads indicate residues that can be mapped onto the archaeal structure and black arrowheads indicate residues that were not mapped. ESpript was used to generate this figure.
Figure 1 |
Figure 1 |. Telomerase holoenzyme reconstitution and characterization.
a, Domain architecture of TERT (top) and secondary structure of hTR. Paired stems (P) are shown compacted in length. b, Silver-stained SDS-PAGE gel showing fractionation of purified, heterogeneously active TERT RNP. Proteins were detected by mass spectrometry and immunoblotting (Extended Data Fig. 1a and Extended Data Table 1). c, In vitro telomerase assays performed on the three elution fractions shown in b, the beads after elution, and five-fold diluted E1. A 12 nucleotide (nt) oligo was used as recovery control (RC). Processive repeat additions are numbered. d, e, Representative negative-stain 2D class averages for fractions E1 and E2, respectively. We also observed a small fraction of E2-like particles in E1 (data not shown), while E2 contained predominantly the particles shown in e. Experiments in b and c were performed three times and twice, respectively, with similar results. For gel source data, see Supplementary Figure 1.
Figure 2 |
Figure 2 |. Cryo-EM structure of the substrate-bound human telomerase holoenzyme.
a, Schematic of subunit arrangements. b, Front (left panel) and back (right panel) views of the cryo-EM reconstructions for the H/ACA lobe at 8.2 Å and the catalytic core at 7.7 Å, with fitted subunits color-coded as indicated.
Figure 3 |
Figure 3 |. hTR structure in human telomerase holoenzyme.
a, Schematic of secondary structure of hTR, with domains arranged based on the cryo-EM reconstruction. Regions modeled are highlighted with soft-colored background. b, Front and back views of the structure of hTR highlighted within the human telomerase holoenzyme structure, with domains color-coded as in a and unmodelled connections shown as dashes.
Figure 4 |
Figure 4 |. Structure of the catalytic core.
a, Front (left panel) and back (right panel) views of the catalytic core. Domains of human TERT and hTR are color-coded as in Fig. 1a. hTR is in semi-transparent space-filling representation, and base-triples within the PK are indicated in blue. b, Route of single-stranded RNA connecting hTR P2a.1 and the template, which threads near the TEN domain. c, TERT interactions with the substrate-template duplex. Active site residues are shown as blue spheres. The human TERT IFD insertion missing in the Tribolium TERT is indicated between helices α10 and α11 of the Tribolium TERT (Extended Data Fig. 6b). A dotted line depicts the linker connection of TEN and TRBD domains. d, The human TRBD and CTE domains are encircled by hTR P2 (yellow) and PK (orange) and CR4/5 (wheat) domains. e, f, Architecture of Tetrahymena TERT domains with TER motif colors as indicated: PK, orange; template recognition element (TRE), yellow; SL2, dark grey; and SL4, wheat. Base-triples within the PK are indicated in blue. For clarity, domains of TER colored in light grey in f are not shown in the structure in e. g, The Tetrahymena TRBD and CTE domains are encircled by t/PK (orange), TRE (yellow), SL2 (grey) and part of SL4 (wheat). Base-triples with the PK are indicated in blue.
Figure 5 |
Figure 5 |. The H/ACA domain and disease mutations.
a, Front and back views of the H/ACA lobe within the human telomerase structure, with color-coded subunits: TCAB1, yellow; dyskerin, blue; GAR1, red; NOP10, orange; NHP2, magenta; hTR, black. To distinguish the two sets of the H/ACA proteins, the first set bound to the 5’ hairpin (P4 stem) is in lighter shade. b, Schematics of subunit arrangements within the H/ACA lobe. c, Interactions of TCAB1 with hTR and H/ACA proteins. The backbone amides of disease-associated mutations in dyskerin, NOP10 and NHP2 that mapped near TCAB1 and P8 interaction surfaces are highlighted as spheres. d, Mapping of a cluster of disease mutations (backbone amides shown as spheres) in dyskerin near the dyskerin-dyskerin and dyskerin-RNA interfaces.

Comment in

Similar articles

Cited by

References

    1. Arnoult N & Karlseder J Complex interactions between the DNA-damage response and mammalian telomeres. Nat. Struct. Mol. Biol. 22, 859–866 (2015). - PMC - PubMed
    1. Dosakni Y, de Lange T The role of double-strand break repair pathways at functional and dysfunctional telomeres. Cold Spring Harb. Perspect. Biol. 6, a016576. - PMC - PubMed
    1. Levy MZ, Allsopp RC, Futcher AB, Greider CW & Harley CB Telomere end-replication problem and cell aging. J. Mol. Biol. 225, 951–960 (1992). - PubMed
    1. Holohan B, Wright WE & Shay JW Telomeropathies: an emerging spectrum of disorder. J. Cell Biol. 205, 289–299 (2014) - PMC - PubMed
    1. Wegman-Ostrosky T & Savage SA The genomics of inherited bone marrow failure: from mechanism to the clinic. Br. J. Haematol. 177, 526–542 (2017). - PubMed

Publication types

MeSH terms