. 2018 Apr 11:9:476.
doi: 10.3389/fpls.2018.00476. eCollection 2018.

A Node-Expressed Transporter OsCCX2 Is Involved in Grain Cadmium Accumulation of Rice

Affiliations

A Node-Expressed Transporter OsCCX2 Is Involved in Grain Cadmium Accumulation of Rice

Xiaohua Hao et al. Front Plant Sci. .

Abstract

Excessive cadmium (Cd) accumulation in grains of rice (Oryza sativa L.) is a risk to food security. The transporters in the nodes of rice are involved in the distribution of mineral elements including toxic elements to different tissues such as grains. However, the mechanism of Cd accumulation in grains is largely unknown. Here, we report a node-expressed transporter gene, OsCCX2, a putative cation/calcium (Ca) exchanger, mediating Cd accumulation in the grains of rice. Knockout of OsCCX2 caused a remarkable reduction of Cd content in the grains. Further study showed that disruption of this gene led to a reduced root-to-shoot translocation ratio of Cd. Moreover, Cd distribution was also disturbed in different levels of internode and leaf. OsCCX2 is localized to plasma membrane, and OsCCX2 is mainly expressed in xylem region of vascular tissues at the nodes. OsCCX2 might function as an efflux transporter, responsible for Cd loading into xylem vessels. Therefore, our finding revealed a novel Cd transporter involved in grain Cd accumulation, possibly via a Ca transport pathway in the nodes of rice.

Keywords: Oryza sativa; cadmium accumulation; distribution; translocation; transporter.


Figures

FIGURE 1
FIGURE 1
Tissue expression pattern analyses of OsCCX2. (A) The semi-quantitative-RT-PCR analysis of OsCCX2 transcript levels. Data are representative values of three independent experiments. (B) The q-PCR analysis of OsCCX2 transcript levels in diverse tissues. Data are average values of three independent experiments and are presented as mean ± SD. (C) Histochemical GUS staining of OsCCX2 pro:GUS plants. (a–f) The maturation plant grown on soil. (a) The leaf sheath. (b) Node I. (c) Node II. (d) Node III. (e) Node IV. (f) Unelongated basal stem. (g) Four-day-old seedling grown on MS agar plates. (h) Two-week-old seedling grown in hydroponics. (D) Paraffin section of Node I. The GUS signal is shown in blue. (a) Cross slice of Node I. (b) Enlarged image of an EVB and a DVB in (a). (c) Longitudinal slice of Node I. Bar = 200 μm.
FIGURE 2
FIGURE 2
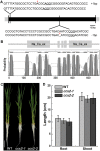
OsCCX2 structure analysis and ccx2 mutant generation. (A) Targeted mutagenesis of OsCCX2 gene by CRISPR-Cas9. Two independent gene edition sites were designed (NGG motifs underlined). Sequences of the mutant alleles are aligned to the genome sequence of wild type, and two homozygous mutant lines (ccx2-1 and ccx2-2) were obtained with 1 bp insertion and 1 bp deletion separately (shown by red arrows). (B) Schematic topology diagrams of OsCCX2. OsCCX2 protein with 12 transmembrane domains and two Na/Ca exchanger domains. (C,D) Seedlings of two homozygous mutant lines (ccx2-1 and ccx2-2). The germinated seeds were grown in hydroponic solution for 4 weeks (C), and the lengths of roots and shoots of the wild type and mutant plants were measured (n = 20 for each data point) (D). Data are average values of three independent experiments and are presented as mean ± SD. Bar = 3 cm (C).
FIGURE 3
FIGURE 3
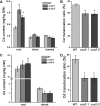
Cadmium content in different organs of rice. Nipponbare wild type rice and the ccx2-1 and ccx2-2 mutant lines were grown in Cd-containing paddy soil (3.9 mg/kg) till ripening. The Cd and other metal content in grains were detected. Data for Cd content and 1000-grain weight are average values of three independent experiments and are presented as mean ± SD. Significant differences are labeled “” (p < 0.05) or “∗∗” (p < 0.01). (A) The morphology of rice panicles. Bar = 2 cm. (B) The 1000-grain weight. (C) The content of Cd in brown rice of the mutant and wild type rice. (D) The content of other metals in brown.
FIGURE 4
FIGURE 4
Root-to-shoot translocation of Cd in plant. The plants were grown in paddy soil till booting, then Cd content of root, culm, and leaves was measured (A), and root-to-shoot translocation ratio of Cd was calculated (B). (C,D) 10-day-old seedlings were transplanted to Cd-containing (0.1 μM) hydroponic solution for 7 days. Cd content in root and shoot was measured (C), and Cd translocation ratio of shoot-to-root was calculated (D). Data are average values of three independent experiments and are presented as mean ±SD. Asterisks above the bars indicate significant difference (p < 0.05) compared with the WT rice.
FIGURE 5
FIGURE 5
Cd distribution in shoot tissues of rice. The ccx2-1 mutant line and the wild type control were grown in Cd-containing paddy soil (3.9 mg/kg) till ripening. Different tissues of the shoot were separated, including brown, husk, branch, each internode, and each leaf. The Cd content was determined and the distribution ratios were calculated. Three independent experiments were performed, and values represent means ±SD. Asterisks above the bars indicate significant difference (p < 0.05). (A,B) The Cd content in the shoot tissues, including brown, husk, branch, each internode, and each leaf (labeled I to “below” from top to bottom). (C,D) The Cd distribution ratios of the shoot tissues.
FIGURE 6
FIGURE 6
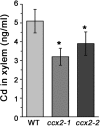
Cd content in xylem sap. The ccx2-1 and ccx2-2 mutant lines and the wild type control were grown in Cd-containing paddy soil (1.2 mg/kg) till grain-filling initiation, and then the xylem sap was collected from a cut in the middle of the uppermost internode. Data are average values of three independent experiments and are presented as mean ±SD. Asterisks above the bars indicate significant differences (p < 0.05) compared with the WT rice.
FIGURE 7
FIGURE 7
Cd analysis in OsCCX2-expressing yeast cells and in cell sap of the ccx2 plant. (A) Cadmium tolerance of yeast cells expressing OsCCX2. Yeast liquid cultures were grown and adjusted to an optical density of 0.5 at OD600, and 5 μl aliquots of serial dilutions (10-1,10-2, 10-3, and 10-4) were plated onto SD-Ura medium without CdCl2 (the upper two rows), or containing certain concentrations of CdCl2 (10 μM for the middle two rows and 20 μM for the bottom two rows). The plates were further incubated at 30°C for 3 days (left panels) and 4 days (right panels), respectively. The ycf1 mutants were transformed pYES2 empty vector or pYES2-OsCCX2. Data are representative values of three independent experiments. (B) Cd content of transformants grown on CdCl2-containing media. The pYES2-OsCCX2 and pYES2 empty vectors were transformed into wild type yeast BY4741, respectively. The transformants were grown on SD liquid cultures for 24 h (containing 1, 2, 5, and 10 μM CdCl2, respectively), and the Cd content was determined. Data are average values of three independent experiments and are presented as mean ± SD. (C,D) Two-week-old seedlings were transplanted to 5 μM Cd-containing hydroponic solution, and the shoots and roots were collected at 1, 2, 3, 4, 5, 6, and 7 days. The shoot and the root were homogenized and subcellular fractions were separated by using differential centrifugation techniques. Data are average values of three independent experiments and are presented as mean ±SD.
FIGURE 8
FIGURE 8
Subcellular localization of OsCCX2. The OsCCX2 coding sequence was fused to the N terminus of the GFP coding region in the pCambia2300 and pCambia1302 vector separately, and then transformed into Arabidopsis mesophyll protoplasts and wild type Nipponbare, respectively. The empty vector pCambia2300-transformed protoplasts were used as the control. The fluorescent signals were imaged by using an LSM710 confocal laser scanning microscope. Bars = 10 μm. (A) OsCCX2-GFP signal in Arabidopsis mesophyll protoplasts. The green signals were from GFP, and the red signals were from chloroplasts. (B) OsCCX2-GFP signal in root tip cells of Nipponbare rice. The green fluorescence came from GFP signals, and the red signals were from plasma membrane-specific fluorescent dye FM4-64. The yellow signals were merges of the green and red signals.

Similar articles

Cited by

References

    1. Buha A., Wallace D., Matovic V., Schweitzer A., Oluic B., Micic D., et al. (2017). Cadmium exposure as a putative risk factor for the development of pancreatic cancer: three different lines of evidence. Biomed. Res. Int. 8:8. 10.1155/2017/1981837 - DOI - PMC - PubMed
    1. Cai X., Lytton J. (2004). The cation/Ca(2+) exchanger superfamily: phylogenetic analysis and structural implications. Mol. Biol. Evol. 21 1692–1703. 10.1093/molbev/msh177 - DOI - PubMed
    1. Clemens S., Aarts M. G. M., Thomine S., Verbruggen N. (2013). Plant science: the key to preventing slow cadmium poisoning. Trends Plant Sci. 18 92–99. 10.1016/j.tplants.2012.08.003 - DOI - PubMed
    1. Emery L., Whelan S., Hirschi K. D., Pittman J. K. (2012). Protein phylogenetic analysis of Ca2+/cation antiporters and insights into their evolution in plants. Front. Plant Sci. 3:1. 10.3389/fpls.2012.00001 - DOI - PMC - PubMed
    1. Feki-Tounsi M., Hamza-Chaffai A. (2014). Cadmium as a possible cause of bladder cancer: a review of accumulated evidence. Environ. Sci. Pollut. Res. 21 10561–10573. 10.1007/s11356-014-2970-0 - DOI - PubMed

LinkOut - more resources