. 2018 Mar 22;7(1):1454776.
doi: 10.1080/20013078.2018.1454776. eCollection 2018.

Improved resolution in extracellular vesicle populations using 405 instead of 488 nm side scatter

Affiliations

Improved resolution in extracellular vesicle populations using 405 instead of 488 nm side scatter

Mark J McVey et al. J Extracell Vesicles. .

Abstract

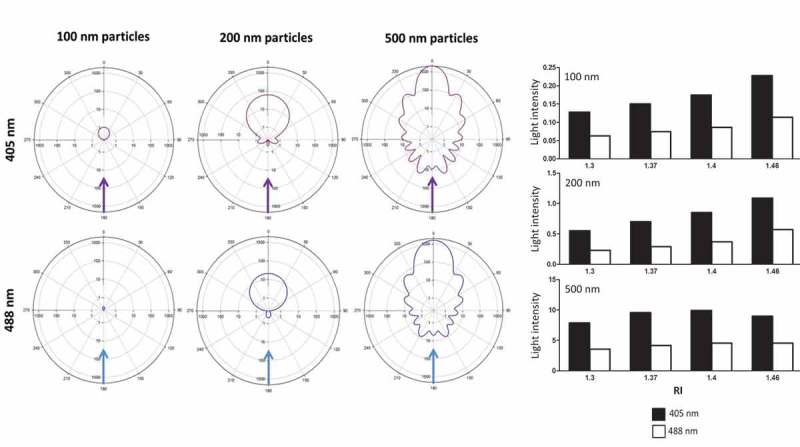
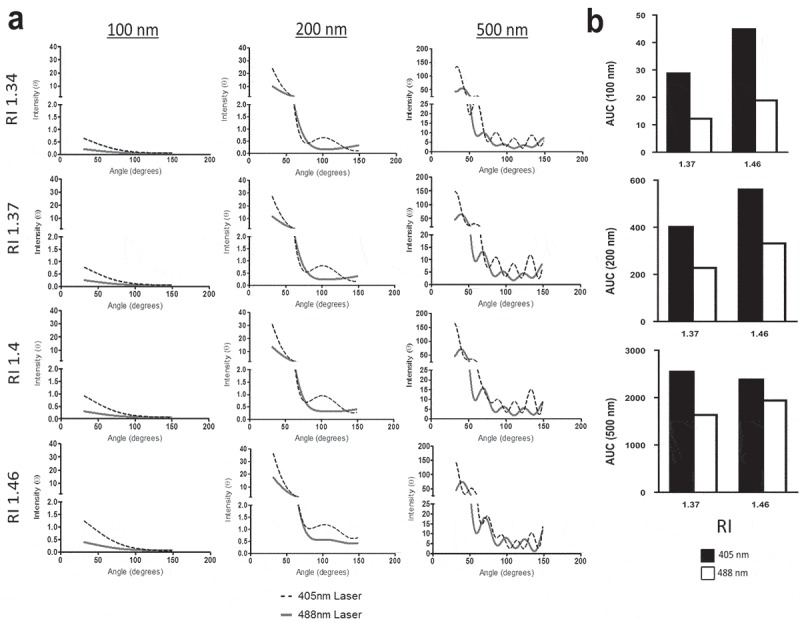
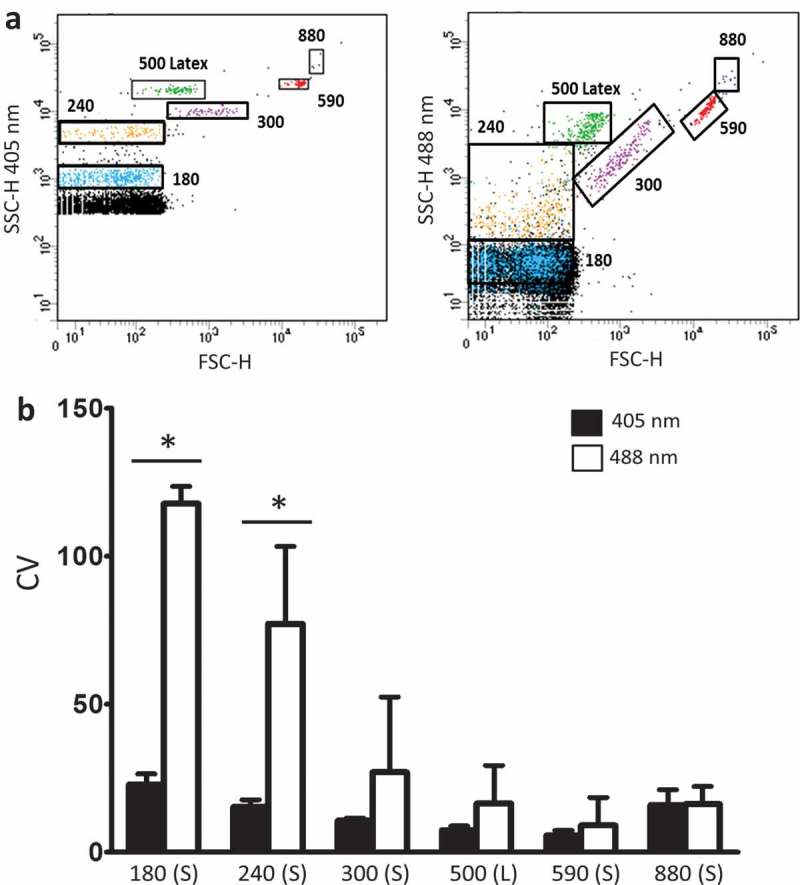
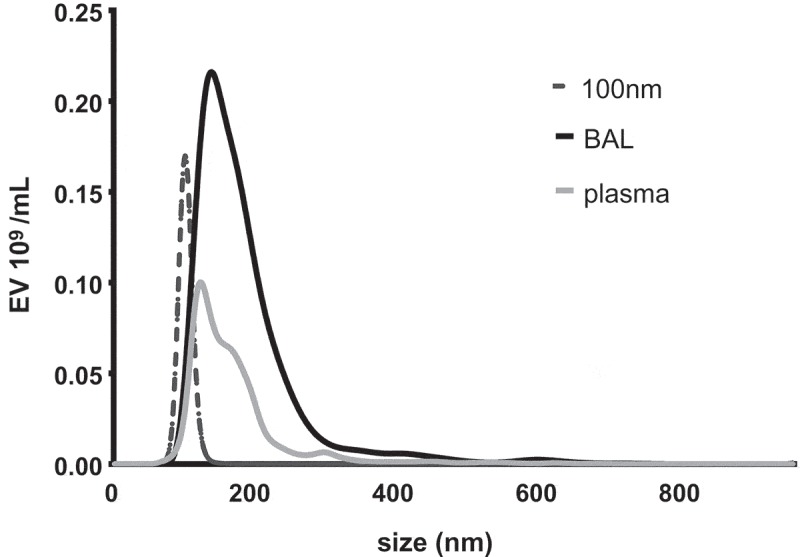
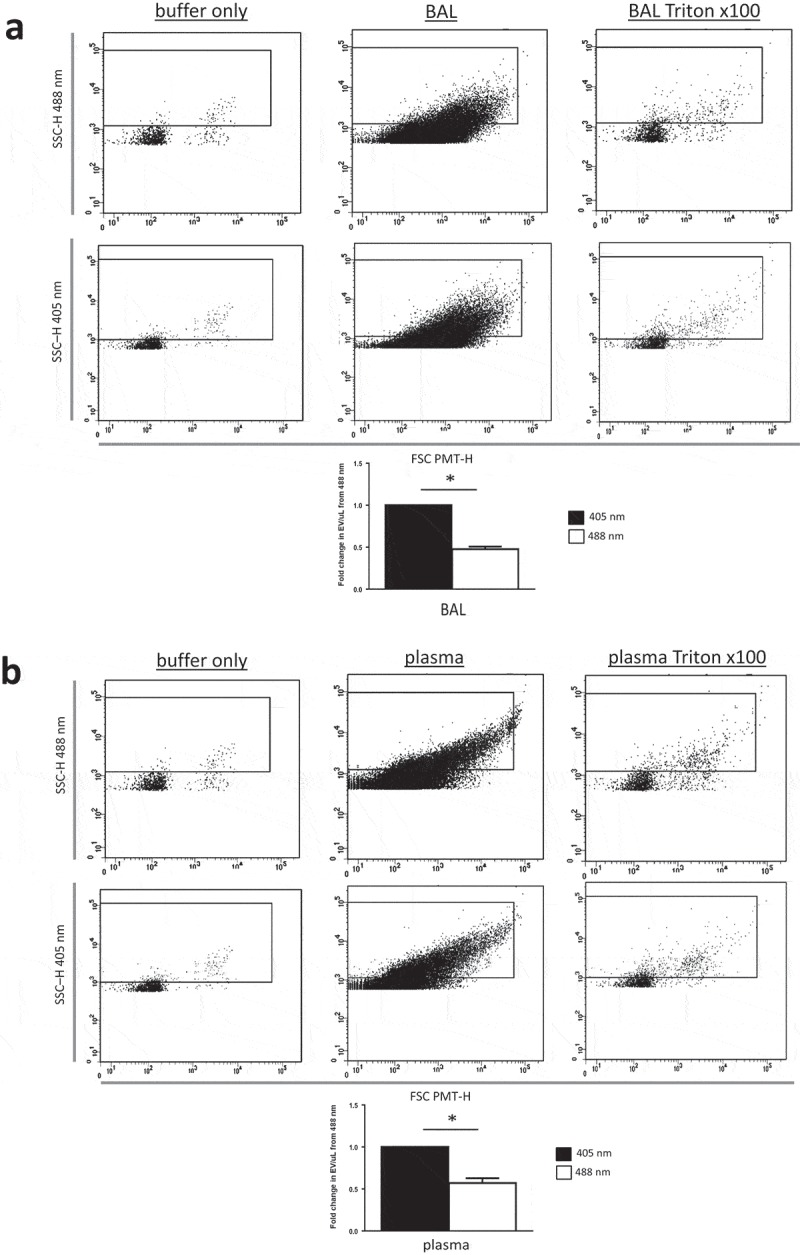
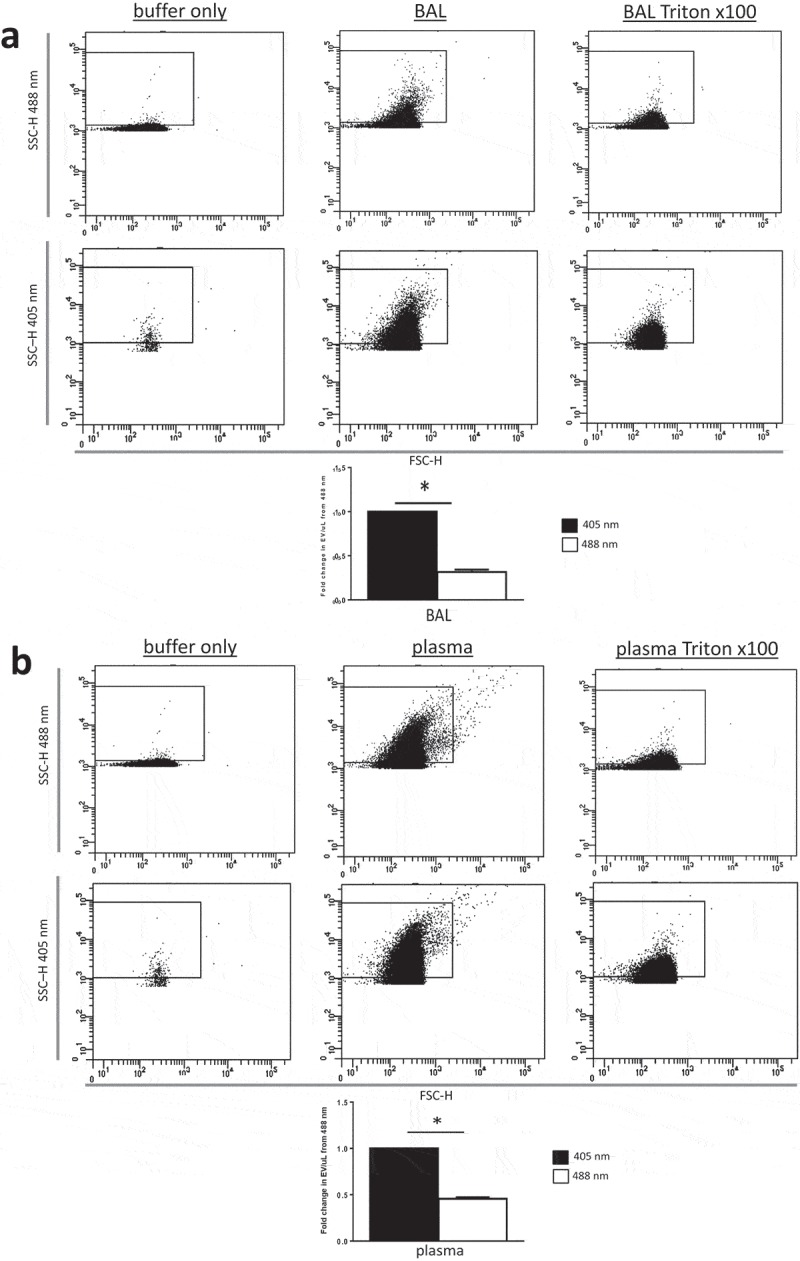
Improvements in identification and assessment of extracellular vesicles (EVs) have fuelled a recent surge in EV publications investigating their roles as biomarkers and mediators of disease. Meaningful scientific comparisons are, however, hampered by difficulties in accurate, reproducible enumeration and characterization of EVs in biological fluids. High-sensitivity flow cytometry (FCM) is presently the most commonly applied strategy to assess EVs, yet its utility is limited by variant ability to resolve smaller EVs. Here, we propose the use of 405 nm (violet) wavelength lasers in place of 488 nm (blue) for side scatter (SSC) detection to obtain greater resolution of EVs using high-sensitivity FCM. To test this hypothesis, we modelled EV resolution by violet versus blue SSC in silico and compared resolution of reference beads and biological EVs from plasma and bronchoalveolar lavage (BAL) fluid using either violet or blue wavelength SSC EV detection. Mie scatter modelling predicted that violet as compared to blue SSC increases resolution of small (100-500 nm) spherical particles with refractive indices (1.34-1.46) similar to EVs by approximately twofold in terms of light intensity and by nearly 20% in SSC signal quantum efficiency. Resolution of reference beads was improved by violet instead of blue SSC with two- and fivefold decreases in coefficients of variation for particles of 300-500 nm and 180-240 nm size, respectively. Resolution was similarly improved for detection of EVs from plasma or BAL fluid. Violet SSC detection for high-sensitivity FCM allows for significantly greater resolution of EVs in plasma and BAL compared to conventional blue SSC and particularly improves resolution of smaller EVs. Notably, the proposed strategy is readily implementable and inexpensive for machines already equipped with 405 nm SSC or the ability to accommodate 405/10 nm bandpass filters in their violet detector arrays.

Keywords: Extracellular vesicles; enumeration; flow cytometry; violet; wavelength.


Figures

Figure 1.
Figure 1.
Side scatter at 405 nm is superior to 488 nm lasers for detection of small spherical particles. (a) Depicts 360°computer-modelled light intensity plots for 405 nm (top; violet) and 488 nm (bottom; blue) for small spherical particles of 100, 200 or 500 nm in size (left to right). Incident laser light (405 nm: violet arrow or 488 nm: blue arrow) passes along a vector from 180° (bottom of the plot) up to the absolute centre of the plot which depicts where the modelled particle is situated. The distribution of scattered light seen (coloured contour line surrounding the modelled particle located at the centre of the plot) varied depending on the size of particle and type of laser (405 vs. 488 nm). (b) Shows the light intensity of side scatter detection at 90° for 405 nm (black bars) and 488 nm (white bars) lasers based on computer modelling for spherical 100, 200 and 500 nm particles (top to bottom) with refractive indices (RIs) of 1.34, 1.37, 1.4 and 1.46.
Figure 2.
Figure 2.
Use of 405 nm rather than 488 nm laser increases signal intensity over the relevant range of angles for SSC detection. (a) Displays signal intensities calculated by computer modelling (Y axes) of light scatter around small particles at the indicated particle diameters. Light scatter was modelled at a collection angle of 31.5°–148.5° which is the range over which the side scatter signal is detected (X axes) for 405 nm (black dotted lines) and 488 nm (solid grey lines). These calculations were done for 100, 200 and 500 nm sized modelled spherical small particles (left to right) with refractive indexes (RIs) of 1.34, 1.37, 1.4 and 1.46 (top to bottom). (b) Depicts the overall fold changes in area under the curve (AUC) for 405 and 488 nm wavelengths for particles ranging in size from 100, 200 and 500 nm (Y axis) with RIs of 1.37 or 1.46 (X axis).
Figure 3.
Figure 3.
Improved empiric flow cytometric resolution of microspheres by 405 nm instead of 488 nm side scatter. (a) Depicts populations of 180, 240, 300, 590 and 880 nm silica (S) or 500 nm latex (L) beads resolved by 405 nm (left panel) or 488 nm (right panel) forward scatter (FSC; X axis) and side scatter (SSC; Y axis) by flow cytometry. (B) Shows increased resolution (reduced coefficients of variation [CVs]) for 405 nm (black bars) compared with 488 nm (white bars) SSC for the beads (X axis) shown in (a). Data are depicted as mean CV ± SD, n = 4 with * representing differences between 405 and 488 nm wavelength detection of identical samples of beads with p < 0.05 as detected by two-tailed paired t-test.
Figure 4.
Figure 4.
NTA of EVs in murine plasma and BAL fluid. Duplicate samples of EVs from both diluted mouse bronchoalveolar lavage (BAL) and plasma were each analysed by NTA independently five times for 40 s. Depicted are representative histograms of average size distributions for mouse BAL (black) and plasma (grey) as well as 100 nm calibration beads (black hashed).
Figure 5.
Figure 5.
Resolution of EV populations from biological samples of plasma and BAL were improved using 405 nm instead of 488 nm side scatter. (a) Shows representative forward- (FSC PMT-H) and side scatter (SSC-H) height dot plots showing buffer only (left plots, EVs from BAL (middle plots) and detergent-lysed BAL EVs (right plots) gated by 488 nm (top) or 405 nm (bottom) SSC-H). (b) Shows identical plots but with plasma EVs (middle plots) and detergent-lysed plasma EVs (right plots). Bar graphs in both panels (a) (BAL) and (b) (plasma) depict fold increases (relative to 488 nm SSC) in EV concentration detected with either 405 nm (black bars) or 488 nm (white bars) SSC resolved by high-sensitivity flow cytometry (BD Aria III). Data are depicted as mean ± SD, n = 5 with * representing differences between 405 and 488 nm wavelength detection of identical samples of EVs with p < 0.005 detected by two-tailed paired t-test.
Figure 6.
Figure 6.
Resolution of EV populations from biological samples of plasma and BAL were improved using 405 instead of 488 nm side scatter with identical laser power. (a) Shows representative forward- (FSC-H) and side scatter (SSC-H) height dot plots showing buffer only (left plots, EVs from BAL (middle plots) and detergent-lysed BAL EVs (right plots) gated by 488 nm (top) or 405 nm (bottom) SSC-H). (b) Shows identical plots but with plasma EVs (middle plots) and detergent-lysed plasma EVs (right plots). Bar graphs in both panels (a) (BAL) and (b) (plasma) depict fold increases (relative to 488 nm SSC) in EV concentration detected with either 405 nm (black bars) or 488 nm (white bars) SSC resolved by high-sensitivity flow cytometry (BD x20 Fortessa with electronically matched laser power for 405 and 488 nm). Data are depicted as mean ± SD, n = 5 with * representing differences between 405 and 488 nm wavelength detection of identical samples of EVs with p < 0.005 detected by two-tailed paired t-test.

References

    1. Nawaz M, Camussi G, Valadi H, et al. The emerging role of extracellular vesicles as biomarkers for urogenital cancers. Nat Rev Urol. 2014;11(12):688–11. - PubMed
    1. Ban LA, Shackel NA, McLennan SV.. Extracellular vesicles: a new frontier in biomarker discovery for non-alcoholic fatty liver disease. Int J Mol Sci. 2016;17(3):376. - PMC - PubMed
    1. Tannetta D, Masliukaite I, Vatish M, et al. Update of syncytiotrophoblast derived extracellular vesicles in normal pregnancy and preeclampsia. J Reprod Immunol. 2017;119:98–106. - PubMed
    1. McVey M, Tabuchi A, Kuebler WM. Microparticles and acute lung injury. Am J Physiol Lung Cell Mol Physiol. 2012;303(5):L364–L381. - PubMed
    1. McVey MJ, Spring CM, Semple JW, et al. Microparticles as biomarkers of lung disease: enumeration in biological fluids using lipid bilayer microspheres. Am J Physiol Lung Cell Mol Physiol. 2016;310(9):L80–L84. - PubMed