. 2018 Aug;17(4):e12769.
doi: 10.1111/acel.12769. Epub 2018 Apr 25.

Lifelong reduction in complex IV induces tissue-specific metabolic effects but does not reduce lifespan or healthspan in mice

Affiliations

Lifelong reduction in complex IV induces tissue-specific metabolic effects but does not reduce lifespan or healthspan in mice

Sathyaseelan S Deepa et al. Aging Cell. 2018 Aug.

Abstract

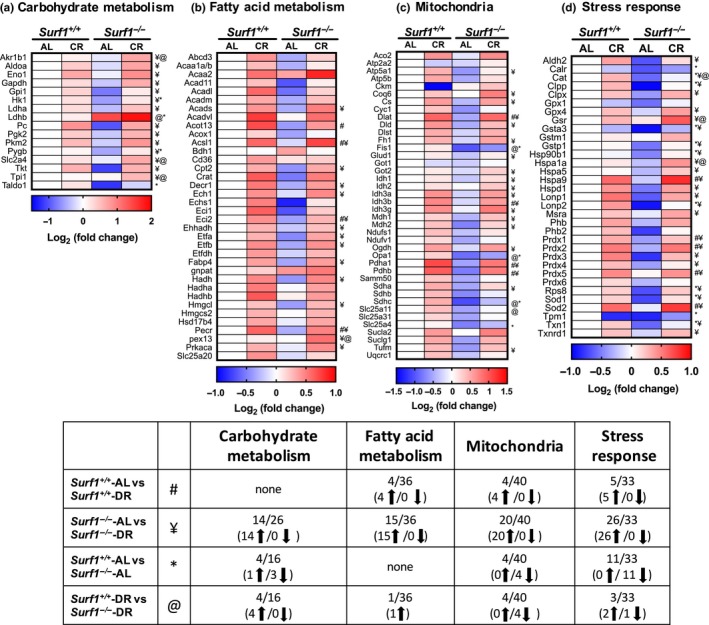
Loss of SURF1, a Complex IV assembly protein, was reported to increase lifespan in mice despite dramatically lower cytochrome oxidase (COX) activity. Consistent with this, our previous studies found advantageous changes in metabolism (reduced adiposity, increased insulin sensitivity, and mitochondrial biogenesis) in Surf1-/- mice. The lack of deleterious phenotypes in Surf1-/- mice is contrary to the hypothesis that mitochondrial dysfunction contributes to aging. We found only a modest (nonsignificant) extension of lifespan (7% median, 16% maximum) and no change in healthspan indices in Surf1-/- vs. Surf1+/+ mice despite substantial decreases in COX activity (22%-87% across tissues). Dietary restriction (DR) increased median lifespan in both Surf1+/+ and Surf1-/- mice (36% and 19%, respectively). We measured gene expression, metabolites, and targeted expression of key metabolic proteins in adipose tissue, liver, and brain in Surf1+/+ and Surf1-/- mice. Gene expression was differentially regulated in a tissue-specific manner. Many proteins and metabolites are downregulated in Surf1-/- adipose tissue and reversed by DR, while in brain, most metabolites that changed were elevated in Surf1-/- mice. Finally, mitochondrial unfolded protein response (UPRmt )-associated proteins were not uniformly altered by age or genotype, suggesting the UPRmt is not a key player in aging or in response to reduced COX activity. While the changes in gene expression and metabolism may represent compensatory responses to mitochondrial stress, the important outcome of this study is that lifespan and healthspan are not compromised in Surf1-/- mice, suggesting that not all mitochondrial deficiencies are a critical determinant of lifespan.

Keywords: SURF1; cytochrome c oxidase; dietary restriction; lifespan; mitochondria; mitochondrial unfolded protein response.


Figures

Figure 1
Figure 1
COX activity is reduced in Surf1 −/− mice fed AL or a DR diet. COX activity in tissue homogenates of liver (a), heart (b), and WAT (c) of Surf1 +/+ (black bars) and Surf1 −/− mice (white bars) fed AL or DR diet. Error bars represent mean ± SEM (n = 4–7). * Surf1 +/+ ‐AL vs. Surf1 −/− ‐AL, + young vs. old; #AL vs. DR. */+/# p < .05
Figure 2
Figure 2
Surf1 −/− mice have increased median lifespan when fed AL, and DR reduced median lifespan of Surf1 −/− mice. (a) The Kaplan–Meier survival curves for Surf1 +/+and Surf1 −/− female mice fed AL and DR diet. The curves represent Surf1 +/+ mice fed AL (black circle, n = 29), Surf1 −/− mice fed AL (white circle, n = 32), Surf1 +/+ mice fed a DR diet (black square, n = 45), Surf1 −/− mice fed a DR diet (white square, n = 44). (b) Gompertz plot for Surf1 +/+and Surf1 −/− female mice fed AL and DR diet
Figure 3
Figure 3
Surf1 −/− mice do not show changes in markers of healthspan. (a) Grip strength measured in 28‐month‐old Surf1 +/+and Surf1 −/− female fed AL. The grip force (in grams) was measured over 10 trials and the maximum force was recorded. (b) Rotarod performance measurement in 28‐month‐old Surf1 +/+ (black bars) and Surf1 −/− (white bars) female fed AL. The average latency to fall from the rod (in seconds) was recorded. (c) Sleep fragmentation in 28‐month‐old Surf1 +/+ (black bars) and Surf1 −/− (white bars) female fed AL expressed as the number of sleep bouts per hour of sleep (any period of inactivity (no beam breaks) greater than or equal to 40 s). (d) Spontaneous activity measured in AL‐fed 28‐month‐old Surf1 +/+ (black bars) and Surf1 −/− (white bars) mice measured as the number of beam breaks (e) Cardiovascular functions end systolic dimension (left panel) and fractional shortening (right panel) in 20‐month‐old Surf1 +/+ (black bars) and Surf1 −/− (white bars) female mice measured as previously described (Pulliam et al., 2014). Error bars represent mean ± SEM
Figure 4
Figure 4
Surf1 −/− mice fed AL, not a DR diet, have a reduction in body weight and fat mass with age. Change in body weight (a), fat mass (b), and lean mass (c) with age in Surf1 +/+ and Surf1 −/− mice in the survival cohorts. The curves represent Surf1 +/+ mice fed AL (black circle), Surf1 −/− mice fed AL (white circle), Surf1 +/+ mice fed a DR diet (black square), Surf1 −/− mice fed a DR diet (white square). Error bars represent mean ± SEM
Figure 5
Figure 5
Tissue‐specific differential expression of genes and metabolic pathways in Surf1 +/+ and Surf1 −/− mice. (a) Venn diagram showing number of genes significantly downregulated (left panel) or upregulated (right panel) in liver (blue), WAT (yellow), and brain (green) using a filtering criteria of p < .05. (b) Heatmap showing expression of all the significantly changed probes in liver (left panel), WAT (middle panel), and brain (right panel). The Surf1 +/+ and Surf1 −/− samples were clustered using average linkage hierarchical cluster with Euclidean distance using a criteria of < .05. Green represents downregulated genes and red represents upregulated genes. (c) The top five pathways from Ingenuity Pathway Analysis ranked by the lowest p‐values as determined by the Fisher's exact test are shown for liver (left panel), WAT (middle panel), and brain (right panel). The yellow line represents the ‐log of the p‐value and the bolded number on the right side of the graph represents the total number of possible genes of that pathway. Green color indicates percentage of downregulated genes, red color indicates percentage of upregulated genes, and white color indicates the percentage not found in the significant gene list. Table S2 lists the genes identified by Ingenuity Pathway Analysis
Figure 6
Figure 6
Metabolic pathways are altered in Surf1 −/− mice adipose tissue and DR reverses most of these changes. Heatmaps representing changes in protein expression of enzymes/proteins in Surf1 −/− mice compared to Surf1 +/+ mice fed AL or DR in carbohydrate metabolism (a), fatty acid metabolism (b), TCA cycle, ETC proteins, and assorted mitochondrial proteins (c), and stress response (d) in WAT obtained by targeted mass spectrometry analysis. Blue indicates downregulated proteins, white is unchanged, and red is upregulated. A summary of the data (e) represents number of enzymes/proteins in the pathway that are altered. Statistical significance determined by two‐Way ANOVA with Tukey's post hoc test (n = 7–8)

References

    1. Bai, Y. , Shakeley, R. M. , & Attardi, G. (2000). Tight control of respiration by NADH dehydrogenase ND5 subunit gene expression in mouse mitochondria. Molecular and Cellular Biology, 20, 805–815. 10.1128/MCB.20.3.805-815.2000 - DOI - PMC - PubMed
    1. Baker, M. J. , Tatsuta, T. , & Langer, T. (2011). Quality control of mitochondrial proteostasis. Cold Spring Harbor Perspectives in Biology, 3(7), pii: a007559. 10.1101/cshperspect.a007559 - DOI - PMC - PubMed
    1. Bokov, A. F. , Garg, N. , Ikeno, Y. , Thakur, S. , Musi, N. , DeFronzo, R. A. , … Richardson, A. (2011). Does reduced IGF‐1R signaling in Igf1r+/‐ mice alter aging? PLoS ONE, 6(11), e26891 10.1371/journal.pone.0026891 - DOI - PMC - PubMed
    1. Copeland, J. M. , Cho, J. , Lo, T. Jr , Hur, J. H. , Bahadorani, S. , Arabyan, T. , … Walker, D. W. (2009). Extension of Drosophila life span by RNAi of the mitochondrial respiratory chain. Current Biology, 19(19), 1591–1598. 10.1016/j.cub.2009.08.016. - DOI - PubMed
    1. Deepa, S. S. , Pulliam, D. , Hill, S. , Shi, Y. , Walsh, M. E. , Salmon, A. , … Van Remmen, H. (2013). Improved insulin sensitivity associated with reduced mitochondrial complex IV assembly and activity. Federation of American Societies for Experimental Biology Journal, 27(4), 1371–1380. 10.1096/fj.12-221879. - DOI - PubMed

Publication types

LinkOut - more resources