. 2018 Apr 20;11(Suppl 2):31.
doi: 10.1186/s12920-018-0346-x.

Identifying statistically significant combinatorial markers for survival analysis

Affiliations

Identifying statistically significant combinatorial markers for survival analysis

Raissa T Relator et al. BMC Med Genomics. .

Abstract

Background: Survival analysis methods have been widely applied in different areas of health and medicine, spanning over varying events of interest and target diseases. They can be utilized to provide relationships between the survival time of individuals and factors of interest, rendering them useful in searching for biomarkers in diseases such as cancer. However, some disease progression can be very unpredictable because the conventional approaches have failed to consider multiple-marker interactions. An exponential increase in the number of candidate markers requires large correction factor in the multiple-testing correction and hide the significance.

Methods: We address the issue of testing marker combinations that affect survival by adapting the recently developed Limitless Arity Multiple-testing Procedure (LAMP), a p-value correction technique for statistical tests for combination of markers. LAMP cannot handle survival data statistics, and hence we extended LAMP for the log-rank test, making it more appropriate for clinical data, with newly introduced theoretical lower bound of the p-value.

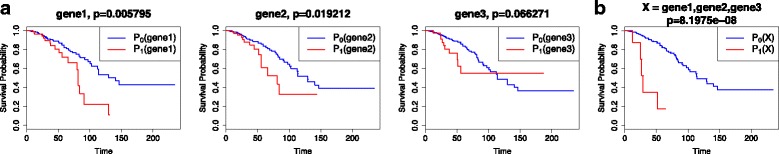
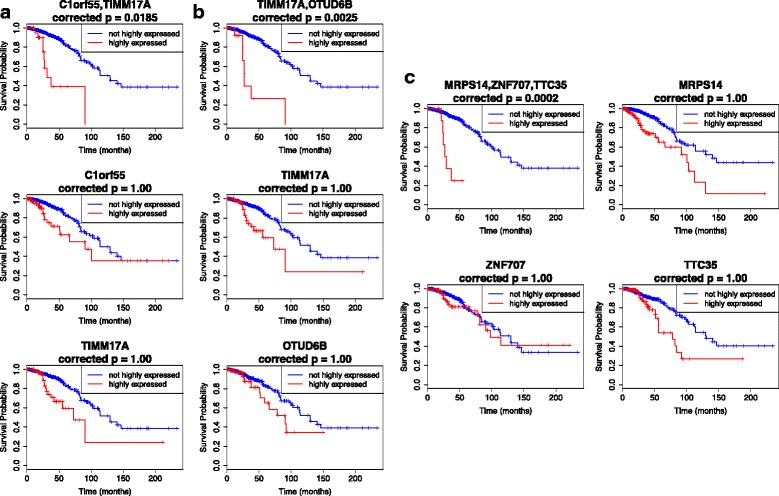
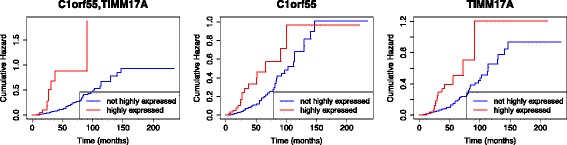
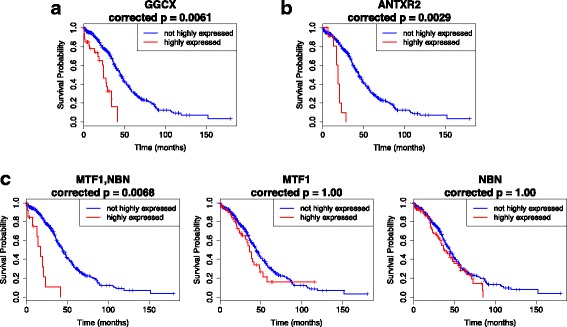
Results: We applied the proposed method to gene combination detection for cancer and obtained gene interactions with statistically significant log-rank p-values. Gene combinations with orders of up to 32 genes were detected by our algorithm, and effects of some genes in these combinations are also supported by existing literature.

Conclusion: The novel approach for detecting prognostic markers presented here can identify statistically significant markers with no limitations on the order of interaction. Furthermore, it can be applied to different types of genomic data, provided that binarization is possible.

Keywords: Gene marker; Log-rank test; Multiple testing; Prognosis; Survival analysis.


Conflict of interest statement

Ethics approval and consent to participate

Not applicable.

Consent for publication

Not applicable.

Competing interests

The authors declare that they have no competing interests.

Publisher’s Note

Springer Nature remains neutral with regard to jurisdictional claims in published maps and institutional affiliations.

Figures

Fig. 1
Fig. 1
Example of a statistically significant combination marker X with some non-significant gene components. a P1(gene) denotes samples with over-expression of the corresponding gene and P0(gene) denotes samples with no over-expression of the gene. Under α=0.05, gene3 is not significant, and under α=0.01, only gene 1 will be significant. b The gene combination X is comprised of the three genes in (a). P1(X) denotes the samples with over-expression of all 3 genes in X and P0(X) represents the samples with no over-expression in at least one of the 3 genes. The combination of the three genes results to a marker with significantly low p-value even if not all three are evaluated as significant. With a conventional filtering approach, this combination marker may never be detected
Fig. 2
Fig. 2
Kaplan-Meier plots for the top three markers in Table 2, and the corresponding KM plots for individual genes in combination markers. In the combinations, all genes involved are assumed to have high expressions. For all figures, the red curves represent the survival probability of individuals with highly expressed genes/gene combinations, while the blue curves represent the survival probability of individuals with non-highly expressed genes/gene combinations. Indicated p-values are the adjusted log-rank p-values using the total correction factor k=556284. If the adjusted p-values exceed 1.0, p=1.0 is used. a The 2-gene combination C1orf55,TIMM17A (uppermost) and the respective individual KM plots for C1orf55 (middle) and TIMM17A (lowermost); b The 2-gene combination TIMM17A,OTUD6B (uppermost) and the respective KM plots for the two genes in the combination; c The KM plot for the 3-gene combination MRPS14,ZNF707,TTC35 (top left), and the succeeding respective plots for the individual genes
Fig. 3
Fig. 3
Cumulative hazard plots for the top combination marker C1orf55,TIMM17A (left-most) in Table 2, and the corresponding individual genes
Fig. 4
Fig. 4
Kaplan-Meier plots for the top three markers in Table 3, and the corresponding KM plots for the individual genes in combination markers. In the combinations, all genes involved are assumed to have high expressions. For all figures, the red curves represent the survival probability of individuals with highly expressed genes/gene combinations, while the blue curves represent the survival probability of individuals with non-highly expressed genes/gene combinations. Indicated p-values are the adjusted log-rank p-values using the total correction factor k=920351. If the adjusted p-values exceed 1.0, p=1.0 is used. a The KM plot for the single gene GGCX, which is the top marker in Table 3 (most number of occurrences); b The KM plot for the single gene ANTXR2, the third marker with most number of occurrences; c The KM plot for the 2-gene combination MTF1,NBN (left-most), and the respective plots for the individual genes
Fig. 5
Fig. 5
Cumulative hazard plot for GGCX, the top gene marker in Table 3

References

    1. Li J, Lenferink AE, Deng Y, Collins C, Cui Q, Purisima EO, et al. Identification of high-quality cancer prognostic markers and metastasis network modules. Nat Commun. 2010;1:34. - PMC - PubMed
    1. Martinez-Ledesma E, Verhaak RG, Trevino V. Identification of a multi-cancer gene expression biomarker for cancer clinical outcomes using a network-based algorithm. Sci Rep. 2015;5:11966. doi: 10.1038/srep11966. - DOI - PMC - PubMed
    1. Mehta S, Shelling A, Muthukaruppan A, Lasham A, Blenkiron C, Laking G, Print C. Predictive and prognostic molecular markers for cancer medicine. Ther Adv Med Oncol. 2010;2(2):125–48. doi: 10.1177/1758834009360519. - DOI - PMC - PubMed
    1. Suzuki K, Kachala SS, Kadota K, Shen R, Mo Q, Beer DG, et al. Prognostic immune markers in non-small cell lung cancer. Clin Cancer Res. 2011;17(16):5247–256. doi: 10.1158/1078-0432.CCR-10-2805. - DOI - PubMed
    1. Wang Z, Chen G, Wang Q, Lu W, Xu M. Identification and validation of a prognostic 9-genes expression signature for gastric cancer. Oncotarget. 2017;8:73826–36. - PMC - PubMed

Publication types

Substances