

Insulinlike Growth Factor 1 Gene Variation in Vertebrates
- PMID: 29697760
- PMCID: PMC6692883
- DOI: 10.1210/en.2018-00259
Insulinlike Growth Factor 1 Gene Variation in Vertebrates
Abstract
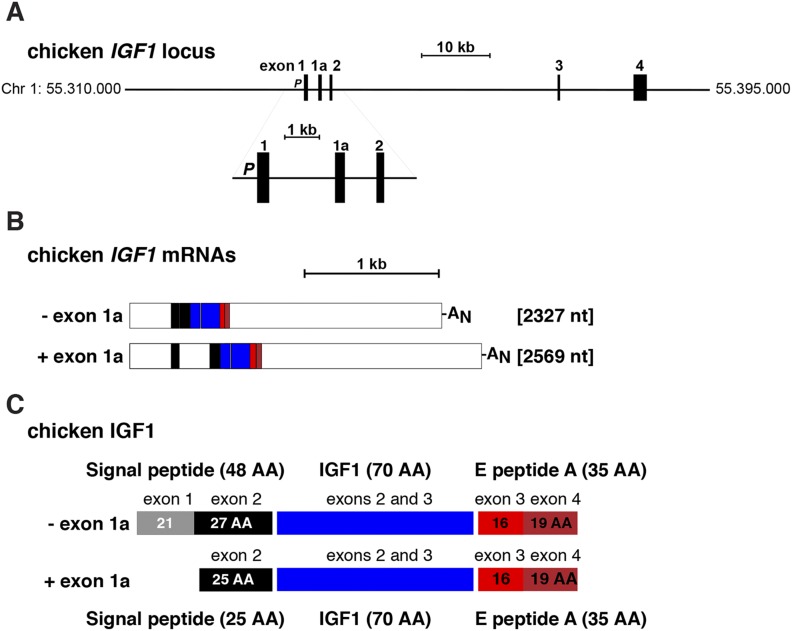
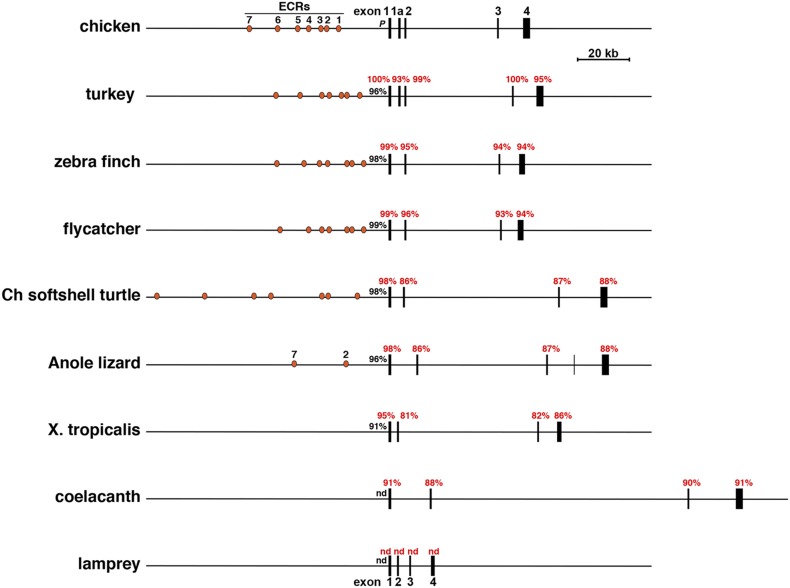
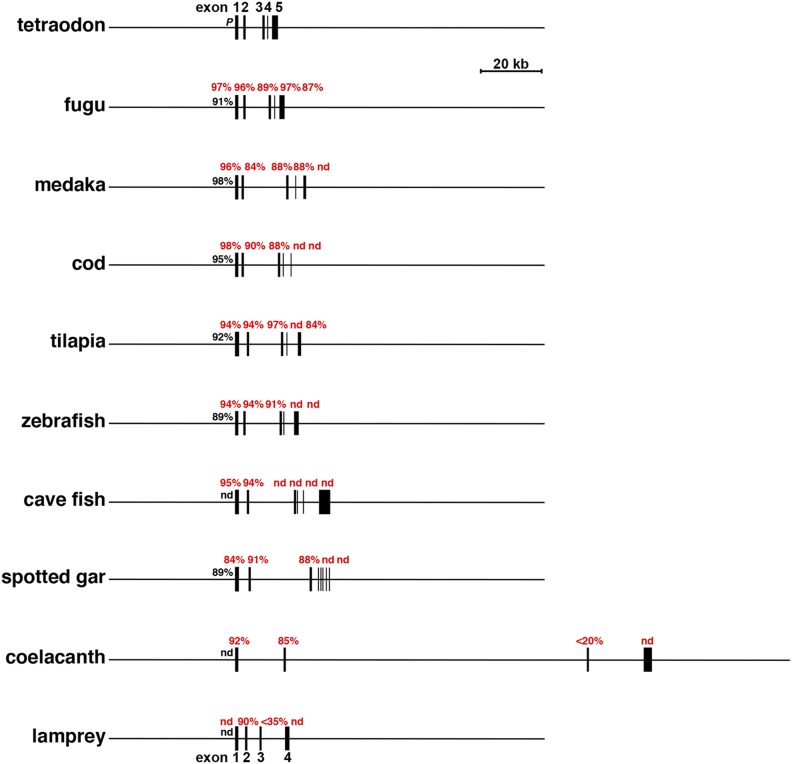
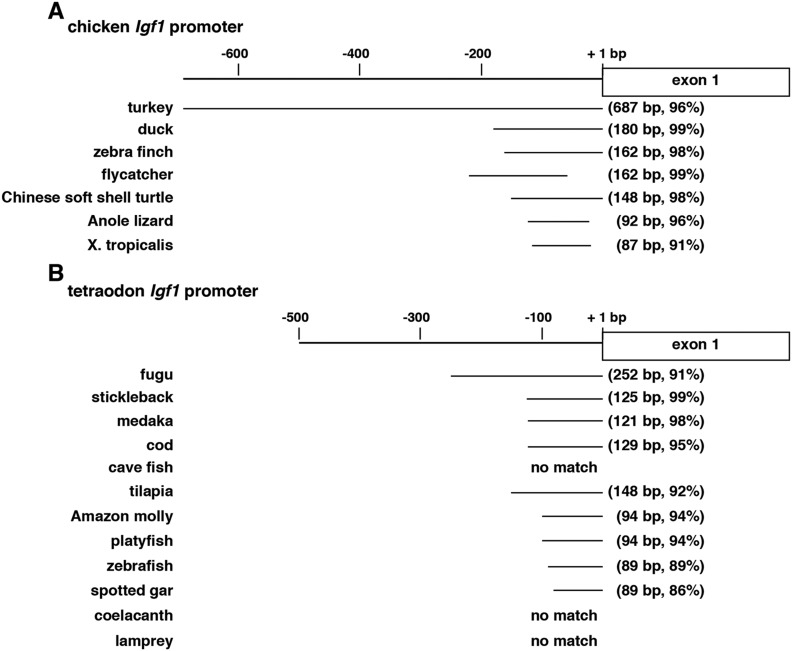
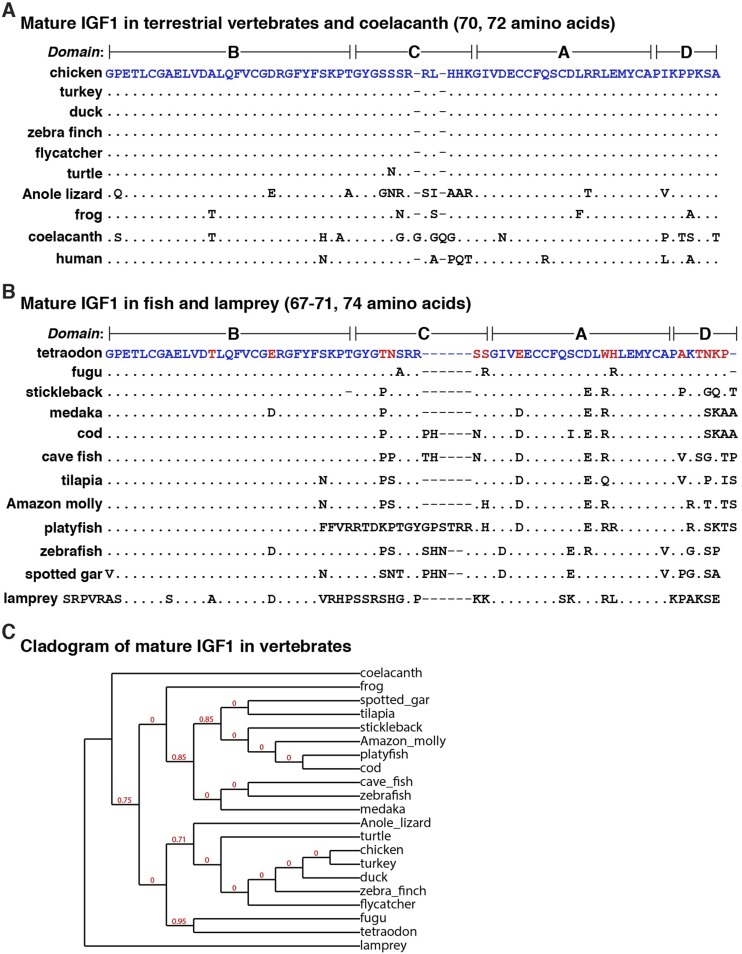
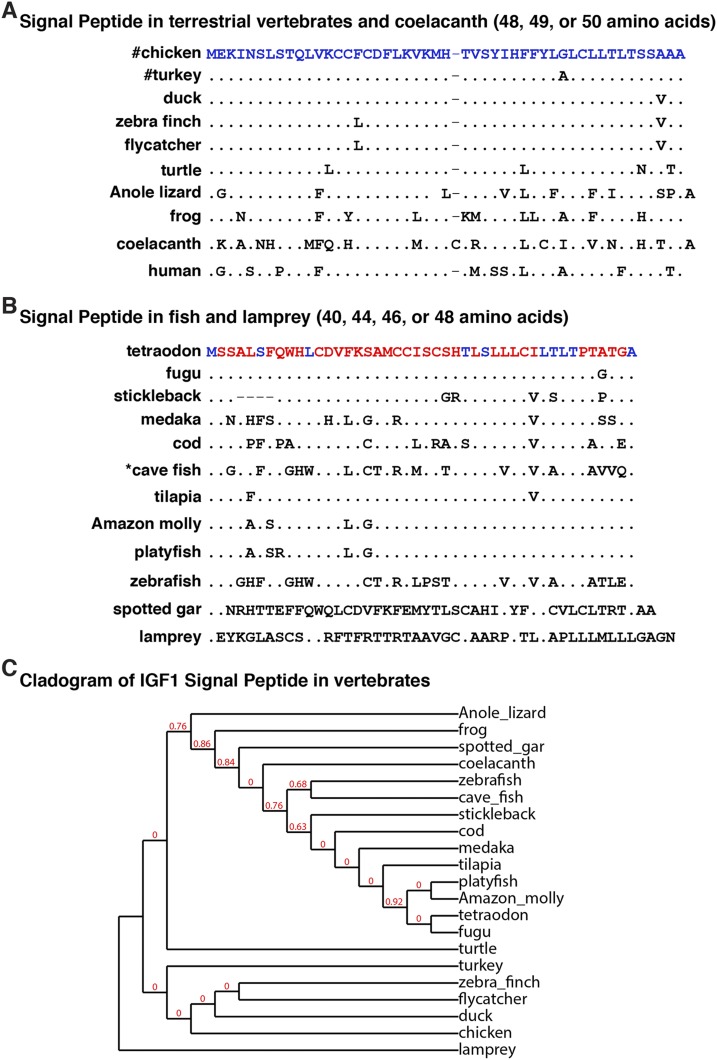
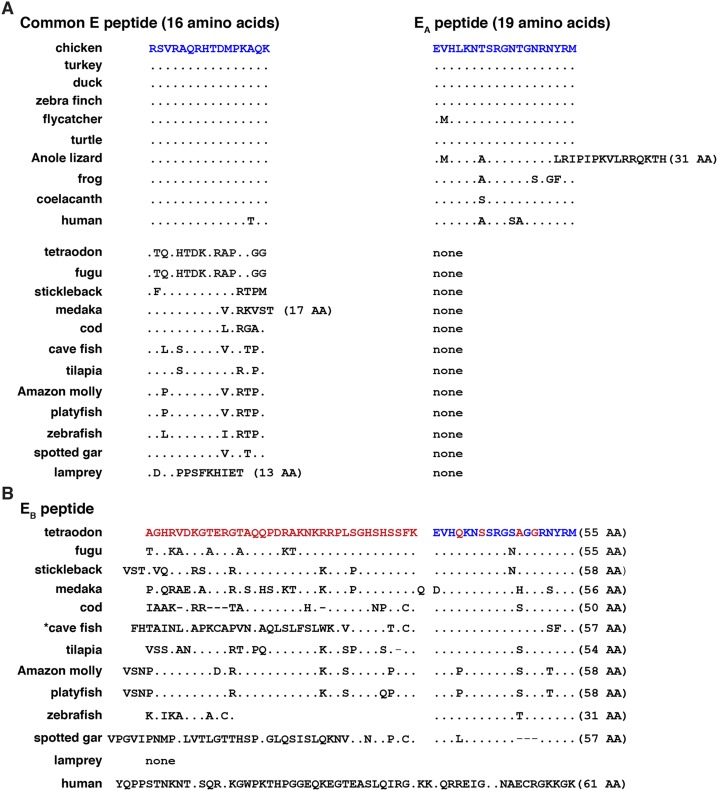
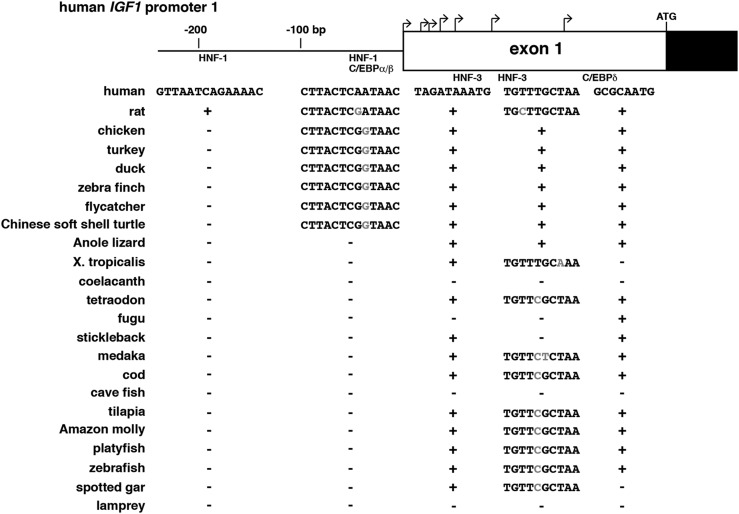
IGF1-a small, single-chain, secreted peptide in mammals-is essential for normal somatic growth and is involved in a variety of other physiological and pathophysiological processes. IGF1 expression appears to be controlled by several different signaling mechanisms in mammals, with GH playing a key role by activating an inducible transcriptional pathway via the Jak2 protein kinase and the Stat5b transcription factor. Here, to understand aspects of Igf1 gene regulation over a substantially longer timeline than is discernible in mammals, Igf1 genes have been examined in 21 different nonmammalian vertebrates representing five different classes and ranging over ∼500 million years of evolutionary history. Parts of vertebrate Igf1 genes resemble components found in mammals. Conserved exons encoding the mature IGF1 protein are detected in all 21 species studied and are separated by a large intron, as seen in mammals; the single promoter contains putative regulatory elements that are similar to those functionally mapped in human IGF1 promoter 1. In contrast, GH-activated Stat5b-binding enhancers found in mammalian IGF1 loci are completely absent, there is no homolog of promoter 2 or exon 2 in any nonmammalian vertebrate, and different types of "extra" exons not present in mammals are found in birds, reptiles, and teleosts. These data collectively define properties of Igf1 genes and IGF1 proteins that were likely present in the earliest vertebrates and support the contention that common structural and regulatory features in Igf1 genes have a long evolutionary history.
Figures
Similar articles
-
Diversification of the insulin-like growth factor 1 gene in mammals.PLoS One. 2017 Dec 14;12(12):e0189642. doi: 10.1371/journal.pone.0189642. eCollection 2017. PLoS One. 2017. PMID: 29240807 Free PMC article.
-
Variation in the Insulin-Like Growth Factor 1 Gene in Primates.Endocrinology. 2017 Apr 1;158(4):804-814. doi: 10.1210/en.2016-1920. Endocrinology. 2017. PMID: 28324014 Free PMC article.
-
Identifying growth hormone-regulated enhancers in the Igf1 locus.Physiol Genomics. 2015 Nov;47(11):559-68. doi: 10.1152/physiolgenomics.00062.2015. Epub 2015 Sep 1. Physiol Genomics. 2015. PMID: 26330488 Free PMC article.
-
Phylogeny of the cholecystokinin/gastrin family.Front Neuroendocrinol. 1998 Apr;19(2):73-99. doi: 10.1006/frne.1997.0163. Front Neuroendocrinol. 1998. PMID: 9578981 Review.
-
Structural organization and transcription regulation of nuclear genes encoding the mammalian cytochrome c oxidase complex.Prog Nucleic Acid Res Mol Biol. 1998;61:309-44. doi: 10.1016/s0079-6603(08)60830-2. Prog Nucleic Acid Res Mol Biol. 1998. PMID: 9752724 Review.
Cited by
-
Evolution of the Insulin Gene: Changes in Gene Number, Sequence, and Processing.Front Endocrinol (Lausanne). 2021 Apr 2;12:649255. doi: 10.3389/fendo.2021.649255. eCollection 2021. Front Endocrinol (Lausanne). 2021. PMID: 33868177 Free PMC article. Review.
-
Mechano-growth factor E-domain modulates cardiac contractile function through 14-3-3 protein interactomes.Front Physiol. 2022 Nov 16;13:1028345. doi: 10.3389/fphys.2022.1028345. eCollection 2022. Front Physiol. 2022. PMID: 36467694 Free PMC article.
-
Characterizing the complexity of Australian marsupial insulin-like growth factor 1 genes.Mol Cell Endocrinol. 2019 May 15;488:52-69. doi: 10.1016/j.mce.2019.03.004. Epub 2019 Mar 11. Mol Cell Endocrinol. 2019. PMID: 30871962 Free PMC article.
-
Gene Mapping by RNA-sequencing: A Direct Way to Characterize Genes and Gene Expression through Targeted Queries of Large Public Databases.Bio Protoc. 2019 Jan 5;9(1):e3129. doi: 10.21769/BioProtoc.3129. Bio Protoc. 2019. PMID: 32699811 Free PMC article.
-
The insulin-like growth factor 2 gene and locus in nonmammalian vertebrates: Organizational simplicity with duplication but limited divergence in fish.J Biol Chem. 2018 Oct 12;293(41):15912-15932. doi: 10.1074/jbc.RA118.004861. Epub 2018 Aug 28. J Biol Chem. 2018. PMID: 30154247 Free PMC article.
References
-
- Daughaday WH, Kapadia M, Yanow CE, Fabrick K, Mariz IK. Insulin-like growth factors I and II of nonmammalian sera. Gen Comp Endocrinol. 1985;59(2):316–325. - PubMed
-
- Daughaday WH, Rotwein P. Insulin-like growth factors I and II: peptide, messenger ribonucleic acid and gene structures, serum, and tissue concentrations. Endocr Rev. 1989;10(1):68–91. - PubMed
-
- Sussenbach JS, Steenbergh PH, Jansen E, Holthuizen P, Meinsma D, van Dijk MA, Gloudemans T. Structural and regulatory aspects of the human genes encoding IGF-I and -II. Adv Exp Med Biol. 1991;293:1–14. - PubMed
-
- Rotwein P. Molecular biology of IGF-I and IGF-II In: Rosenfeld R, Roberts CJ, eds. The IGF System.Totowa, NJ: Humana Press; 1999:19–35.
-
- Das R, Dobens LL. Conservation of gene and tissue networks regulating insulin signalling in flies and vertebrates. Biochem Soc Trans. 2015;43(5):1057–1062. - PubMed
Publication types
MeSH terms
Substances
Grants and funding
LinkOut - more resources
Full Text Sources
Other Literature Sources
Miscellaneous
