. 2018 Jun 1;159(6):2473-2483.
doi: 10.1210/en.2018-00131.

Carnitine Acetyltransferase in AgRP Neurons Is Required for the Homeostatic Adaptation to Restricted Feeding in Male Mice

Affiliations

Carnitine Acetyltransferase in AgRP Neurons Is Required for the Homeostatic Adaptation to Restricted Feeding in Male Mice

Alex Reichenbach et al. Endocrinology. .

Abstract

Behavioral adaptation to periods of varying food availability is crucial for survival, and agouti-related protein (AgRP) neurons have been associated with entrainment to temporal restricted feeding. We have shown that carnitine acetyltransferase (Crat) in AgRP neurons enables metabolic flexibility and appropriate nutrient partitioning. In this study, by restricting food availability to 3 h/d during the light phase, we examined whether Crat is a component of a food-entrainable oscillator (FEO) that helps link behavior to food availability. AgRP Crat knockout (KO) mice consumed less food and regained less body weight but maintained blood glucose levels during the 25-day restricted feeding protocol. Importantly, we observed no difference in meal latency, food anticipatory activity (FAA), or brown adipose tissue temperature during the first 13 days of restricted feeding. However, as the restricted feeding paradigm progressed, we noticed an increased FAA in AgRP Crat KO mice. The delayed increase in FAA, which developed during the last 12 days of restricted feeding, corresponded with elevated plasma levels of corticosterone and nonesterified fatty acids, indicating it resulted from greater energy debt incurred by KO mice over the course of the experiment. These experiments highlight the importance of Crat in AgRP neurons in regulating feeding behavior and body weight gain during restricted feeding but not in synchronizing behavior to food availability. Thus, Crat within AgRP neurons forms a component of the homeostatic response to restricted feeding but is not likely to be a molecular component of FEO.


Figures
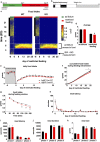
Figure 1.
Figure 1.
AgRP Crat KO mice adjusted to feeding entrainment but showed altered feeding behavior. Schematic of the (a) experimental design and (b) the restricted feeding protocol. (c) Heat map depicting food intake in 30-minute bins for 6 days ad libitum and 25 days of restricted feeding. The vertical black bar on left indicates dark phase; the vertical, white, dashed line indicates start of restricted feeding; the horizontal, white, dashed lines frame the feeding window during restricted feeding. (d) Average food intake during ad libitum and food restriction, (e) daily food intake, and (f) cumulative food intake during restricted feeding. (g) Average food intake during the feeding window from days 5 to 25 of restricted feeding. Daily meal latency during the (h) restricted feeding and (i) average latency, (j) duration, and (k) size of the first meal from phase 1 (days 0 to 5), phase 2 (days 6 to 12), and phase 3 (days 13 to 25) of restricted feeding. All data are expressed as mean ± SEM; n = 18 to 20. (j and k) aP < 0.05 by two-way (repeated measured, where appropriate) ANOVA with Sidak post hoc analysis. BG, blood glucose; BW, body weight.
Figure 2.
Figure 2.
AgRP Crat KO mice exhibited slower body weight regain on a restricted feeding schedule. Body weight development relative to (a) starting weight and (b) absolute average weight of animals at beginning and end of experiment. (c) Daily blood glucose measured prior to feeding. (d) Plasma glucose, (e) liver glycogen, (f) triglyceride, and (g) liver gene expression in mice after 25 days of restricted feeding before or 2 hours after access to food. (g, h) *P < 0.05, KO vs WT before or during the feeding window. (h) Hypothalamic gene expression profiles of AgRP, NPY, GHSR, POMC, Gck, GAPDH, PDH1, ACC1, and ACC2 from mice after 25 days of restricted feeding before or 2 hours into feeding window. (i) Acyl ghrelin, (j) des-acyl ghrelin, (k) glucagon, (l) corticosterone, (m) plasma triglyceride levels, and (n) NEFA at the end of the experiment (day 25) 1 hour before feeding window. All data are expressed as mean ± SEM; n = 8 to 12. (b and l–n) aP < 0.05 vs WT mice at end of experiment; bP < 0.05 vs KO mice at the start of the experiment, by two-way (repeated measured, where appropriate) ANOVA with Sidak post hoc analysis or unpaired t tests.
Figure 3.
Figure 3.
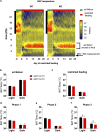
BAT temperature differed only during the last part of the restricted-feeding paradigm. (a) Heat map depicting BAT temperature in 30-minute bins during ad libitum and restricted feeding. The vertical black bar on left indicates dark phase; the vertical, white, dashed line indicates the start of restricted feeding; the horizontal, white, dashed lines frame the feeding window during restricted feeding. Average BAT temperature during (b) ad libitum and (c) restricted feeding conditions. Average BAT temperature during restricted feeding separated into (d) phase 1, (e) phase 2, and (f) phase 3. All data are expressed as mean ± SEM; n = 8 to 10. aP < 0.05 by two-way (repeated measures, where appropriate) ANOVA with Sidak post hoc analysis. BG, blood glucose; BW, body weight.
Figure 4.
Figure 4.
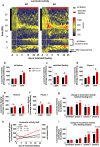
AgRP Crat KO mice exhibited greater FAA. (a) Heat map depicting locomotor activity in 30-minute bins during ad libitum and restricted feeding. The vertical black bar on left indicates dark phase; the dashed lines frame the feeding window during restricted feeding. Average locomotor activity during (b) ad libitum and (c) restricted feeding conditions. Average locomotor activity during restricted feeding separated into (d) phase 1, (e) phase 2, and (f) phase 3. (g) Change of total locomotor activity during the first 4 hours of dark phase relative to ad libitum conditions. (h) Change in activity per day during ZG 3 to 4 (prior feeding window) and ZG 12 to 16 (beginning dark phase) relative to ad libitum conditions. (i) FAA defined as the total activity 1 hour before the feeding window relative to ad libitum conditions. All data are expressed as mean ± SEM; n = 8 to 10. (b–f) aP < 0.05 by two-way (repeated measures, where appropriate) ANOVA with Sidak post hoc analysis; except (g–i) where letters above bars indicate a significant difference between genotype and phase. BG, blood glucose; BW, body weight.

Similar articles

Cited by

References

    1. Carneiro BT, Araujo JF. The food-entrainable oscillator: a network of interconnected brain structures entrained by humoral signals? Chronobiol Int. 2009;26(7):1273–1289. - PubMed
    1. Kosse C, Gonzalez A, Burdakov D. Predictive models of glucose control: roles for glucose-sensing neurones. Acta Physiol (Oxf). 2015;213(1):7–18. - PMC - PubMed
    1. Andermann ML, Lowell BB. Toward a wiring diagram understanding of appetite control. Neuron. 2017; 95(4):757–778. - PMC - PubMed
    1. Blum ID, Lamont EW, Rodrigues T, Abizaid A. Isolating neural correlates of the pacemaker for food anticipation. PLoS One. 2012;7(4):e36117. - PMC - PubMed
    1. Betley JN, Xu S, Cao ZFH, Gong R, Magnus CJ, Yu Y, Sternson SM. Neurons for hunger and thirst transmit a negative-valence teaching signal. Nature. 2015;521(7551):180–185. - PMC - PubMed

Publication types

Substances