. 2018 Jul 1;41(7):zsy079.
doi: 10.1093/sleep/zsy079.

Cortical region-specific sleep homeostasis in mice: effects of time of day and waking experience

Affiliations

Cortical region-specific sleep homeostasis in mice: effects of time of day and waking experience

Mathilde C C Guillaumin et al. Sleep. .

Abstract

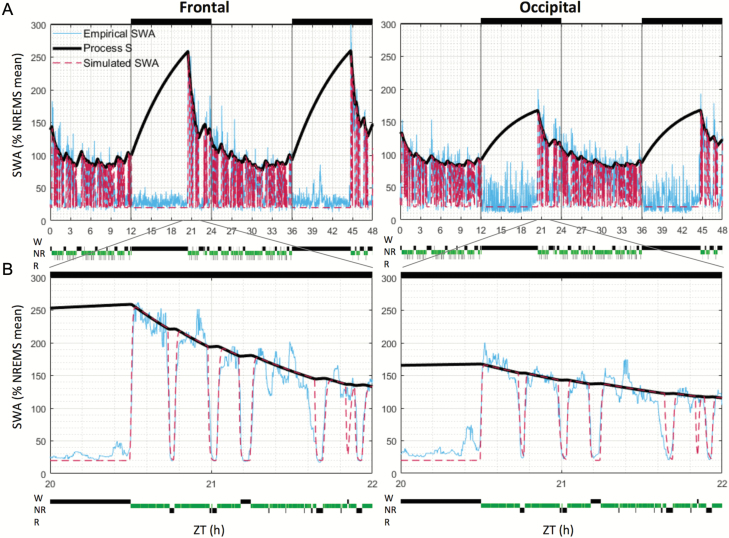
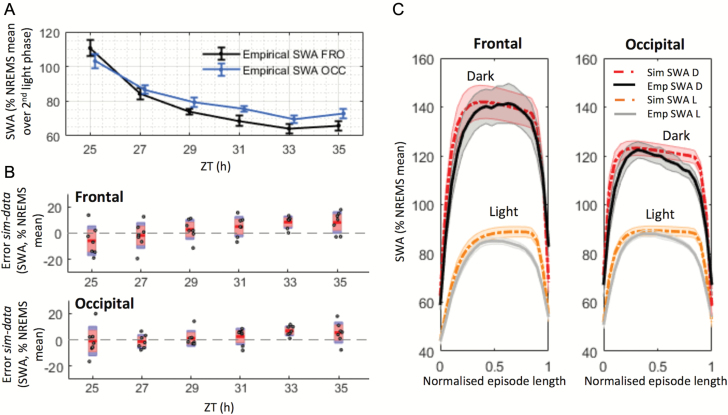
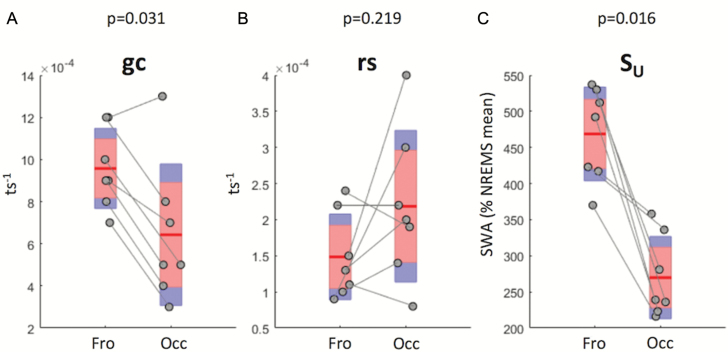
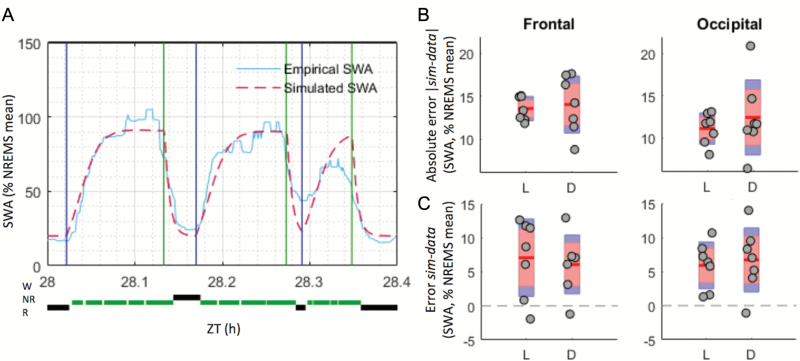
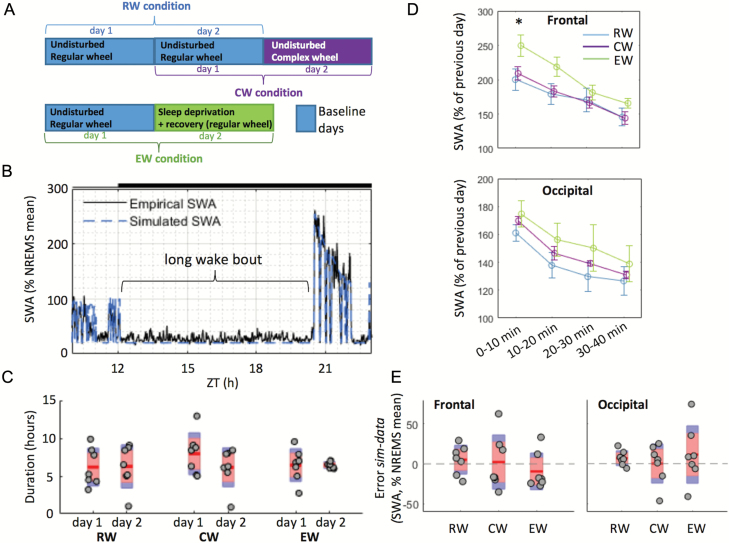
Sleep-wake history, wake behaviors, lighting conditions, and circadian time influence sleep, but neither their relative contribution nor the underlying mechanisms are fully understood. The dynamics of electroencephalogram (EEG) slow-wave activity (SWA) during sleep can be described using the two-process model, whereby the parameters of homeostatic Process S are estimated using empirical EEG SWA (0.5-4 Hz) in nonrapid eye movement sleep (NREMS), and the 24 hr distribution of vigilance states. We hypothesized that the influence of extrinsic factors on sleep homeostasis, such as the time of day or wake behavior, would manifest in systematic deviations between empirical SWA and model predictions. To test this hypothesis, we performed parameter estimation and tested model predictions using NREMS SWA derived from continuous EEG recordings from the frontal and occipital cortex in mice. The animals showed prolonged wake periods, followed by consolidated sleep, both during the dark and light phases, and wakefulness primarily consisted of voluntary wheel running, learning a new motor skill or novel object exploration. Simulated SWA matched empirical levels well across conditions, and neither waking experience nor time of day had a significant influence on the fit between data and simulation. However, we consistently observed that Process S declined during sleep significantly faster in the frontal than in the occipital area of the neocortex. The striking resilience of the model to specific wake behaviors, lighting conditions, and time of day suggests that intrinsic factors underpinning the dynamics of Process S are robust to extrinsic influences, despite their major role in shaping the overall amount and distribution of vigilance states across 24 hr.


Figures

Figure 1.
Figure 1.
Simulated and empirical EEG SWA levels. EEG SWA levels are shown across 48 (A) and 2 hr (B) (from 20 to 22 hr) in one representative mouse, in the frontal (left panels) and occipital (right panels) derivations. Simulation results were plotted with one value per 4 s epoch, although the simulation solver was allowed to take steps of any size < 4 s (see Materials and Methods). SWA levels were normalized (expressed as percentage) against mean SWA over 48 hr in NREMS only. Light and dark phases are represented at the top of the figures (black bars = dark phase). NR = nonrapid eye movement sleep; R = rapid eye movement sleep; W = wake; ZT = zeitgeber time.
Figure 2.
Figure 2.
A close fit was obtained between empirical and simulated SWA levels. (A) The time course of empirical NREMS SWA levels in the light phase of the second day of RW condition in the frontal (FRO) and occipital (OCC) derivations. n = 7; mean ± SEM. 2 hr values of SWA were normalized against the mean over the second light phase only (see Materials and Methods). (B) 2 hr values of the difference between simulated and empirical SWA in the light phase of the second day of RW condition. Only SWA values in NREMS episodes lasting longer than 1 min were included in this analysis. Red area: 95% CI, blue area: 1 SD. Dots represent individual animals. The significance of the results was assessed with an ANOVA for repeated measures (factors “derivation” and “time point”), which revealed a significant main effect of time point (F(5,30) = 5.518, p ≤ 0.001) and a significant interaction derivation*time point (F(5,30) = 5.49, p ≤ 0.001). (C) Average empirical and simulated SWA levels during NREMS episodes, in light (L) and dark (D) periods. Only NREMS episodes lasting >3 min were included (average length = 7.9 ± 3.9 min, mean ± SD). Individual episodes’ lengths were normalized to an arbitrary length of 1, to allow for averaging between episodes. Note that SWA is higher in the dark than in the light period. n = 7, mean ± SEM. ZT = zeitgeber time.
Figure 3.
Figure 3.
Values retained for the three optimized parameters of Process S. (A–C) Mean (red line) and individual animal values (grey circles) of the parameters gc, rs, SU in the frontal (Fro) and occipital (Occ) derivations in the regular-wheel group. ts = 4 s; n = 7; red area: 95% CI, blue area = 1 SD. The significance of the difference in parameter values between derivations was assessed with a nonparametric Wilcoxon signed-rank test; p-values are indicated above each plot. SWA = slow-wave activity; NREMS = nonrapid eye movement sleep.
Figure 4.
Figure 4.
The SWA simulation fits empirical data similarly well in the light (L) and dark (D) phases. (A) Example of how the difference between mean values of empirical and simulated SWA levels (plotted with one value per 4 s epoch) were taken for each NREMS episode, before being averaged over L or D phases (see Materials and Methods). Beginning and end of NREMS episodes (i.e. where each simulated and empirical SWA means are calculated) are indicated, respectively, with blue and green vertical lines. For each NREMS episode (delimited by a blue and green line), one average SWA value was computed, as required by the optimization process chosen. Here, only 24 min from one animal are shown for clarity. (B) Mean (red line) and individual (grey circles) absolute differences between simulated and empirical SWA levels in the RW group. Values calculated over NREMS episodes lasting longer than 1 min; n = 7. Red area: 95% CI, blue area: 1 SD. Significance was assessed with a two-way ANOVA for repeated-measures, factors “derivation” and “light phase.” No significant main effect or interaction were found (derivation, p = 0.056; light phase, p = 0.529; interaction, p = 0.488). (C) As in (B), but the error (and not absolute error) value of the difference d = SWAsimulation – SWAempirical is kept, allowing to see whether the model over- (positive difference) or under-estimated the empirical data. No significant main effect or interaction was found (derivation, p = 0.873; light phase, p = 0.956; interaction, p = 0.136). NR = NREMS; R = rapid eye movement sleep; sim = simulation; W = wake; ZT= zeitgeber time.
Figure 5.
Figure 5.
Impact of waking behaviour on SWA levels and on the accuracy of the model’s predictions following long wake bouts (Supplementary Material). (A) Definition of the 48 hr recordings used for each group: RW, CW, and EW. Blue rectangles: days used for optimization of the parameters; purple and green rectangles: days for which predictions were made. (B) Representation of a typical long wake bout in one animal from the RW group (plotted with one value per 4 s epoch). (C) Average “long wake bout” durations across three conditions (RW, CW, EW) in the first and second days. In each condition, n = 7; red area: 95% CI, blue area: 1 SD; grey circles represent individual animals. A mixed-design ANOVA (factors “condition” and “day”) revealed no significant main effects or interaction. (D) Time course of EEG SWA in NREMS during the 40 min following long wake bouts (10 min intervals) in three conditions. Mean ± SEM, n = 7 in each condition. SWA levels were normalized against mean SWA levels in NREMS during the previous 24 hr of baseline. An ANOVA followed by independent t-tests revealed a significantly higher value in the EW group in the frontal derivation in the first 10 min only (t(12) = −2.272, p = 0.042). (E) Average error between empirical data and simulations in three conditions in 40 min following long wake bouts (day 2). Only NREMS epochs were considered. For each condition, n = 7; red area: 95% CI, blue area: 1 SD; grey circles represent individual animals. The significance of the results was assessed using a mixed design two-way ANOVA (factors “derivation” and “condition”). There was no significant main effect of group or derivation, and no significant interaction group*derivation. sim = simulation; ZT = zeitgeber time.

Similar articles

Cited by

References

    1. Brown RE, et al. . Control of sleep and wakefulness. Physiol Rev. 2012;92(3):1087–1187. doi:10.1152/physrev.00032.2011 - PMC - PubMed
    1. Daan S, et al. . Timing of human sleep: recovery process gated by a circadian pacemaker. Am J Physiol. 1984;246(2 Pt 2):R161–R183. - PubMed
    1. Dijk DJ, et al. . EEG power density during nap sleep: reflection of an hourglass measuring the duration of prior wakefulness. J Biol Rhythms. 1987;2(3):207–219. - PubMed
    1. Duffy JF, et al. . Effect of light on human circadian physiology. Sleep Med Clin. 2009;4(2):165–177. - PMC - PubMed
    1. Fuller PM, et al. . Neurobiology of the sleep-wake cycle: sleep architecture, circadian regulation, and regulatory feedback. J Biol Rhythms. 2006;21(6):482–493. - PubMed

Publication types