. 2018 Dec;44(12):1857-1863.
doi: 10.1037/xlm0000553. Epub 2018 Apr 26.

The variability puzzle in human memory

Affiliations

The variability puzzle in human memory

Michael J Kahana et al. J Exp Psychol Learn Mem Cogn. 2018 Dec.

Abstract

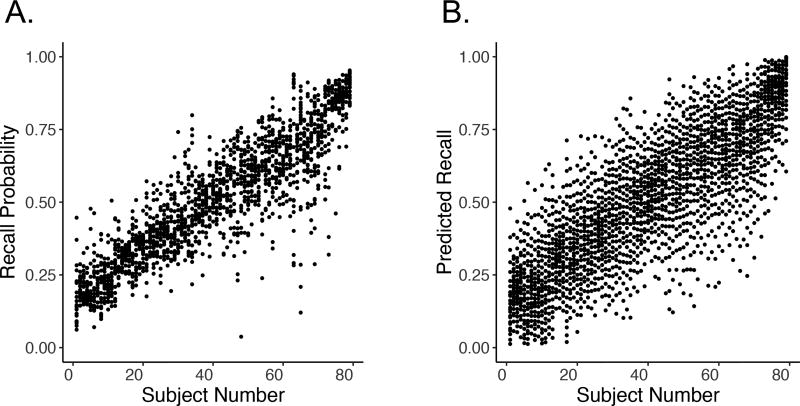
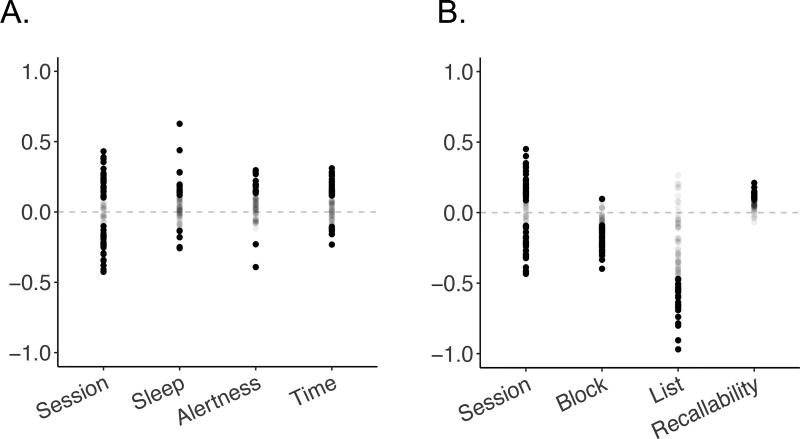
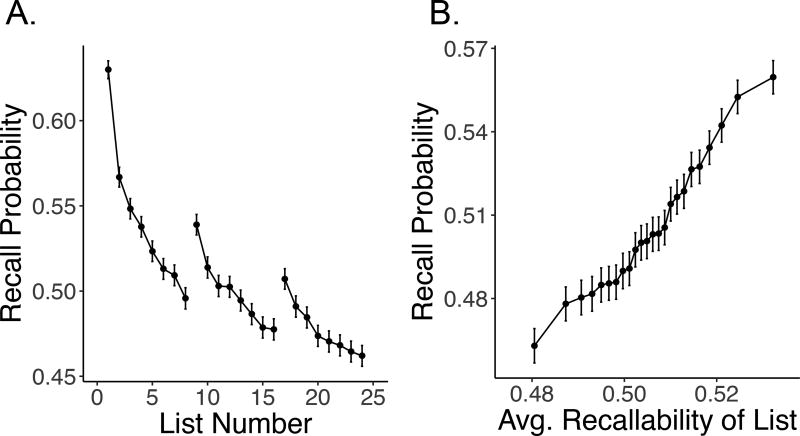
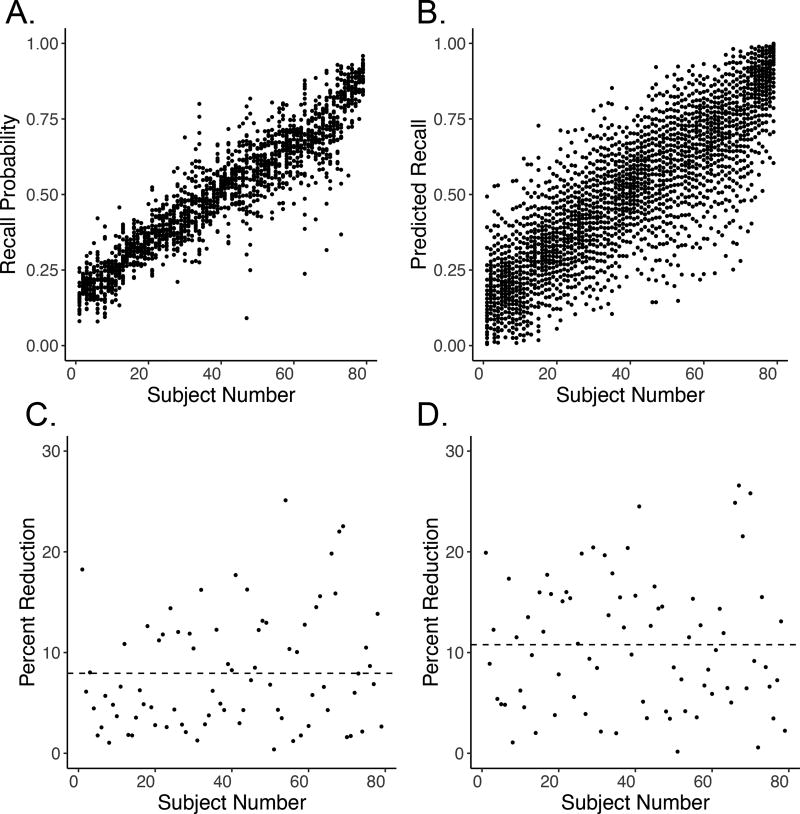
Memory performance exhibits a high level of variability from moment to moment. Much of this variability may reflect inadequately controlled experimental variables, such as word memorability, past practice and subject fatigue. Alternatively, stochastic variability in performance may largely reflect the efficiency of endogenous neural processes that govern memory function. To help adjudicate between these competing views, the authors conducted a multisession study in which subjects completed 552 trials of a delayed free-recall task. Applying a statistical model to predict variability in each subject's recall performance uncovered modest effects of word memorability, proactive interference, and other variables. In contrast to the limited explanatory power of these experimental variables, performance on the prior list strongly predicted current list recall. These findings suggest that endogenous factors underlying successful encoding and retrieval drive variability in performance. (PsycINFO Database Record (c) 2018 APA, all rights reserved).


Figures

Figure 1
Figure 1. Variability in free recall
A. Inter-session variability. Each dot represents the proportion of words recalled for a single subject in a single session. B. Inter-list variability. Each dot here represents the proportion of words recalled for a single subject on 23 lists, one list taken from each session, ranked by within-session recall performance.
Figure 2
Figure 2. Distributions of beta values for each predictor variable
Each circle denotes the normalized regression coefficient for a single subject, with filled circles indicating coefficients that met an FDR correct p < 0.05 significance criterion. Panel A shows the four variables included in the intersession-variability model; Panel B shows the four variables included in the interlist-variability model.
Figure 3
Figure 3. Predictors of interlist variability
A. Within each session, recall decreased across successive lists, but increased following the two breaks, consistent with a proactive interference account. B. Sorting lists into 24 equally populous bins of predicted recallability we can see that the average recallability of each word within a given list reliably predicts overall list recall. For each subject, recallability was determined based on data from all of the other subjects (see text for details). Error bars indicate ±1SEM.
Figure 4
Figure 4. Residual variability in recall
A. Inter-session variability. Each dot represents the proportion of words recalled for a single subject in a single session after removing variability accounted for by each subjects predictive model. B. Inter-list variability. Each dot here represents the adjusted proportion of words recalled for a single subject on 23 lists, one list taken from each session, ranked by within-session recall performance. In this analysis, recall probability was adjusted for each subject according to his or her predictive model, such that the resulting graphs illustrate the residual variability after accounting for the variables in Table 1. C., D. show the percent reduction by the models for each of the subjects. The dashed lines represent the mean percent reductions.

References

    1. Bates D, Mächler M, Bolker B, Walker S. Fitting linear mixed-effects models using lme4. arXiv preprint arXiv:1406.5823 2014
    1. Battig WF. Within-individual differences in “cognitive” processes. Information Processing and Cognition. 1975:195–228.
    1. Battig WF. Are the important “individual differences” between or within individuals? Journal of Research in Personality. 1979;13:546–558.
    1. Brown GDA, Neath I, Chater N. A temporal ratio model of memory. Psychological Review. 2007;114:539–576. doi: 10.1037/0033-295X.114.3.539. doi: - DOI - PubMed
    1. Campbell J. Consumption-based asset pricing. In: Constantinides G, Harris M, Stulz R, editors. Handbook of the Economics of Finance. IB. North-Holland: Amsterdam; 2003. pp. 803–887.