. 2018 Aug 1;125(2):642-653.
doi: 10.1152/japplphysiol.01020.2017. Epub 2018 Apr 26.

Kinematic patterns while walking on a slope at different speeds

Affiliations

Kinematic patterns while walking on a slope at different speeds

A H Dewolf et al. J Appl Physiol (1985). .

Abstract

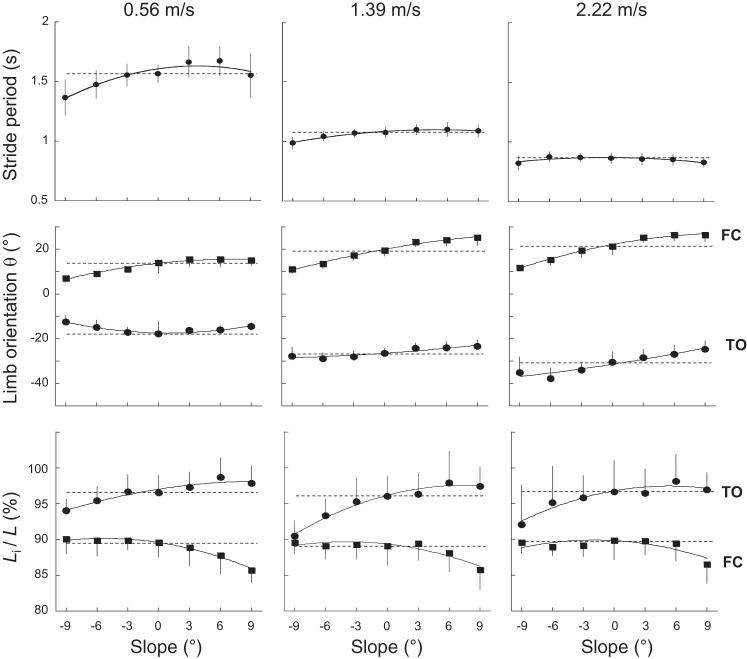
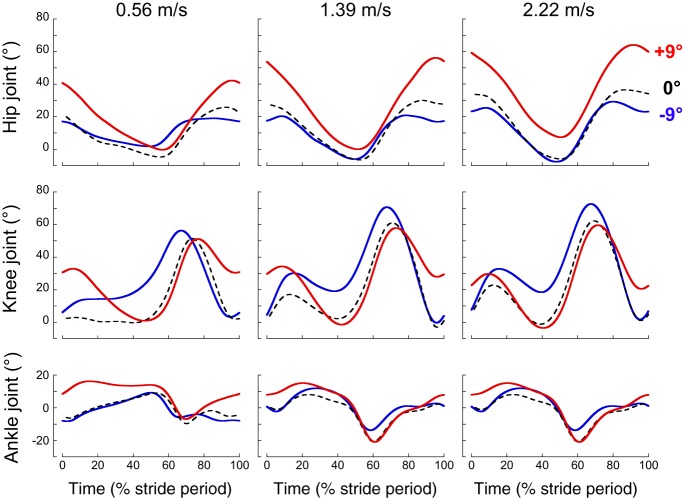
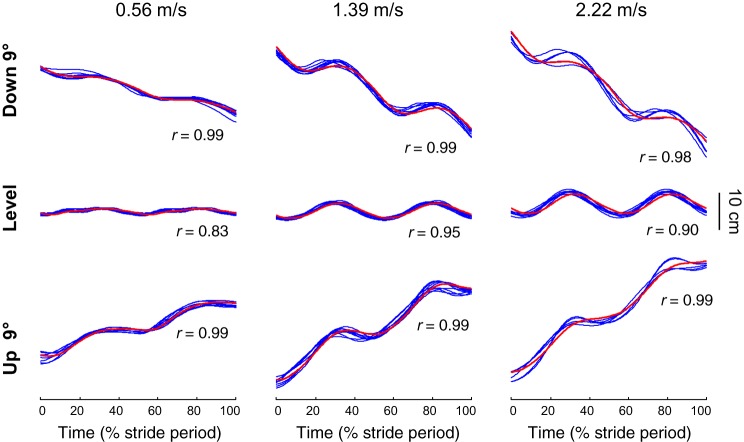
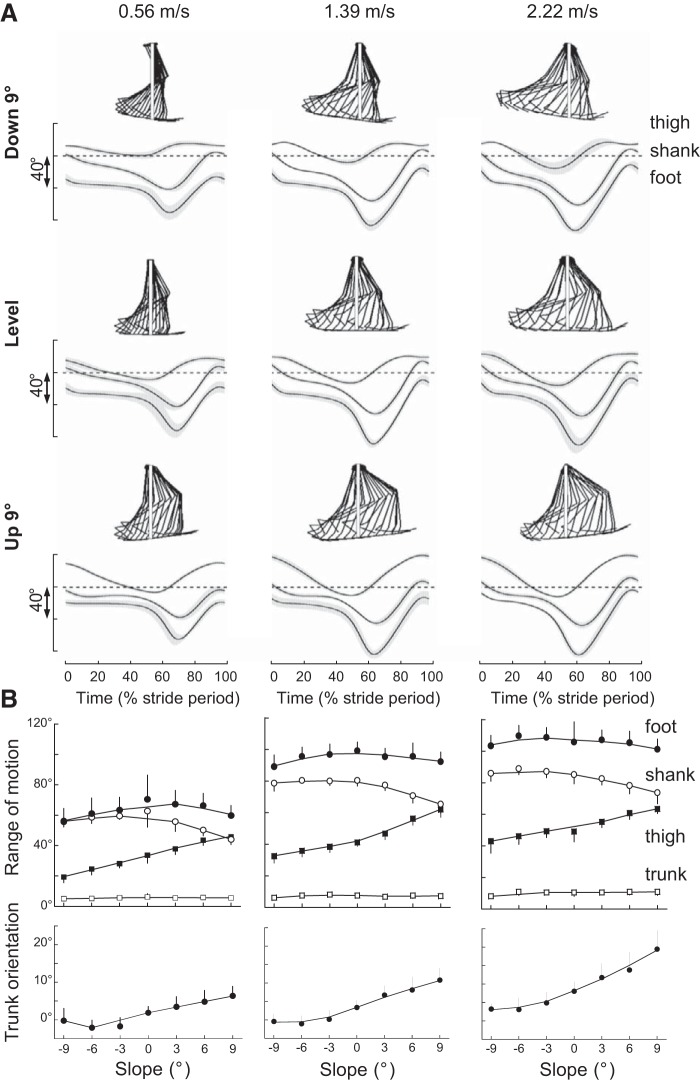
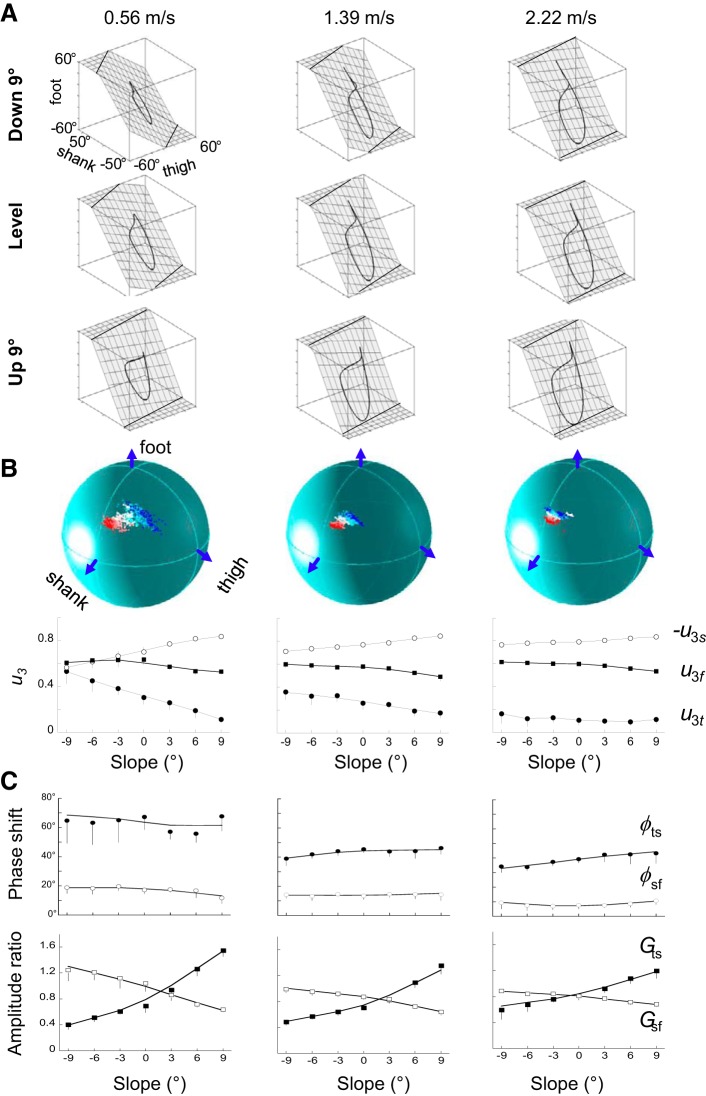
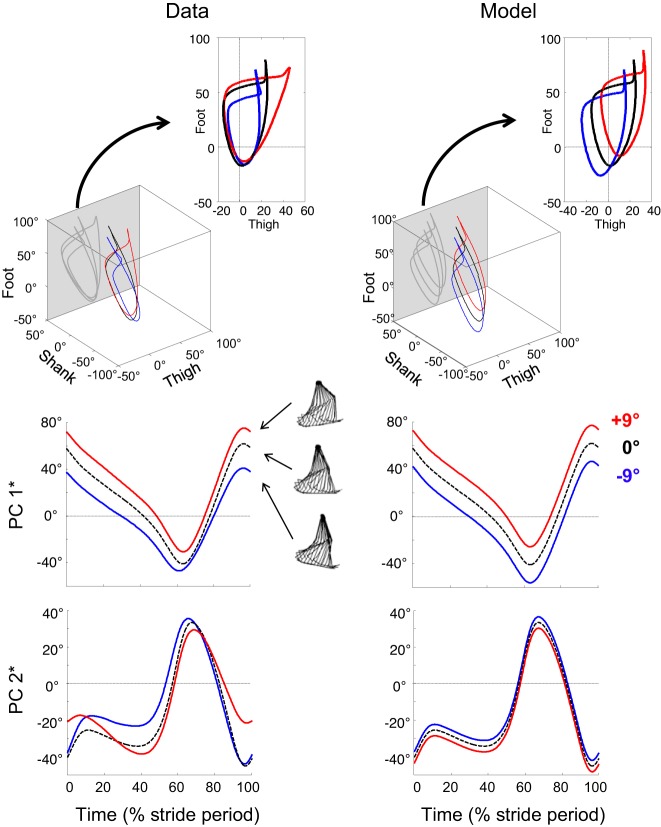
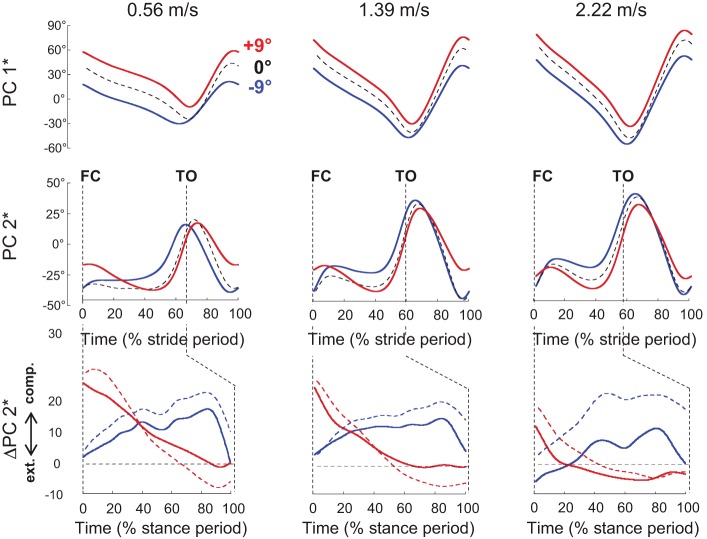
During walking, the elevation angles of the thigh, shank, and foot (i.e., the angle between the segment and the vertical) covary along a characteristic loop constrained on a plane. Here, we investigate how the shape of the loop and the orientation of the plane, which reflect the intersegmental coordination, change with the slope of the terrain and the speed of progression. Ten subjects walked on an inclined treadmill at different slopes (between -9° and +9°) and speeds (from 0.56 to 2.22 m/s). A principal component analysis was performed on the covariance matrix of the thigh, shank, and foot elevation angles. At each slope and speed, the variance accounted for by the two principal components was >99%, indicating that the planar covariation is maintained. The two principal components can be associated to the limb orientation (PC1*) and the limb length (PC2*). At low walking speeds, changes in the intersegmental coordination across slopes are characterized mainly by a change in the orientation of the covariation plane and in PC2* and to a lesser extent, by a change in PC1*. As speed increases, changes in the intersegmental coordination across slopes are more related to a change in PC1 *, with limited changes in the orientation of the plane and in PC 2*. Our results show that the kinematic patterns highly depend on both slope and speed. NEW & NOTEWORTHY In this paper, changes in the lower-limb intersegmental coordination during walking with slope and speed are linked to changes in the trajectory of the body center of mass. Modifications in the kinematic pattern with slope depend on speed: at slow speeds, the net vertical displacement of the body during each step is related to changes in limb length and orientation. When speed increases, the vertical displacement is mostly related to a change in limb orientation.

Keywords: intersegmental coordination; kinematics; planar covariation; slope; walking.


Conflict of interest statement

No conflicts of interest, financial or otherwise, are declared by the authors.

Figures

Fig. 1.
Fig. 1.
Stride period, limb orientation, and limb length as a function of slope at slow, intermediate, and fast walking speed. Top: stride period; middle: orientation of the limb relative to vertical at foot contact [FC; θfc (■)] and toe off [TO; θto (●)]; bottom: length of the limb (Li), expressed as a percent of the length (L), measured during standing at FC [Lfc (■)] and at TO [Lto (●)]. Horizontal dotted lines correspond to the data obtained on the level. Symbols and bars represent the grand means of the subjects and the SDs (when the length of the bar exceeds the size of the symbol). The continuous lines were drawn through experimental data (using a weighted mean function, KaleidaGraph 4.5; Synergy Software, Reading, PA).
Fig. 2.
Fig. 2.
Lower-limb joint angles at 3 different slopes at slow-, intermediate-, and fast-walking speeds. Ensemble average of the hip (top), knee (middle), and ankle (bottom) joint angles over a stride during walking at +9° (red curves), −9° (blue curves), and 0° (black interrupted lines). All of the curves of each subject walking at a given speed and on a given slope were first averaged (mean curve). The curves presented here are the average of the mean curves of the 10 subjects (ensemble average). Zero percent and 100% correspond to the right-foot contact.
Fig. 3.
Fig. 3.
Center of mass (COM) and hips vertical displacement at slow-, intermediate-, and fast-walking speed. Ensemble-average vertical displacement of the COM of the 10 subjects (red curve) over a stride during walking at −9° (top), +9° (bottom), and on the level (middle). Each blue line represents the mean curve of the vertical displacement of the hips (see methods) of a subject. In each condition, r corresponds to the average Pearson’s correlation coefficient between the COM and the hips vertical displacement.
Fig. 4.
Fig. 4.
Elevation angles of lower-limb segments during walking at slow-, intermediate-, and fast-walking speeds. A: ensemble-average elevation angles of the thigh, shank, and foot over a stride at −9° (top), +9° (bottom), and on the level (middle) at 0.56 (left), 1.39 (middle), and 2.22 (right) m/s. The gray zone represents ±1 SD. The interrupted lines correspond to 0° for the thigh and shank segments and to 90° for the foot segment. In each condition, the stickman illustrates the position of the segments, every 5% of a typical stride of 1 subject. The white continuous lines correspond to vertical. B: range of motion of all body segments over 1 stride (top) and average orientation of the trunk (bottom) as a function of slope at 0.56 (left), 1.39 (middle), and 2.22 (right) m/s. Other indications are as in Fig. 1.
Fig. 5.
Fig. 5.
Planar covariation of elevation angles. A: covariation of the limb-segment elevation angles during walking at −9° (top), +9° (bottom), and on the level (middle) at 0.56 (left), 1.39 (middle), and 2.22 (right) m/s. Each trace represents the ensemble average (see definition in Fig. 2). Grids show the best-fitting plane. B, bottom: third eigenvector direction cosines for thigh, shank, and foot (u3t, −u3s, u3f) of the normal to the covariation plane (u3 vector) as a function of slope at 0.56 (left), 1.39 (middle), and 2.22 (right) m/s. Other indications are as in Fig. 1. Top: spatial distribution of the normal to the principal plane (u3) in the 3-dimensional space, defined by the elevation angles in each slope at 0.56 (left), 1.39 (middle), and 2.22 (right) m/s. White symbols correspond to level walking. The red color gradients are for the positive slopes (the darker the color, the steeper the slope), whereas the blue color gradients are for the negative slopes. C: phase shift (ϕ; top) and amplitude ratio (G; bottom) between the first harmonics of adjacent lower-limb segments (ts, thigh/shank; sf, shank/foot). Other indications are as in Fig. 1.
Fig. 6.
Fig. 6.
Decomposition of planar covariation in the reoriented principal component associated to limb orientation (PC1*) and to limb length (PC2*). Top: covariation of limb-segment elevation angles during walking at 1.39 m/s on a −9° (blue) and a +9° (red) slope and on the level (black interrupted line). Insets: projection of the gait loops on the thigh-foot plane (gray planes of the cubes). The loops were decomposed in PC1* and PC2* (see methods), corresponding to limb orientation and limb length, respectively. Middle and bottom: variation of PC1* and PC2* over a stride. All curves are ensemble average. Left: actual data of the covariation of limb-segment elevation angles. Right: data obtained by simulation of a passive tilt of the compass-gait model relative to the slope. Data on the level (black curve) are the same as the left. The red and blue loops and decomposition in PC1* and PC2* are obtained by addition of +9° (uphill) or −9° (downhill) to the elevation angles of the thigh, shank, and foot, measured on the level.
Fig. 7.
Fig. 7.
Limb length- and limb orientation-related angular covariance at slow-, intermediate-, and fast-walking speed. Top and middle: ensemble-average reoriented principal component associated to limb orientation (PC1*) and to limb length (PC2*) over a complete stride during walking at +9° (red), −9° (blue), and on the level (black interrupted line). Bottom: ΔPC2* is computed by subtracting PC2* on the level from PC2* at +9° (continuous red lines) and from PC2* at −9° (continuous blue lines) during the stance period. Likewise, the knee-angle time curves (presented in Fig. 2) on the level were subtracted from those at +9° (interrupted red lines) and at −9° (interrupted blue lines). comp., compressed; ext., extended; FC, foot contact; TO, toe off.

References

    1. Alexander N, Schwameder H. Effect of sloped walking on lower limb muscle forces. Gait Posture 47: 62–67, 2016. doi:10.1016/j.gaitpost.2016.03.022. - DOI - PubMed
    1. Alexander RM. Human walking and running. J Biol Educ 18: 135–140, 1984. doi:10.1080/00219266.1984.9654619. - DOI
    1. Alexander RM. Tendon elasticity and positional control. Behav Brain Sci 18: 745, 1995. doi:10.1017/S0140525X00040711. - DOI
    1. Amirudin AN, Parasuraman S, Kadirvel A, Ahmed Khan MK, Elamvazuthi I. Biomechanics of hip, knee and ankle joint loading during ascent and descent walking. Proc Comp Sci 42: 336–344, 2014. doi:10.1016/j.procs.2014.11.071. - DOI
    1. Ampatzis K, Song J, Ausborn J, El Manira A. Separate microcircuit modules of distinct v2a interneurons and motoneurons control the speed of locomotion. Neuron 83: 934–943, 2014. doi:10.1016/j.neuron.2014.07.018. - DOI - PubMed

Publication types

LinkOut - more resources