. 2018 Apr 26;14(4):e1006148.
doi: 10.1371/journal.pcbi.1006148. eCollection 2018 Apr.

Organization of the core respiratory network: Insights from optogenetic and modeling studies

Affiliations

Organization of the core respiratory network: Insights from optogenetic and modeling studies

Jessica Ausborn et al. PLoS Comput Biol. .

Abstract

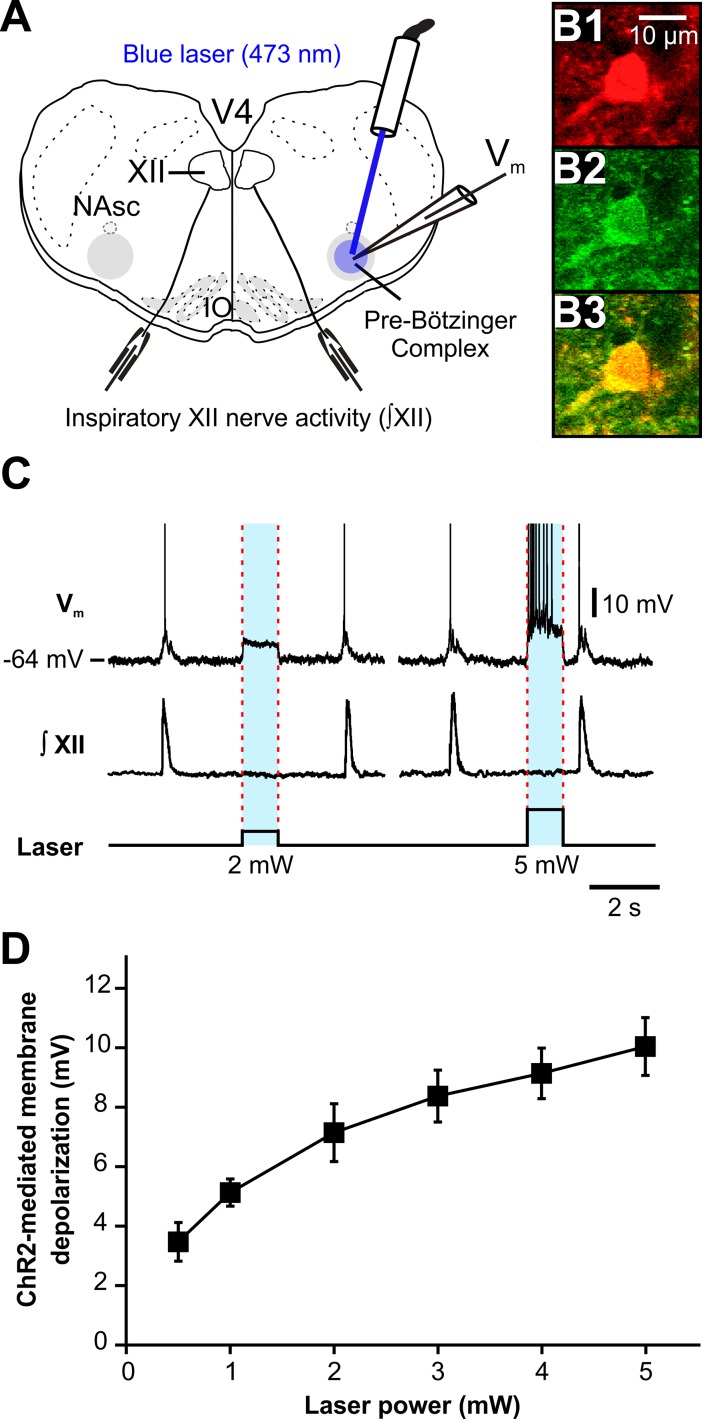
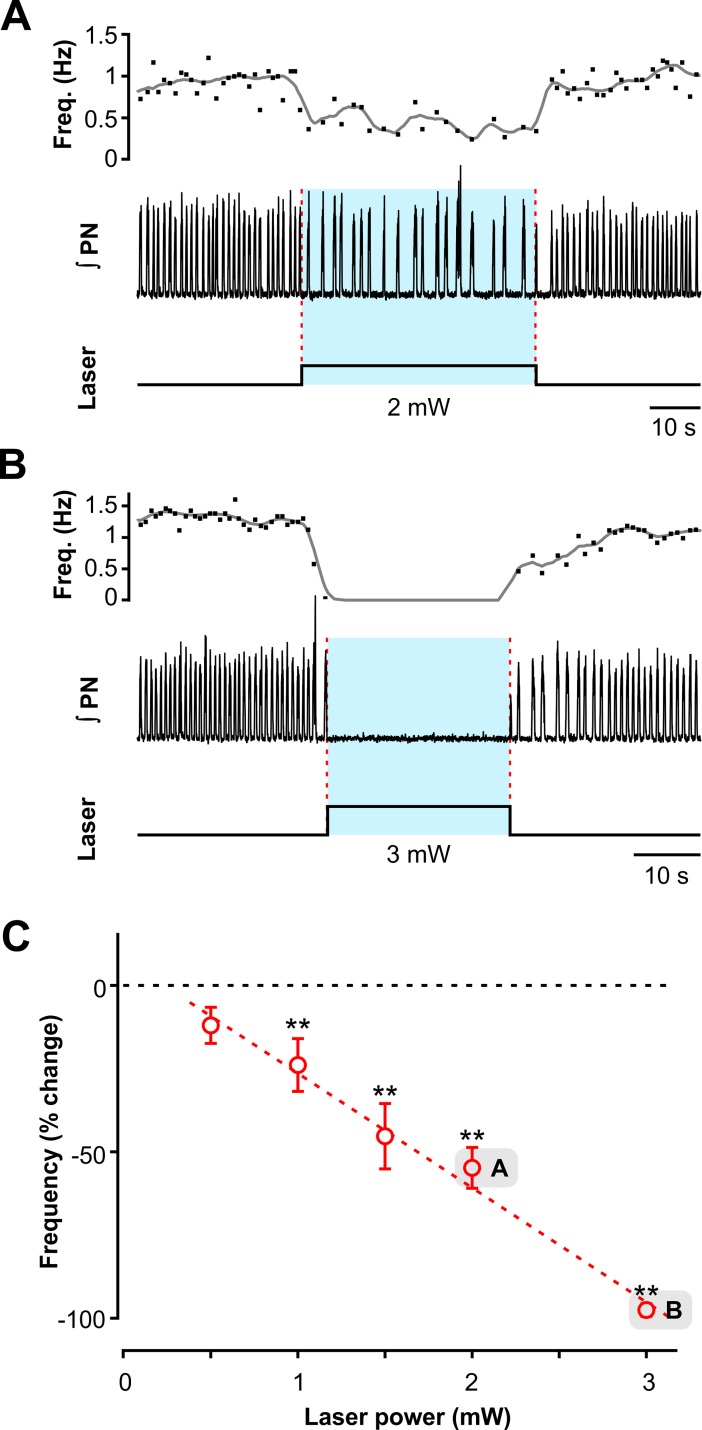
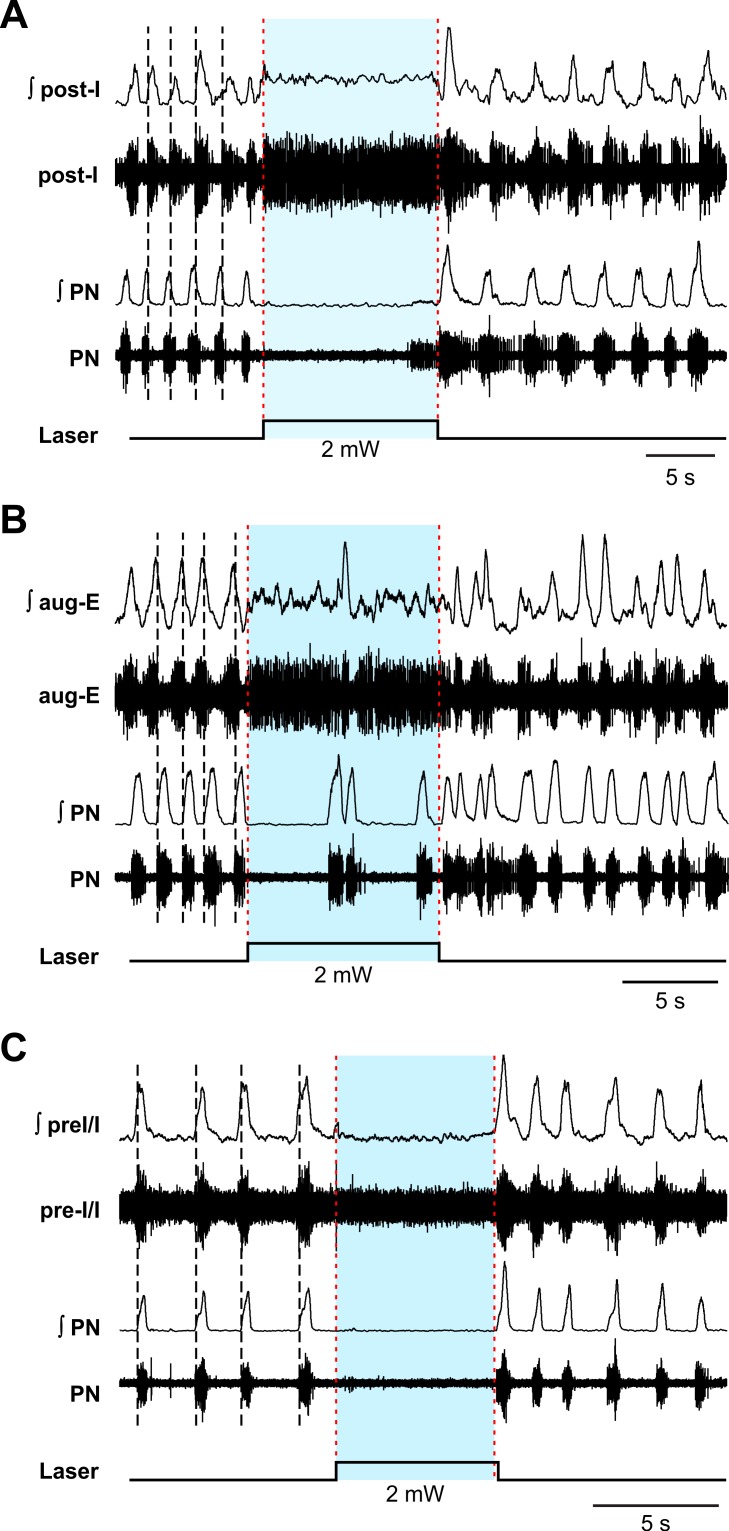
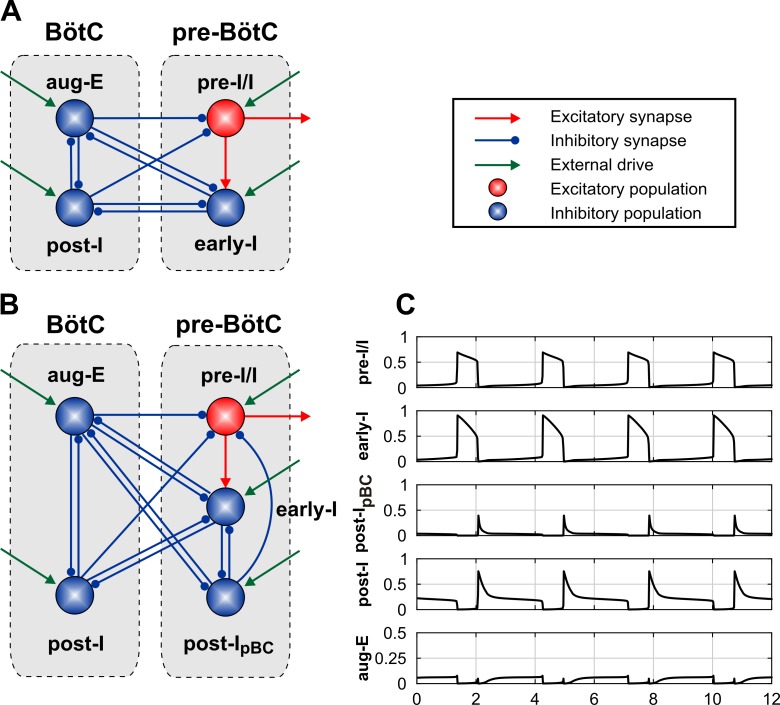
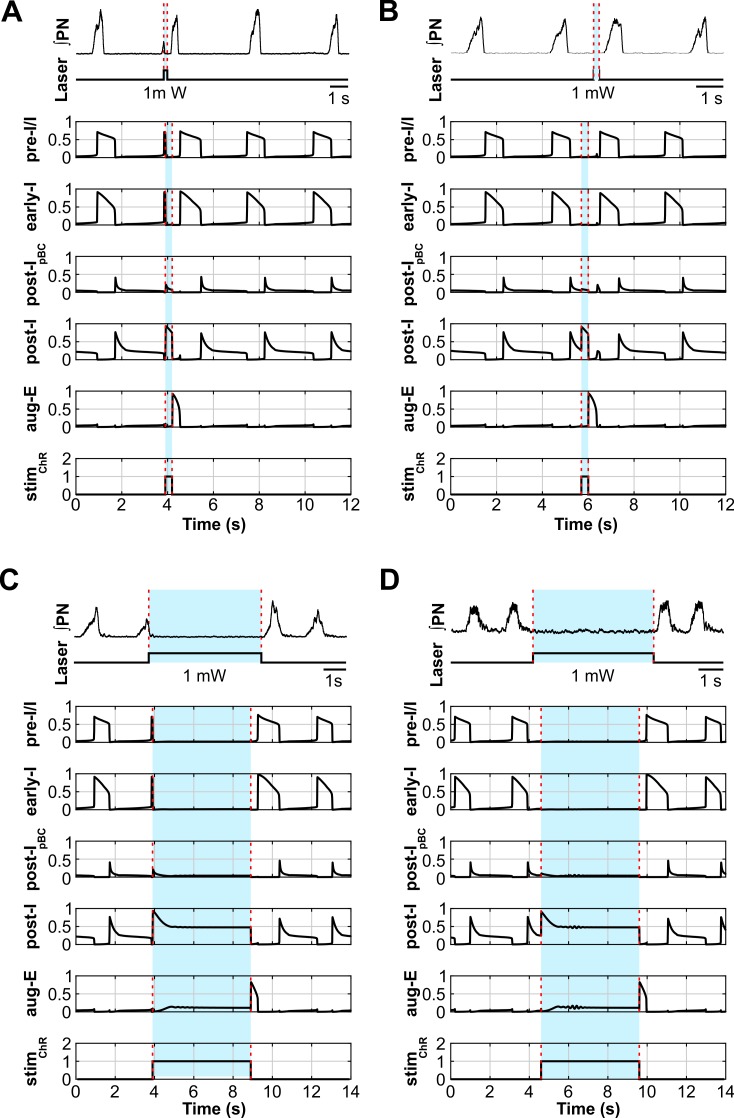
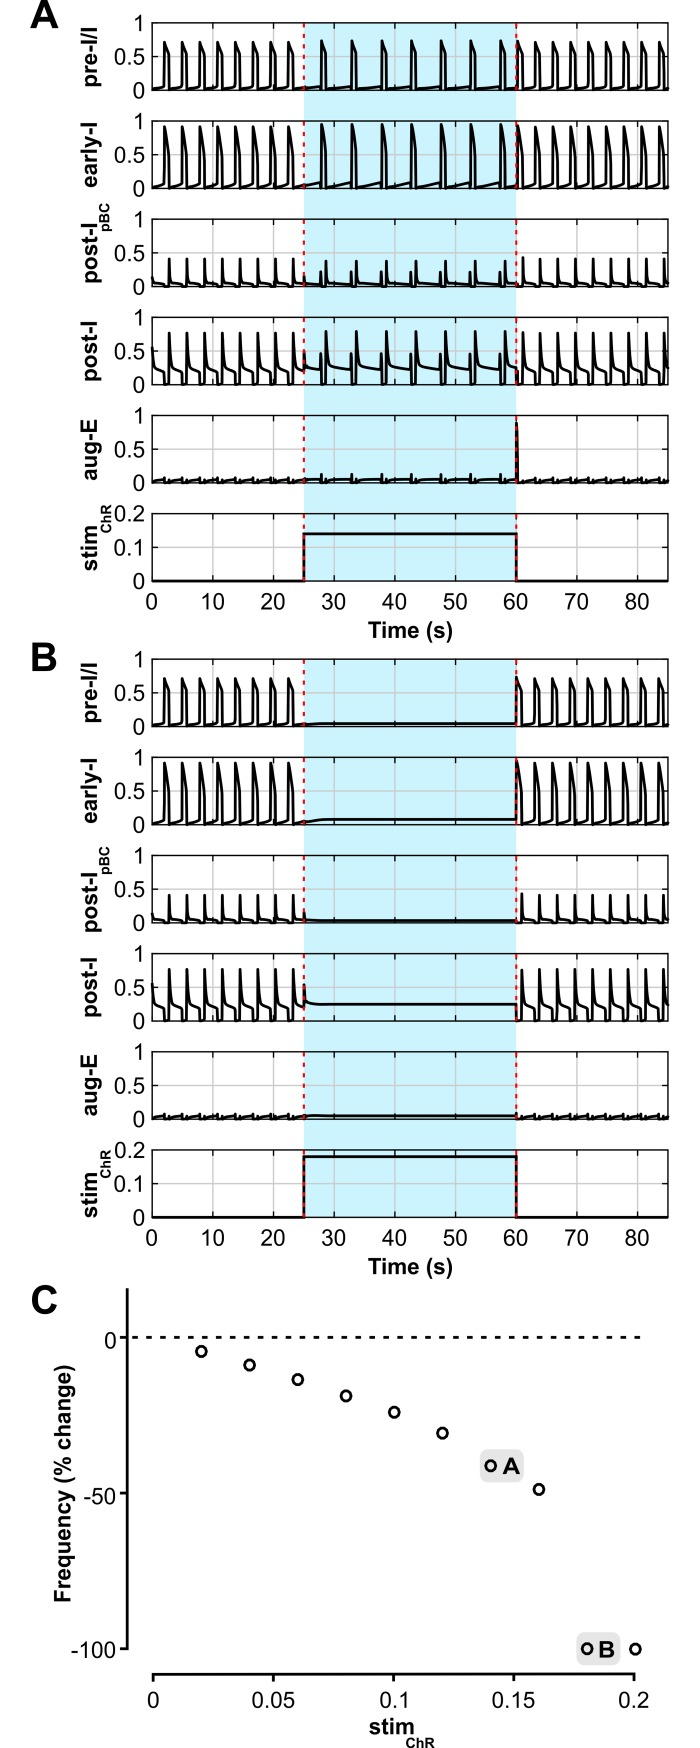
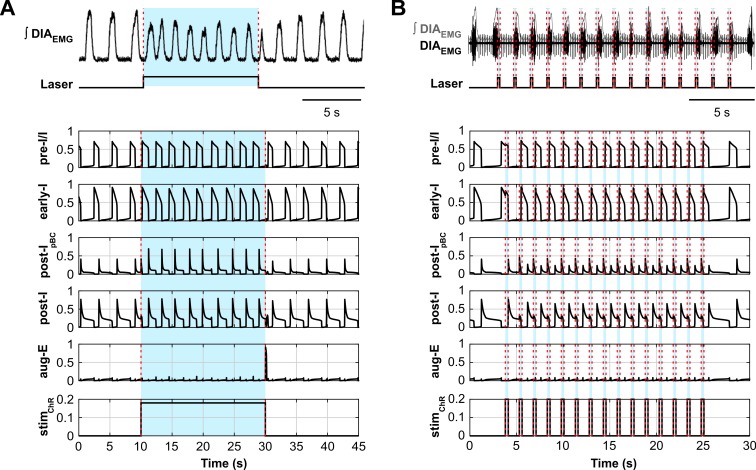
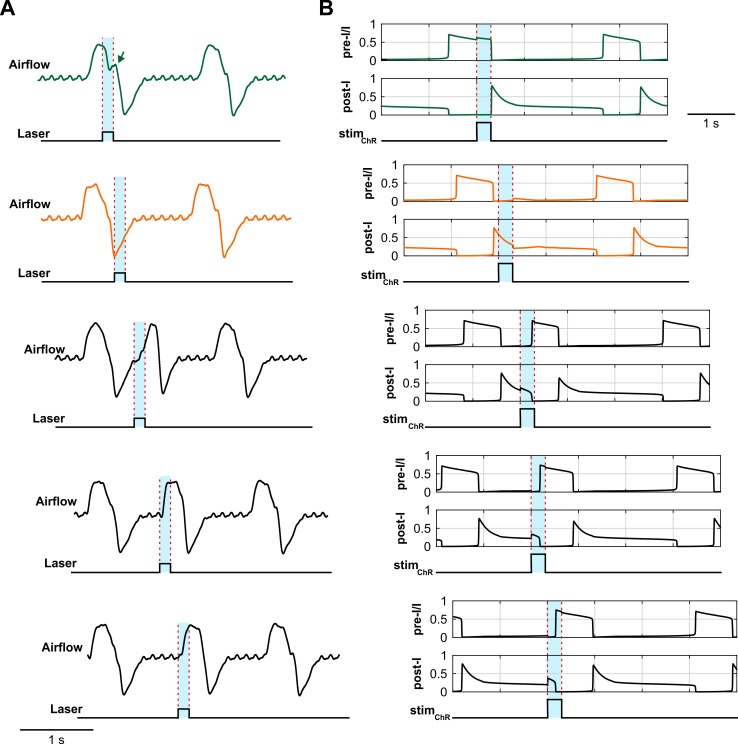
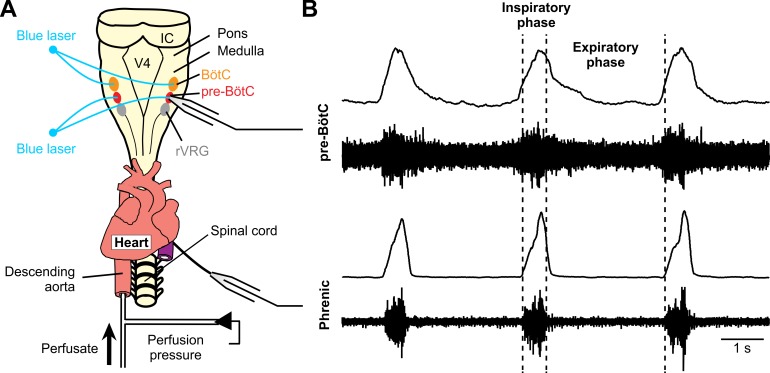
The circuit organization within the mammalian brainstem respiratory network, specifically within and between the pre-Bötzinger (pre-BötC) and Bötzinger (BötC) complexes, and the roles of these circuits in respiratory pattern generation are continuously debated. We address these issues with a combination of optogenetic experiments and modeling studies. We used transgenic mice expressing channelrhodopsin-2 under the VGAT-promoter to investigate perturbations of respiratory circuit activity by site-specific photostimulation of inhibitory neurons within the pre-BötC or BötC. The stimulation effects were dependent on the intensity and phase of the photostimulation. Specifically: (1) Low intensity (≤ 1.0 mW) pulses delivered to the pre-BötC during inspiration did not terminate activity, whereas stronger stimulations (≥ 2.0 mW) terminated inspiration. (2) When the pre-BötC stimulation ended in or was applied during expiration, rebound activation of inspiration occurred after a fixed latency. (3) Relatively weak sustained stimulation (20 Hz, 0.5-2.0 mW) of pre-BötC inhibitory neurons increased respiratory frequency, while a further increase of stimulus intensity (> 3.0 mW) reduced frequency and finally (≥ 5.0 mW) terminated respiratory oscillations. (4) Single pulses (0.2-5.0 s) applied to the BötC inhibited rhythmic activity for the duration of the stimulation. (5) Sustained stimulation (20 Hz, 0.5-3.0 mW) of the BötC reduced respiratory frequency and finally led to apnea. We have revised our computational model of pre-BötC and BötC microcircuits by incorporating an additional population of post-inspiratory inhibitory neurons in the pre-BötC that interacts with other neurons in the network. This model was able to reproduce the above experimental findings as well as previously published results of optogenetic activation of pre-BötC or BötC neurons obtained by other laboratories. The proposed organization of pre-BötC and BötC circuits leads to testable predictions about their specific roles in respiratory pattern generation and provides important insights into key circuit interactions operating within brainstem respiratory networks.


Conflict of interest statement

The authors have declared that no competing interests exist.

Figures

Fig 1
Fig 1. Spatial distribution of Cre-dependent tdTomato-labeled neurons in the medullary reticular formation in VGAT-tdTomato double Tg mouse strain.
(A) Confocal fluorescence microscopy images of parasagittal sections at the level of NA (immunostained with ChAT antibody, white). (B and C) Coronal sections at the level of the BötC (B) and the pre-BötC (C) showing extensive distribution of VGAT-Cre driven tdTomato labeled neuronal somas and processes (red) throughout the ventral medullary reticular formation in an adult VGAT-tdTomato mouse. Abbreviations: pre-BötC, pre-Bötzinger complex; BötC, Bötzinger complex; rVRG, rostral ventrolateral respiratory group, NAc and NAsc, nucleus ambiguus (NA) compact and semi-compact subdivisions; VS, ventral surface; d, dorsal; c, caudal; m, medial.
Fig 2
Fig 2. Glycine and GABA antibody, and ChR2-EYFP expression in Cre-dependent tdTomato-labeled neurons in the pre-BötC region in VGAT-tdTomato or VGAT-tdTomato-ChR2-EYFP mouse strains.
(A) Confocal fluorescence microscopy images of the pre-BötC region at low magnification (upper panels) and a pre-BötC subregion at higher magnification (lower panels) in a representative fixed coronal section from an adult VGAT-tdTomato mouse showing VGAT-Cre dependent tdTomato-labeled neurons (red) and glycine antibody labeling of neurons (green), and co-localization (arrows) of glycine antibody labeling in VGAT-expressing pre-BötC neurons in merged images (Yellow). Example of VGAT-expressing tdTomato-labeled neuron without glycine antibody expression (arrowhead) in this histological section is also indicated. (B) Confocal fluorescence microscopy images of a subregion within the pre-BötC in a fixed coronal section from the VGAT-tdTomato mouse line, showing VGAT-Cre dependent tdTomato labeling (red) and GABA antibody labeling (green) in pre-BötC neurons. Merged image illustrates co-localization of GABA antibody labeling in tdTomato-labeled neurons. Examples of tdTomato-labeled neurons without GABA antibody expression (arrowheads) are also indicated. (C) Two-photon microscopy single optical plane “live” images of the pre-BötC subregion in an in vitro neonatal medullary slice from the VGAT-tdTomato-ChR2-EYFP mouse line, illustrating that tdTomato-labeled VGAT-positive pre-BötC neurons (red) express ChR2-EYFP (green) in somal membranes, as confirmed in the merged image. All images have the same dorso-medial anatomical orientation. Abbreviations: d, dorsal; m, medial; NA, nucleus ambiguus; VS, ventral surface.
Fig 3
Fig 3. Photostimulation causes membrane depolarization of rhythmically active ChR2-expressing pre-BötC inspiratory VGAT-positive neurons in vitro.
(A) Schematic of the in vitro rhythmic slice preparation from a neonatal VGAT-ChR2 transgenic mouse illustrating whole-cell current-clamp recordings from pre-BötC inspiratory VGAT-positive neurons with unilateral pre-BötC laser illumination (0.5–5 mW) and suction-electrode recordings from hypoglossal (XII) nerves to monitor inspiratory activity. NAsc, semi-compact division of nucleus ambiguus; V4, fourth ventricle; IO, inferior olivary nucleus. The pre-BötC regions are indicated by gray circles (~300 μm diameter). (B) Two-photon single-optical plane images of a pre-BötC inspiratory neuron targeted for whole-cell recording, showing VGAT-Cre driven tdTomato labeling (B1), ChR2-EYFP expression (B2) and confirmed co-expression in merged image (B3). (C) Current-clamp recording from a VGAT-positive inhibitory pre-BötC inspiratory neuron in B illustrating inspiratory spikes synchronized with integrated inspiratory XII nerve activity (∫XII). The membrane potential (Vm) of this neuron was depolarized by ~7 mV at 2 mW and by ~10 mV at 5 mW of laser power (spikes are truncated). The neuron was hyperpolarized from resting baseline potential to -64 mV by applied constant current in this example to reveal the magnitude of the light-induced membrane depolarization. The lower trace indicates the duration and amplitude of the laser stimulation. (D) Summary data (n = 8 neurons from 3 slice preparations, mean ± SEM) showing that ChR2-mediated membrane depolarization of VGAT-positive pre-BötC inspiratory neurons was laser power-dependent.
Fig 4
Fig 4. Perturbations of the respiratory rhythm by bilateral photostimulation of VGAT-expressing inhibitory neurons within the pre-Bötzinger complex in situ.
(A-F) Representative examples of the effects of short light pulses of different intensity applied at different phases of the respiratory cycle. In each diagram, the upper traces show extracellular recordings from the pre-BötC (pBC) inspiratory activity, the middle traces show integrated pre-BötC activity (∫pBC), and the bottom traces show the laser stimulus application with the laser intensity given below the stimulus. The timing of the photostimulation is indicated in all three traces by blue shading and dashed red lines. (A) Low-intensity (1.0 mW) photostimulation (300 ms) applied during the inspiratory phase did not perturb the ongoing respiratory rhythm. (B) Same low-intensity laser stimulation (as in A) but with longer duration (1 s) to outlast the inspiratory phase did not terminate inspiration, but caused rebound excitation after ending the stimulus which led to an advanced onset of the next inspiratory phase. (C) Low-intensity (1.0 mW) photostimulation (300 ms) applied during the expiratory phase caused rebound excitation after the end of the stimulus leading to an advanced onset of the next inspiratory phase. (D) When the 300 ms, 1.0 mW laser pulse was applied at the end of the expiratory phase, inspiration was delayed for the duration of the stimulus and after the light stimulation was turned off. (E) High-intensity (2.0 mW) photostimulation (300 ms) applied during the inspiratory phase terminated inspiration and elicited delayed rebound excitation of inspiration after the stimulus ended. (F) The same 2.0 mW stimulation applied during the expiratory phase caused rebound excitation after the end of the stimulus leading to an advanced onset of the next inspiratory phase, similar to the examples shown in panels B, C and E. (G) Population data (n = 9, mean ± SEM, ***p ≤ 0.001) showing that the 2.0 mW stimulations reliably terminated inspiration while 1.0 mW stimulations did not. The open circles indicate the average number of terminated inspiratory bursts normalized to the total number of bursts for each animal. (H) The latency between the end of the light stimulus and the onset of the next inspiration was independent of photostimulation intensity (n = 6, mean ± SEM).
Fig 5
Fig 5. Effects of site-specific sustained photostimulation of inhibitory neurons within the pre-Bötzinger complex in situ.
(A-C) Examples of the effects of sustained stimulation (473 nm, 20 Hz, 20 ms pulses) of low (2.0 mW laser power in A) and higher intensity (4.0 mW in B and 5.0 mW in C). Representative traces of integrated phrenic nerve recordings (∫PN) are shown in the middle; the upper traces show the instantaneous inspiratory frequency (dots) and its low pass filtered time course (time-based moving median in a 3 s window, solid black line, the lower traces indicate the duration and amplitude of the sustained laser stimulation epoch. (D) Summary data (n = 10, mean ± SEM, **p<0.01, *p<0.05) of bilateral pre-BötC photostimulation shows that relatively weak (0.5–2.0 mW) stimulation significantly increased respiratory frequency in a laser power-dependent manner, and stronger (4.0–5.0 mW) stimulation caused a decrease of inspiratory frequency with complete termination of inspiratory activity for the stimulus duration at the maximum laser power (5.0 mW).
Fig 6
Fig 6. Perturbations of the inspiratory rhythm by bilateral photostimulation of VGAT-expressing inhibitory neurons within the Bötzinger complex in situ.
(A-D) Representative traces of phrenic nerve (PN) inspiratory activity show the response to short light pulses activating ChR2 in BötC inhibitory neurons. The upper traces show raw PN recordings, the middle traces show integrated phrenic activity (∫PN), and the bottom traces show the laser stimulus application with the laser intensity given below the stimulus. The timing of the laser stimulation is indicated with blue shading and dashed red lines. (A) Short (200 ms) low-intensity (1.0 mW) photostimulation pulse applied during the inspiratory phase terminated inspiration and elicited rebound excitation of inspiratory activity after the end of stimulation. (B) The same stimulation during the expiratory phase also caused rebound excitation of the next inspiratory phase after the end of the stimulus. (C and D) Long (5s) duration single photostimulation epochs inhibited the respiratory rhythm for the duration of light application and elicited rebound excitation of inspiratory activity similar to the short stimuli in panels A and B. (E) Population data (n = 5, mean ± SEM) shows that the latency between the end of the light stimulus and the onset of the next inspiration was independent of the stimulus duration. Short stim. = 200 ms; Long stim. = 5 s.
Fig 7
Fig 7. Effects of site-specific sustained photostimulation of inhibitory neurons within the Bötzinger complex in situ.
(A and B) Examples of the effects of sustained stimulation (473 nm, 20 Hz, 20 ms pulses) of low (2.0 mW pulse amplitude in A) and higher intensity (3.0 mW in B). Representative traces of integrated phrenic nerve recordings (∫PN) are shown in the middle; the upper traces show the instantaneous respiratory frequency (dots) and its low pass filtered time course (time-based moving median in a 3 s window, solid black line), the lower traces indicate the duration and amplitude of the pulsed sustained laser stimulation. (C). Summary data (n = 12, mean ± SEM, ** p<0.01) show that bilateral BötC laser application significantly reduced respiratory frequency in a laser power-dependent manner with a complete cessation of the inspiratory rhythm at 3.0 mW.
Fig 8
Fig 8. Photostimulation in the BötC region causes excitation of BötC post-I and aug-E neuron activity and inhibition of inspiratory neuron activity in the pre-BötC in situ.
(A) Extracellular recordings from post-I type expiratory neurons in the BötC showing example of tonic excitation of neuron activity during laser application to the BötC (2 mW) along with complete inhibition of inspiratory phrenic nerve activity (PN) in the arterially-perfused in situ brainstem-spinal cord preparation from adult VGAT-ChR2 transgenic mice. (B) Extracellular recordings from aug-E type expiratory neurons in the BötC also showing excitation of neuron activity during laser illumination (2 mW) of the BötC region, which reduced the frequency of inspiratory activity in this example. (C) Extracellular recordings from inspiratory (pre-I/I) neuron activity in the pre-BötC illustrating inhibition of PN inspiratory activity by 2 mW laser illumination in the BötC region. Black dashed lines indicate the end of inspiratory phase activity of PN in A, but indicate the onset of inspiratory phase activity of PN in B and C. The lower traces indicate the duration and amplitude of the laser stimulation.
Fig 9
Fig 9. Schematic of neural interactions within the pre-BötC-BötC core network and model performance.
(A) Schematic of the pre-BötC-BötC respiratory network from the model of Rubin et al. [10]. (B) Model schematic of the proposed extended model that includes the novel post-IpBC population within the pre-BötC. (C) Model performance under normal conditions (without stimulations). The traces represent output activity of each population in the network.
Fig 10
Fig 10. Model performance in comparison to experimental data: Responses to short stimuli activating inhibitory neurons within the pre-BötC.
(A-F) The upper two traces illustrate the effects of photostimulations in our experiments from the examples shown in Fig 4. The lower five traces show simulated activity of all neuron populations in the model. The applied stimulations are shown at the bottom. The timing of the laser stimulus is indicated with blue shading and dashed red lines. The model reproduces the behavior of the neurobiological system under all experimental situations shown above. The description of the different perturbations is the same as in the corresponding panels of Fig 4.
Fig 11
Fig 11. Model performance compared to experimental data: responses to sustained stimulations of inhibitory neurons within the pre-BötC.
(A-C) Model responses to sustained stimulation of inhibitory neurons within the pre-BötC with low-intensity (A; stimChR = 0.3) and higher intensity (B, stimChR = 1.6, and C, stimChR = 2) stimulation. The timing of the stimulus is indicated with blue shading and dashed red lines. Output activity of all neuron populations in the model are shown; the oscillation frequency increases in A, decreases in B, and oscillations are completely suppressed in C, similarly to our experimental studies (Fig 5) (D) Biphasic change in oscillation frequency in the model depending on the stimulation intensity.
Fig 12
Fig 12. Model performance vs. experimental data for responses to short stimuli activating inhibitory neurons within the BötC.
(A-D) The upper two traces illustrate the effects of photostimulations in our experiments from the examples shown in Fig 6. The lower five traces show the simulated activity of all neuron populations in the model. The applied stimulations are shown at the bottom. The timing of the laser stimulus is indicated with blue shading and dashed red lines. The model reproduces the behavior of the biological system under all experimental situations shown above. Description of the different perturbations is the same as in the corresponding panels of Fig 6.
Fig 13
Fig 13. Model performance vs. experimental data for responses to sustained stimulations of inhibitory neurons within the BötC.
(A and B) Model responses to sustained stimulation of inhibitory neurons within the pre-BötC with low-intensity (A; stimChR = 0.14) and higher intensity (B, stimChR = 0.18) stimulation. The timing of the stimulus is indicated with blue shading and dashed red lines. Output activity of all neuron populations in the model are shown. The oscillation frequency decreases maximally in A, and is fully suppressed in B, similar to our experimental results (Fig 7) (C). Increases of stimulation intensity reduced oscillation frequency and terminated inspiratory activity at the highest intensities examined, directionally similar to the experimental results shown in Fig 7C.
Fig 14
Fig 14. Model-data comparisons for responses to stimulations of inhibitory and excitatory pre-BötC populations.
(A) Integrated recording of diaphragmatic EMG (ʃDIAEMG) activity and laser activation illustrating that continuous ChR2 photostimulation of excitatory and inhibitory pre-BötC together induces an increase in respiratory frequency (data from the study of Alsahafi et al. [47], Fig 2B, used with authors’ permission). The lower five traces show the activity of all neuron populations in the model. The applied photostimulations are shown at the bottom (stimChR = 0.18). The timing of the laser stimulus is indicated with blue shading and dashed red lines. Stimulating all populations in the model elicited a frequency increase similar to the experimental data. (B) Recording of ʃDIAEMG and laser frequency during 1 Hz photostimulation showing entrainment of the respiratory rhythm to the periodic stimulation (data from the study of Alsahafi et al. [47], Fig 6B, used with authors’ permission). The lower five traces show the activity of all neuron populations in the model. The applied stimulations are shown at the bottom (stimChR = 0.2), and the timing of the laser stimulus is indicated with blue shading and dashed red lines. Stimulating all pre-BötC populations in the model can entrain the network activity at the experimental photostimulation frequency of 0.67Hz.
Fig 15
Fig 15. Data-model comparisons of respiratory phase dependent photostimulation of pre-BötC neurons.
(A) Five respiratory airflow traces illustrating the response to stimulation of pre-BötC neurons at different respiratory phases. The orange trace indicates a lack of response to photostimulation when it occurs during the post-inspiratory phase (refractory period). The green trace shows a slight prolongation of inspiration (green arrow) when the stimulus is delivered during the inspiratory phase and the black traces show initiation of inspiration during the stimulus after a short latency (based on data from the study of Alsahafi et al. [47], Fig 7B, used with authors’ permission). (B) The model output traces of pre-I/I and post-I activities show a similar behavior to the experimental data when all pre-BötC populations are stimulated with a 300 ms simulated light pulse. The applied stimulations are shown at the bottom (stimChR = 0.2). The timing of the laser stimulus is indicated with blue shading and dashed red lines.
Fig 16
Fig 16. Experimental setup for site-specific optogenetic stimulation of inhibitory neurons within the pre-BötC or BötC.
(A) Dorsal view of the in situ arterially perfused transgenic mouse brainstem-spinal cord preparation. (B) Representative examples of extracellular recordings of pre-I/I population activity in the pre-BötC and inspiratory activity recorded from the phrenic nerve. Each panel shows raw (lower trace) and integrated (upper trace) pre-BötC and PN nerve inspiratory discharge. Abbreviations: V4, 4th ventricle; IC, inferior colliculus; pre-BötC, pre-Bötzinger complex; BötC, Bötzinger complex; rVRG, rostral ventrolateral respiratory group.

References

    1. Richter DW. Neural regulation of respiration: rhythmogenesis and afferent control Comprehensive Human Physiology. Springer, Berlin, Heidelberg; 1996. pp. 2079–2095. doi: 10.1007/978-3-642-60946-6_106 - DOI
    1. Richter DW, Smith JC. Respiratory rhythm generation in vivo. Physiol Bethesda. 2014;29: 58–71. doi: 10.1152/physiol.00035.2013 - DOI - PMC - PubMed
    1. Rybak IA, Shevtsova NA, Paton JFR, Dick TE, St.-John WM, Mörschel M, et al. Modeling the ponto-medullary respiratory network. Respir Physiol Neurobiol. 2004;143: 307–319. doi: 10.1016/j.resp.2004.03.020 - DOI - PubMed
    1. Rybak IA, Abdala APL, Markin SN, Paton JFR, Smith JC. Spatial organization and state-dependent mechanisms for respiratory rhythm and pattern generation. Prog Brain Res. 2007;165: 201–220. doi: 10.1016/S0079-6123(06)65013-9 - DOI - PMC - PubMed
    1. Rybak IA, O’Connor R, Ross A, Shevtsova NA, Nuding SC, Segers LS, et al. Reconfiguration of the pontomedullary respiratory network: a computational modeling study with coordinated in vivo experiments. J Neurophysiol. 2008;100: 1770–1799. doi: 10.1152/jn.90416.2008 - DOI - PMC - PubMed

Publication types

MeSH terms

Substances

LinkOut - more resources