

Medroxyprogesterone acetate, unlike norethisterone, increases HIV-1 replication in human peripheral blood mononuclear cells and an indicator cell line, via mechanisms involving the glucocorticoid receptor, increased CD4/CD8 ratios and CCR5 levels
- PMID: 29698514
- PMCID: PMC5919616
- DOI: 10.1371/journal.pone.0196043
Medroxyprogesterone acetate, unlike norethisterone, increases HIV-1 replication in human peripheral blood mononuclear cells and an indicator cell line, via mechanisms involving the glucocorticoid receptor, increased CD4/CD8 ratios and CCR5 levels
Abstract
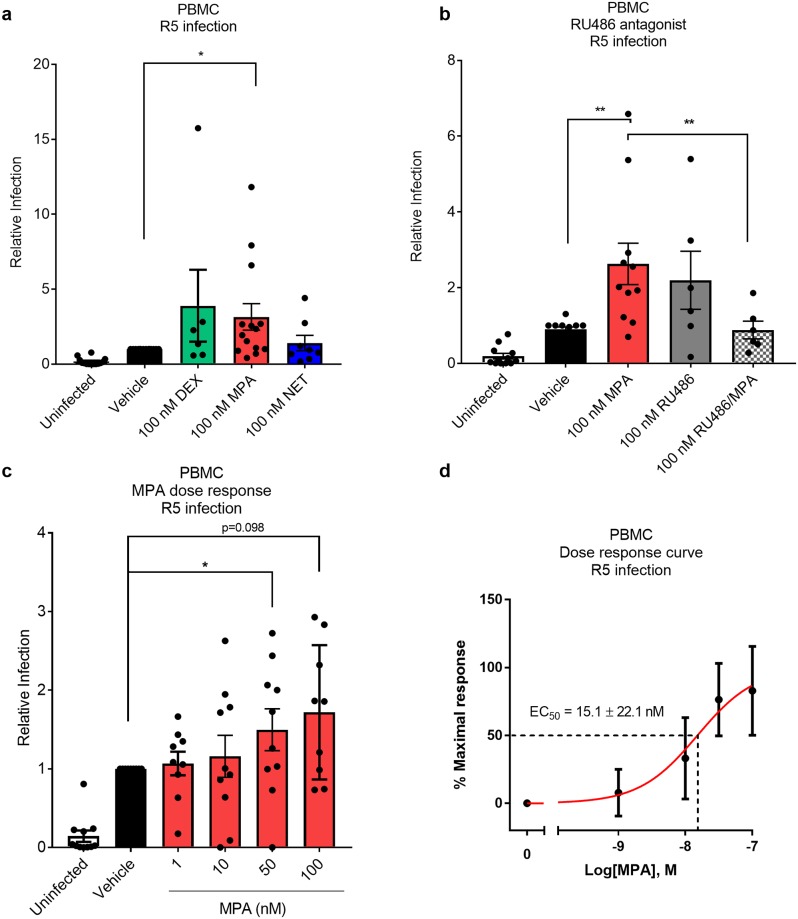
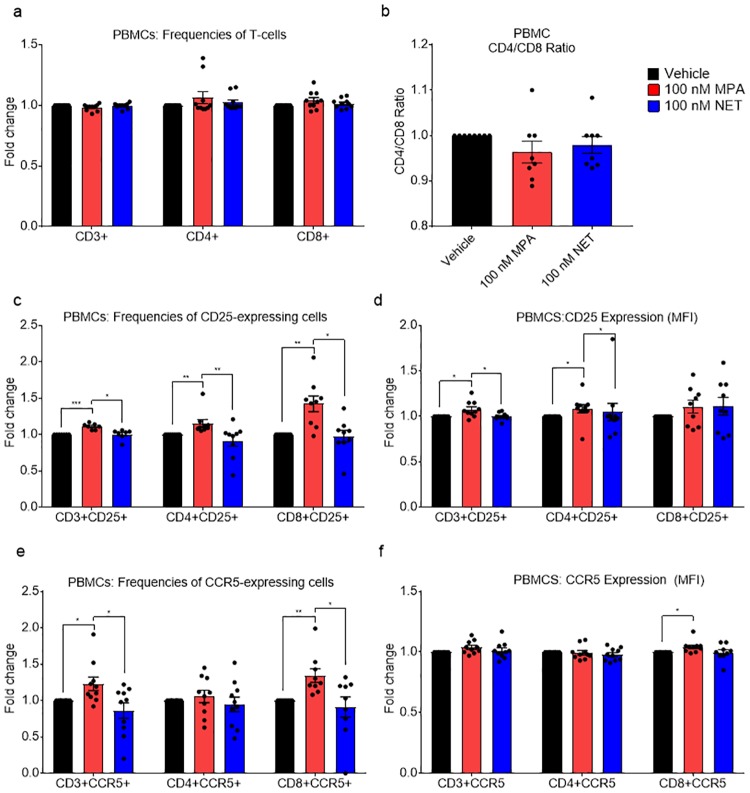
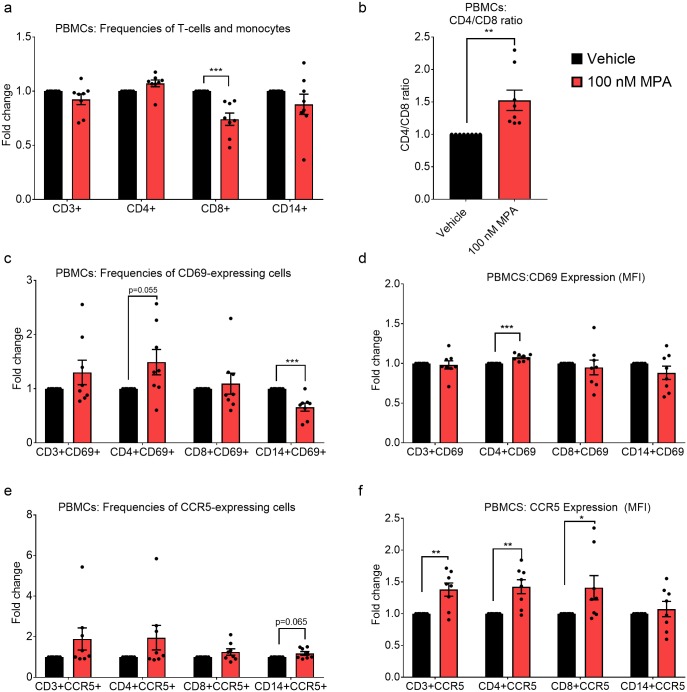
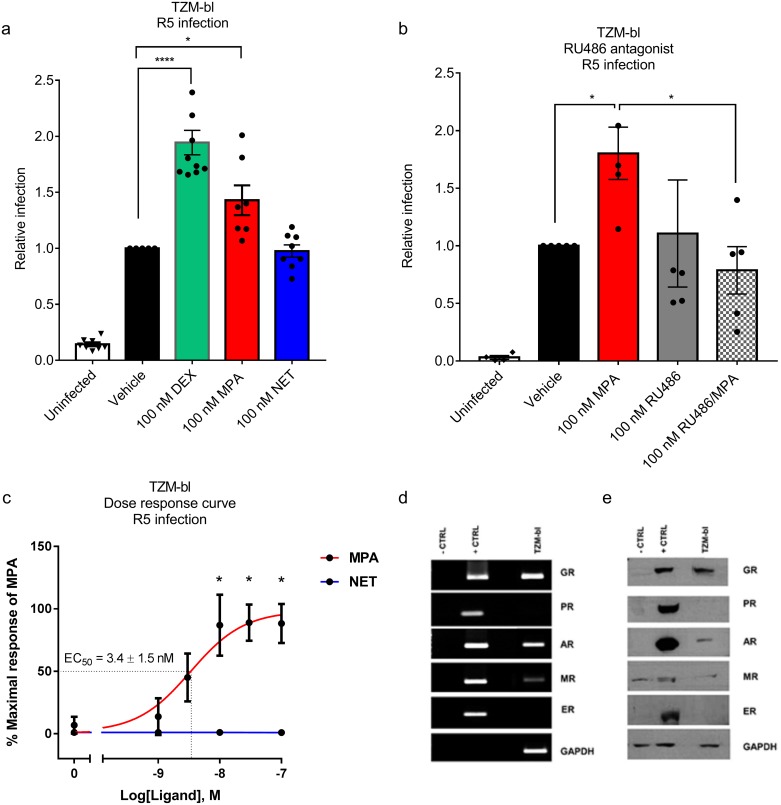
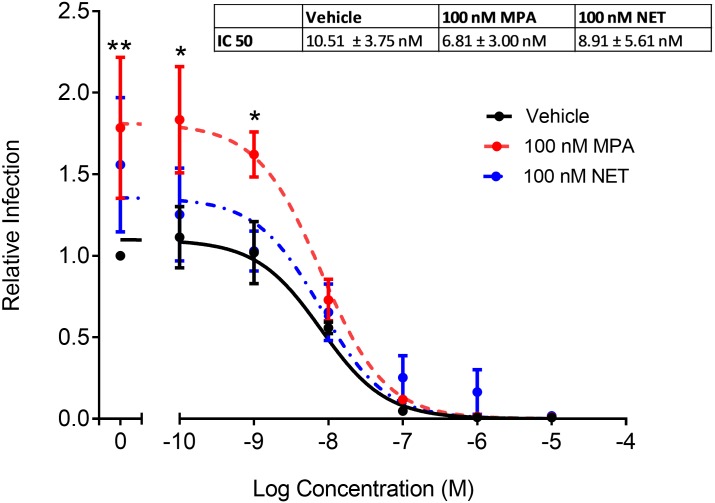
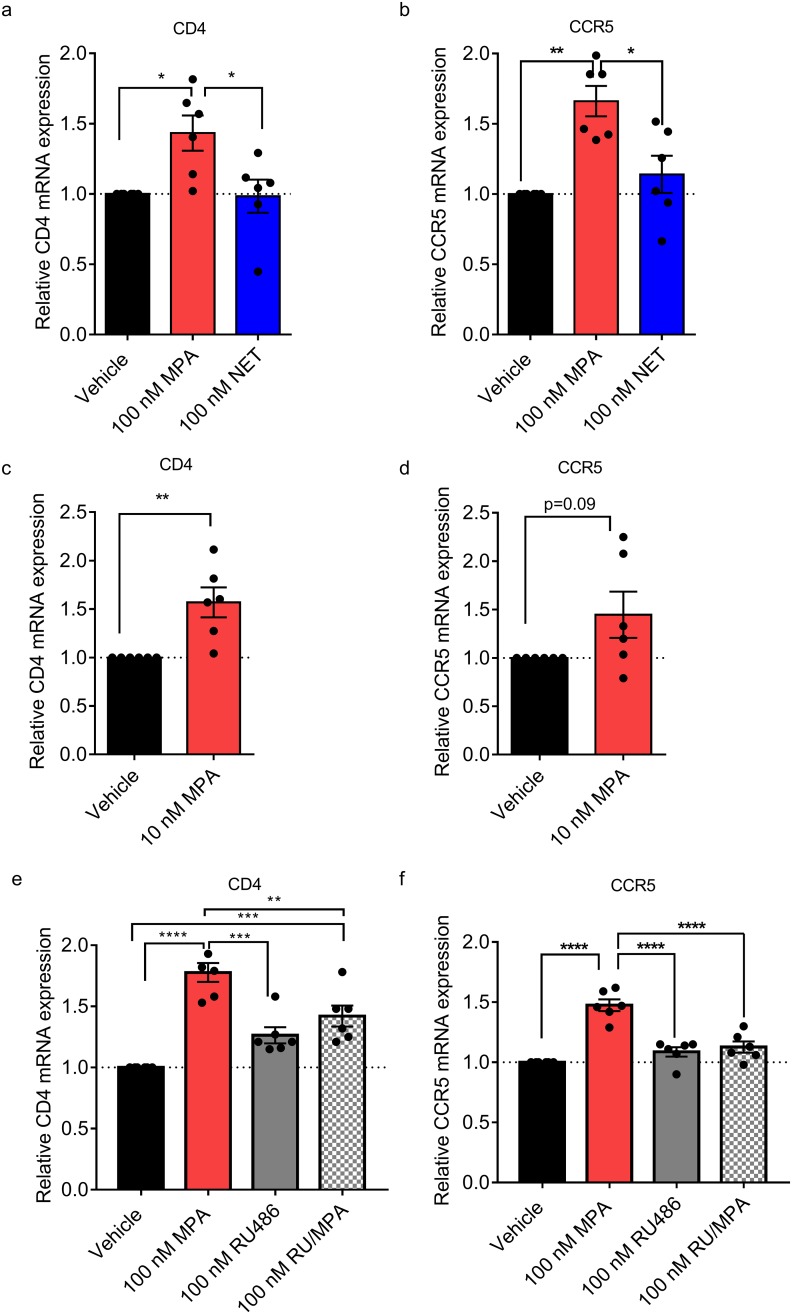
High usage of progestin-only injectable contraceptives, which include the intramuscular injectables depo-medroxyprogesterone acetate (DMPA-IM, Depo-Provera) and norethisterone (NET) enanthate (NET-EN or Nur-Isterate), correlates worldwide with areas of high HIV-1 prevalence. Epidemiological data show a significant association between usage of DMPA-IM and increased HIV-1 acquisition but no such association from limited data for NET-EN. Whether MPA and NET have similar effects on HIV-1 acquisition and pathogenesis, and the relationship between these effects and the dose of MPA, are critical issues for women's health and access to suitable and safe contraceptives. We show for the first time that MPA, unlike NET, significantly increases HIV-1 replication in peripheral blood mononuclear cells (PBMCs) and a cervical cell line model. The results provide novel evidence for a biological mechanism whereby MPA, acting via the glucocorticoid receptor (GR), increases HIV-1 replication by at least in part increasing expression of the CCR5 HIV-1 coreceptor on target T-lymphocytes. MPA, unlike NET, also increases activation of T-cells and increases the CD4/CD8 ratio, suggesting that multiple mechanisms are involved in the MPA response. Our data offer strong support for different biological mechanisms for MPA versus NET, due to their differential GR activity. The dose-dependence of the MPA response suggests that significant effects are observed within the range of peak serum levels of progestins in DMPA-IM but not NET-EN users. Dose-response results further suggest that effects of contraceptives containing MPA on HIV-1 acquisition and disease progression may be critically dependent on dose, time after injection and intrinsic factors that affect serum concentrations in women.
Conflict of interest statement
Figures

Similar articles
-
The contraceptive medroxyprogesterone acetate, unlike norethisterone, directly increases R5 HIV-1 infection in human cervical explant tissue at physiologically relevant concentrations.Sci Rep. 2019 Mar 13;9(1):4334. doi: 10.1038/s41598-019-40756-7. Sci Rep. 2019. PMID: 30867477 Free PMC article.
-
The progestin-only contraceptive medroxyprogesterone acetate, but not norethisterone acetate, enhances HIV-1 Vpr-mediated apoptosis in human CD4+ T cells through the glucocorticoid receptor.PLoS One. 2013 May 3;8(5):e62895. doi: 10.1371/journal.pone.0062895. Print 2013. PLoS One. 2013. PMID: 23658782 Free PMC article.
-
Increased HIV-1 infection in PBMCs treated in vitro with menstrual cycle phase hormones or medroxyprogesterone acetate likely occurs via different mechanisms.Am J Reprod Immunol. 2022 Dec;88(6):e13643. doi: 10.1111/aji.13643. Epub 2022 Nov 2. Am J Reprod Immunol. 2022. PMID: 36302121 Free PMC article.
-
Differential glucocorticoid receptor-mediated effects on immunomodulatory gene expression by progestin contraceptives: implications for HIV-1 pathogenesis.Am J Reprod Immunol. 2014 Jun;71(6):505-12. doi: 10.1111/aji.12214. Epub 2014 Feb 18. Am J Reprod Immunol. 2014. PMID: 24547700 Review.
-
Hormonal contraceptive use and women's risk of HIV acquisition: priorities emerging from recent data.Curr Opin Obstet Gynecol. 2015 Dec;27(6):487-95. doi: 10.1097/GCO.0000000000000228. Curr Opin Obstet Gynecol. 2015. PMID: 26536211 Review.
Cited by
-
Glucocorticoids and medroxyprogesterone acetate synergize with inflammatory stimuli to selectively upregulate CCL20 transcription.Mol Cell Endocrinol. 2023 Mar 1;563:111855. doi: 10.1016/j.mce.2023.111855. Epub 2023 Jan 13. Mol Cell Endocrinol. 2023. PMID: 36646303 Free PMC article.
-
The contraceptive medroxyprogesterone acetate, unlike norethisterone, directly increases R5 HIV-1 infection in human cervical explant tissue at physiologically relevant concentrations.Sci Rep. 2019 Mar 13;9(1):4334. doi: 10.1038/s41598-019-40756-7. Sci Rep. 2019. PMID: 30867477 Free PMC article.
-
Injectable Contraceptives Differentially Affect Select CD4+ HIV-1 Target Cells in the Genital Tract but Not Systemically: Implications for HIV-1 Acquisition.Am J Reprod Immunol. 2025 May;93(5):e70093. doi: 10.1111/aji.70093. Am J Reprod Immunol. 2025. PMID: 40349359 Free PMC article. Clinical Trial.
-
HIV-1 Tat promotes age-related cognitive, anxiety-like, and antinociceptive impairments in female mice that are moderated by aging and endocrine status.Geroscience. 2021 Feb;43(1):309-327. doi: 10.1007/s11357-020-00268-z. Epub 2020 Sep 17. Geroscience. 2021. PMID: 32940828 Free PMC article.
-
HIV risk associated with serum medroxyprogesterone acetate levels among women in East and southern Africa.AIDS. 2019 Mar 15;33(4):735-744. doi: 10.1097/QAD.0000000000002123. AIDS. 2019. PMID: 30585845 Free PMC article.
References
-
- Polis CB, Curtis KM, Hannaford PC, Phillips SJ, Chipato T, Kiarie JN, et al. An updated systematic review of epidemiological evidence on hormonal contraceptive methods and HIV acquisition in women. AIDS. 2016;30(17):2665–83. doi: 10.1097/QAD.0000000000001228 - DOI - PMC - PubMed
-
- Morrison CS, Chen PL, Kwok C, Baeten JM, Brown J, Crook AM, et al. Hormonal contraception and the risk of HIV acquisition: an individual participant data meta-analysis. PLoS Med. 2015;12(1):e1001778 doi: 10.1371/journal.pmed.1001778 - DOI - PMC - PubMed
-
- Ralph LJ, Gollub EL, Jones HE. Hormonal contraceptive use and women’s risk of HIV acquisition: priorities emerging from recent data. Curr Opin Obstet Gynecol. 2015;27(6):487–95. doi: 10.1097/GCO.0000000000000228 - DOI - PubMed
-
- Butler AR, Smith JA, Polis CB, Gregson S, Stanton D, Hallett TB. Modelling the global competing risks of a potential interaction between injectable hormonal contraception and HIV risk. AIDS. 2013;27(1):105–13. doi: 10.1097/QAD.0b013e32835a5a52 - DOI - PMC - PubMed
-
- ECHO. The Evidence for Contraceptive Options and HIV Outcomes (ECHO) Study 2016. http://echo-consortium.com/.
Publication types
MeSH terms
Substances
Grants and funding
LinkOut - more resources
Full Text Sources
Other Literature Sources
Research Materials
