N-glycan signatures identified in tumor interstitial fluid and serum of breast cancer patients: association with tumor biology and clinical outcome
- PMID: 29698574
- PMCID: PMC5983225
- DOI: 10.1002/1878-0261.12312
N-glycan signatures identified in tumor interstitial fluid and serum of breast cancer patients: association with tumor biology and clinical outcome
Abstract
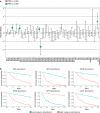
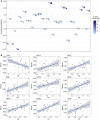
Particular N-glycan structures are known to be associated with breast malignancies by coordinating various regulatory events within the tumor and corresponding microenvironment, thus implying that N-glycan patterns may be used for cancer stratification and as predictive or prognostic biomarkers. However, the association between N-glycans secreted by breast tumor and corresponding clinical relevance remain to be elucidated. We profiled N-glycans by HILIC UPLC across a discovery dataset composed of tumor interstitial fluids (TIF, n = 85), paired normal interstitial fluids (NIF, n = 54) and serum samples (n = 28) followed by independent evaluation, with the ultimate goal of identifying tumor-related N-glycan patterns in blood of patients with breast cancer. The segregation of N-linked oligosaccharides revealed 33 compositions, which exhibited differential abundances between TIF and NIF. TIFs were depleted of bisecting N-glycans, which are known to play essential roles in tumor suppression. An increased level of simple high mannose N-glycans in TIF strongly correlated with the presence of tumor infiltrating lymphocytes within tumor. At the same time, a low level of highly complex N-glycans in TIF inversely correlated with the presence of infiltrating lymphocytes within tumor. Survival analysis showed that patients exhibiting increased TIF abundance of GP24 had better outcomes, whereas low levels of GP10, GP23, GP38, and coreF were associated with poor prognosis. Levels of GP1, GP8, GP9, GP14, GP23, GP28, GP37, GP38, and coreF were significantly correlated between TIF and paired serum samples. Cross-validation analysis using an independent serum dataset supported the observed correlation between TIF and serum, for five of nine N-glycan groups: GP8, GP9, GP14, GP23, and coreF. Collectively, our results imply that profiling of N-glycans from proximal breast tumor fluids is a promising strategy for determining tumor-derived glyco-signature(s) in the blood. N-glycans structures validated in our study may serve as novel biomarkers to improve the diagnostic and prognostic stratification of patients with breast cancer.
Keywords: N-glycan; biomarker; blood; heterogeneity; tumor infiltrating lymphocytes; tumor microenvironment.
© 2018 The Authors. Published by FEBS Press and John Wiley & Sons Ltd.
Figures


Similar articles
-
Profiling of microRNAs in tumor interstitial fluid of breast tumors - a novel resource to identify biomarkers for prognostic classification and detection of cancer.Mol Oncol. 2017 Feb;11(2):220-234. doi: 10.1002/1878-0261.12025. Epub 2016 Dec 12. Mol Oncol. 2017. PMID: 28145100 Free PMC article. Clinical Trial.
-
Serum N-glycan analysis in breast cancer patients--Relation to tumour biology and clinical outcome.Mol Oncol. 2016 Jan;10(1):59-72. doi: 10.1016/j.molonc.2015.08.002. Epub 2015 Aug 19. Mol Oncol. 2016. PMID: 26321095 Free PMC article.
-
Exploring serum and immunoglobulin G N-glycome as diagnostic biomarkers for early detection of breast cancer in Ethiopian women.BMC Cancer. 2019 Jun 17;19(1):588. doi: 10.1186/s12885-019-5817-8. BMC Cancer. 2019. PMID: 31208374 Free PMC article.
-
Systematic Review: Immunoglobulin G N-Glycans as Next-Generation Diagnostic Biomarkers for Common Chronic Diseases.OMICS. 2019 Dec;23(12):607-614. doi: 10.1089/omi.2019.0032. Epub 2019 Aug 16. OMICS. 2019. PMID: 31414971
-
The cancer secretome, current status and opportunities in the lung, breast and colorectal cancer context.Biochim Biophys Acta. 2013 Nov;1834(11):2242-58. doi: 10.1016/j.bbapap.2013.01.029. Epub 2013 Jan 31. Biochim Biophys Acta. 2013. PMID: 23376433 Review.
Cited by
-
Bioinformatic analysis of the expression and prognosis of ZNF589 in human breast cancer.Transl Cancer Res. 2021 May;10(5):2286-2304. doi: 10.21037/tcr-20-3166. Transl Cancer Res. 2021. PMID: 35116546 Free PMC article.
-
Influence of Desialylation on the Drug Binding Affinity of Human Alpha-1-Acid Glycoprotein Assessed by Microscale Thermophoresis.Pharmaceutics. 2024 Feb 5;16(2):230. doi: 10.3390/pharmaceutics16020230. Pharmaceutics. 2024. PMID: 38399284 Free PMC article.
-
Clinical application of quantitative glycomics.Expert Rev Proteomics. 2018 Dec;15(12):1007-1031. doi: 10.1080/14789450.2018.1543594. Epub 2018 Nov 14. Expert Rev Proteomics. 2018. PMID: 30380947 Free PMC article. Review.
-
High-throughput proteomics of breast cancer interstitial fluid: identification of tumor subtype-specific serologically relevant biomarkers.Mol Oncol. 2021 Feb;15(2):429-461. doi: 10.1002/1878-0261.12850. Epub 2021 Jan 4. Mol Oncol. 2021. PMID: 33176066 Free PMC article. Clinical Trial.
-
Computational gene expression analysis reveals distinct molecular subgroups of T-cell prolymphocytic leukemia.PLoS One. 2022 Sep 21;17(9):e0274463. doi: 10.1371/journal.pone.0274463. eCollection 2022. PLoS One. 2022. PMID: 36129940 Free PMC article.
References
-
- Ahn SM and Simpson RJ (2007) Body fluid proteomics: Prospects for biomarker discovery. Proteomics Clin Appl 1, 1004–1015. - PubMed
-
- Beck AH, Sangoi AR, Leung S, Marinelli RJ, Nielsen TO, devan Vijver MJ , West RB, devan Rijn M , Koller D (2011) Systematic analysis of breast cancer morphology uncovers stromal features associated with survival. Sci Transl Med 3, 108ra113. - PubMed
-
- Bedognetti D, Hendrickx W, Ceccarelli M, Miller LD and Seliger B (2016) Disentangling the relationship between tumor genetic programs and immune responsiveness. Curr Opin Immunol 39, 150–158. - PubMed
-
- Bradford MM (1976) A rapid and sensitive method for the quantitation of microgram quantities of protein utilizing the principle of protein‐dye binding. Anal Biochem 72, 248–254. - PubMed
Publication types
MeSH terms
Substances
LinkOut - more resources
Full Text Sources
Other Literature Sources
Medical

