. 2018 Jun 21;131(25):2803-2815.
doi: 10.1182/blood-2017-09-808816. Epub 2018 Apr 26.

TRAIL mediates and sustains constitutive NF-κB activation in LGL leukemia

Affiliations

TRAIL mediates and sustains constitutive NF-κB activation in LGL leukemia

Jun Yang et al. Blood. .

Abstract

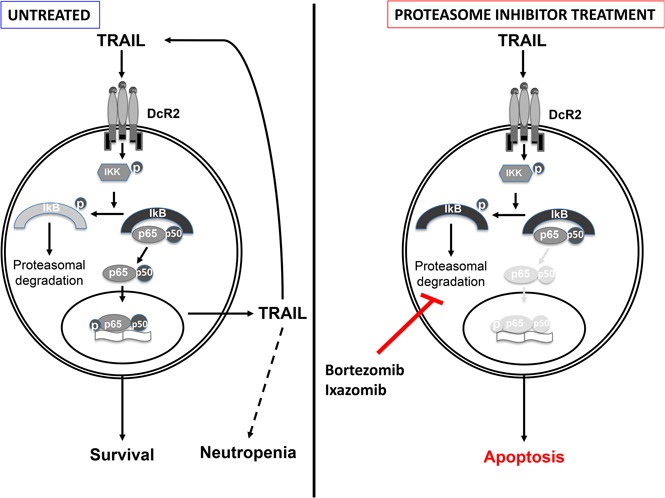
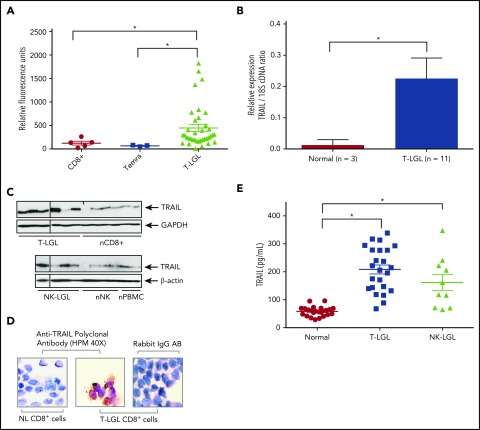
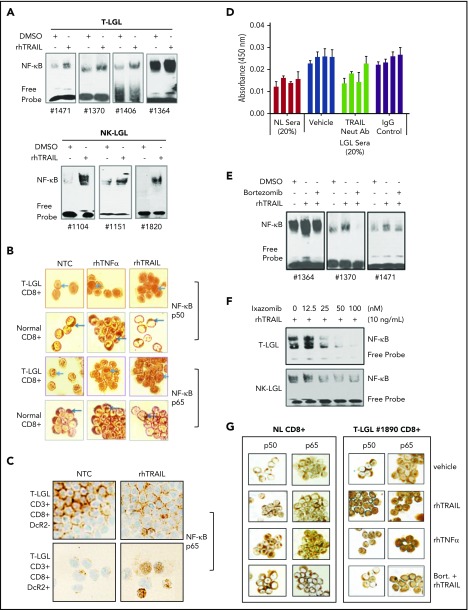
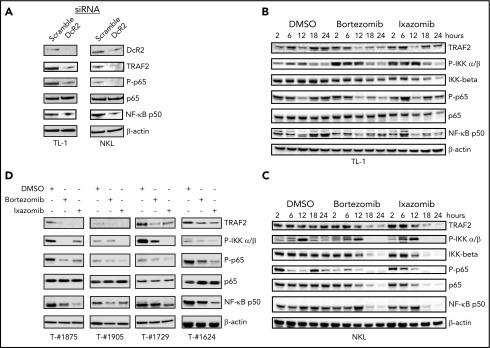
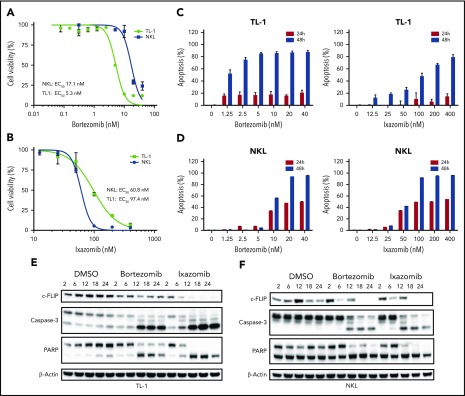
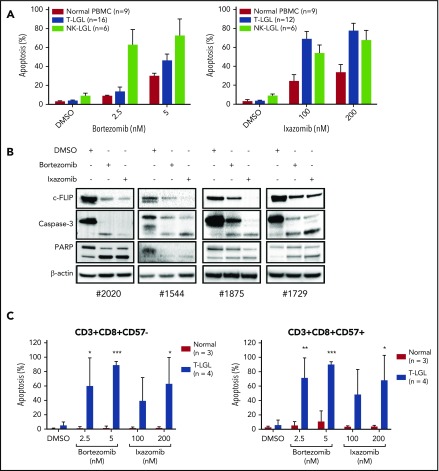
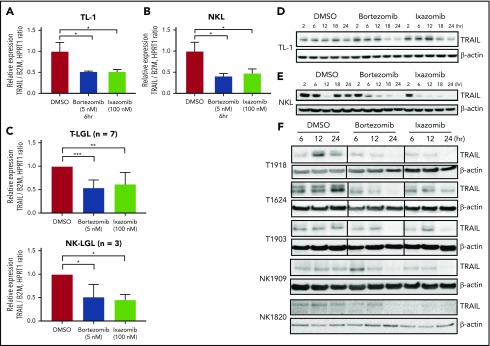
Large granular lymphocyte (LGL) leukemia results from clonal expansion of CD3+ cytotoxic T lymphocytes or CD3- natural killer (NK) cells. Chronic antigen stimulation is postulated to promote long-term survival of LGL leukemia cells through constitutive activation of multiple survival pathways, resulting in global dysregulation of apoptosis and resistance to activation-induced cell death. We reported previously that nuclear factor κB (NF-κB) is a central regulator of the survival network for leukemic LGL. However, the mechanisms that trigger constitutive activation of NF-κB in LGL leukemia remain undefined. Tumor necrosis factor-related apoptosis-inducing ligand (TRAIL) is known to induce apoptosis in tumor cells but can also activate NF-κB through interaction with TRAIL receptors 1, 2, and 4 (also known as DR4, DR5, and DcR2, respectively). The role of TRAIL has not been studied in LGL leukemia. In this study, we hypothesized that TRAIL interaction with DcR2 contributes to NF-κB activation in LGL leukemia. We observed upregulated TRAIL messenger RNA and protein expression in LGL leukemia cells with elevated levels of soluble TRAIL protein in LGL leukemia patient sera. We also found that DcR2 is the predominant TRAIL receptor in LGL leukemia cells. We demonstrated that TRAIL-induced activation of DcR2 led to increased NF-κB activation in leukemic LGL. Conversely, interruption of TRAIL-DcR2 signaling led to decreased NF-κB activation. Finally, a potential therapeutic application of proteasome inhibitors (bortezomib and ixazomib), which are known to inhibit NF-κB, was identified through their ability to decrease proliferation and increase apoptosis in LGL leukemia cell lines and primary patient cells.


Conflict of interest statement

Conflict-of-interest disclosure: The authors declare no competing financial interests.

Figures

None
Graphical abstract
Figure 1.
Figure 1.
TRAIL is overexpressed in LGL leukemia. (A) TRAIL gene expression levels in PBMC from T-LGL patients (triangles; n = 37), CD8+ cells from normal subjects (circles, n = 5), and Temra cells from normal subjects (squares, n = 3) in the GSE42664 Affymetrix data set. (B) Quantitative real-time PCR was performed to measure levels of TRAIL mRNA in CD8+ cells from T-LGL patients (n = 11) or purified CD8+ from normal donors (n = 3). Relative TRAIL mRNA expression was normalized to 18S. Data are presented as mean ± SEM. *P < .05 indicates significant difference between LGL leukemia patients and normal donors (Student t test). (C) Immunoblot analysis of TRAIL protein in purified CD8+ cells from patients with T-LGL leukemia (n = 6) vs CD8+ cells from normal (n) donors (n = 6) and purified NK cells from patients with NK-LGL leukemia (n = 4) vs purified NK cells isolated from normal donors (n = 4) and PBMCs from normal donors (n = 2). Loading of protein was confirmed by probing for GAPDH or β-actin. Vertical lines within the leukemic groups indicate regions where samples were removed from the image based on poor protein extract quality as indicated by loading controls. (D) CD8+ cells from a T-LGL patient or normal (NL) donor were stained with TRAIL antibodies and visualized using light microscopy (original magnification ×400). Rabbit IgG antibody was used as a negative control. Data are representative of 3 experiments conducted with cells from 3 independent patients. (E) Serum levels of TRAIL were determined using an ELISA assay. Sera were tested from T-LGL leukemia patients (squares, n = 24; ANOVA, *P < .0001 T-LGL vs normal donor), NK-LGL leukemia patients (triangles, n = 10; ANOVA, *P < .0001, NK-LGL vs normal donor), or normal donors (circles, n = 24). cDNA, complementary DNA.
Figure 2.
Figure 2.
LGL leukemia cells are resistant to TRAIL-induced apoptosis and primarily express TRAIL receptor DcR2. (A) NKL, TL-1, and Jurkat cells were treated with either vehicle (normal saline) or rhTRAIL (10 ng/mL) for 48 hours. Cells were stained with Annexin-V and 7-AAD and analyzed by flow cytometry to identify apoptotic cells. Data are presented as mean ± SEM and representative of 3 separate experiments (ANOVA, *P < .0001 Jurkat cells vs TL-1 and NKL). (B) PBMCs isolated from normal donors (n = 4), NK-LGL patients (n = 4), and T-LGL patients (n = 9) were treated with either vehicle (normal saline) or rhTRAIL (10 ng/mL) for 48 hours. Cells were stained with Annexin-V and 7-AAD and analyzed by flow cytometry to identify apoptotic cells. Data represent mean ± SEM. (C) PBMCs from normal donors or LGL leukemia patients were assessed for their cell surface expression of TRAIL receptors using flow cytometry. Percentage of LGL cells from pathology flow cytometry report is shown below the horizontal axis. (D) PBMCs from normal donors, without or with activation (Act), or LGL leukemia patients were assessed for their cell surface expression of DcR2 receptor using flow cytometry to stratify samples based on CD3, CD8, and CD57 expression.
Figure 3.
Figure 3.
TRAIL induces NF-κB activation and nuclear translocation in LGL leukemia cells that are blocked by proteasome inhibitors. (A) EMSA demonstrating NF-κB activity in nuclear extracts from T-LGL patient PBMCs (n = 4) and NK-LGL patient PBMCs (n = 3) treated with either saline or rhTRAIL (10 ng/mL) for 2 hours. (B) NF-κB p50 or p65 protein ICC staining as visualized by light microscopy in CD8+ cells from an LGL leukemia patient compared with CD8+ cells from a normal donor (original magnification ×1000). Cells were treated with control (NTC), TNF-α (positive control, 10 ng/mL), or rhTRAIL (10 ng/mL). Brown staining represents NF-κB p50 or p65 protein. Data are representative of 3 experiments conducted with cells from 3 independent patients. (C) NF-κB p65 protein ICC staining as visualized by light microscopy in CD3+/CD8+/DcR2 and CD3+/CD8+/DcR2+ cells from an LGL leukemia patient (original magnification ×400). Cells were treated with either vehicle control (NTC) or rhTRAIL (10 ng/mL). Brown staining represents NF-κB p65 protein. Data are representative of experiments conducted with cells from 2 independent patients. (D) NF-κB p50 ELISA of PBMC nuclear protein extracts from T-LGL leukemia patients (n = 4) that were treated with sera from normal donor or sera from LGL patients. Patient cells treated with LGL sera were cotreated with vehicle, TRAIL neutralizing antibody (Neut Ab), or IgG control antibody. (E) EMSA demonstrating NF-κB activity in nuclear extracts from T-LGL patient PBMCs (n = 3) treated with vehicle (DMSO), rhTRAIL (10 ng/mL), or TRAIL (10 ng/mL) plus bortezomib (5 nM). (F) EMSA demonstrating NF-κB activity in nuclear extracts from patient cells from a T-LGL or NK-LGL patient treated with rhTRAIL (10 ng/mL) or rhTRAIL (10 ng/mL) plus increasing doses of ixazomib (0-100 nM). (G) NF-κB p50 or p65 protein ICC staining as visualized by light microscopy in CD8+ cells from normal control or LGL leukemia (original magnification ×400). Cells were pretreated with either bortezomib (5 nM) or DMSO for 2 hours followed with the treatment of rhTRAIL (10 ng/mL) or rhTNF-α (10 ng/mL positive control). Brown staining represents NF-κB p50 or p65 protein. Data are representative of 3 experiments conducted with cells from 3 independent patients.
Figure 4.
Figure 4.
TRAIL DcR2 knockdown or proteasome inhibitor treatment inhibits NF-κB activation in LGL leukemia cells. (A) TL-1 and NKL cells were transfected with DcR2-specific siRNA (100 nM) or scramble siRNA by electroporation. Cells were kept in culture for 72 hours. The expression of DcR2, TRAF2, NF-κB p65, phosphorylated p65, and NF-κB p50 was determined by western blot immunoassay. (B-C) TL-1 cells (B) and NKL cells (C) were treated with bortezomib (5 nM), ixazomib (100 nM), or vehicle (dimethyl sulfoxide [DMSO]), and protein samples were harvested at different time points as indicated. The expression of TRAF2, phosphorylated IKK α/β, IKK β, NF-κB p65, phosphorylated p65, and NF-κB p50 was determined by western blot immunoassay. β-Actin was used as a control for equal loading. (D) PBMCs from T-LGL leukemia patients were treated with bortezomib (5 nM) or ixazomib (100 nM) for 24 hours. The expression of TRAF2, phosphorylated IKK α/β, NF-κB p65, phosphorylated p65, and NF-κB p50 was determined by western blot immunoassay. β-Actin antibody was used as a control for equal loading.
Figure 5.
Figure 5.
Proteasome inhibitors decrease viability and induce apoptosis in LGL leukemia cell lines through increased caspase-3 and PARP cleavage and downregulation of c-FLIP. (A) Bortezomib decreases viability in LGL leukemia cell lines. TL-1 and NKL cells were treated with bortezomib at varying concentrations for 48 hours, and cell viability was assessed using an MTS assay. (B) Ixazomib decreases viability in LGL leukemia cell lines. TL-1 and NKL cells were treated with ixazomib at varying concentrations for 48 hours, and cell viability was assessed using an MTS assay. (C) Proteasome inhibitors induce apoptosis in TL-1 cells. TL-1 cells were treated with bortezomib or ixazomib at varying concentrations for 24 or 48 hours, and cells were stained for apoptosis with Annexin-V and 7-AAD and analyzed by flow cytometry. (D) Proteasome inhibitors induce apoptosis in NKL cells. NKL cells were treated with bortezomib or ixazomib at varying concentrations for 24 or 48 hours, and cells were stained for apoptosis with Annexin-V and 7-AAD and analyzed by flow cytometry. (E) Proteasome inhibitors decrease expression of the NF-κB target c-FLIP and induce caspase-3 and PARP cleavage in TL-1 cells. TL-1 cells were treated with bortezomib (5 nM) or ixazomib (100 nM), and protein was harvested at various time points. Western blot analysis was performed for c-FLIP, caspase-3, and PARP. (F) NKL cells were treated with bortezomib (5 nM) or ixazomib (100 nM) and protein was harvested at various time points. Western blot analysis was performed for c-FLIP, caspase-3, and PARP expression. 50% effective concentration (EC50) values were determined by nonlinear regression in GraphPad Prism.
Figure 6.
Figure 6.
Proteasome inhibitors induce apoptosis in LGL leukemia samples. (A) PBMCs from normal donors (n = 9), T-LGL patients (n = 16), and NK-LGL patients (n = 6) were treated with DMSO or bortezomib (2.5 or 5 nM) for 48 hours, and cells were stained for apoptosis with Annexin-V and 7-AAD and analyzed by flow cytometry (left). PBMCs from normal donors (n = 9), T-LGL patients (n = 12), and NK-LGL patients (n = 6) were treated with DMSO or ixazomib (100 or 200 nM) for 48 hours, and cells were stained for apoptosis with Annexin-V and 7-AAD and analyzed by flow cytometry (right). (B) PBMCs from patients with T-LGL leukemia were treated with proteasome inhibitor bortezomib (5 nM) or ixazomib (100 nM) for 24 hours, and c-FLIP, caspase-3, and PARP cleavage was determined by western blot assay. Equal loading for all western blot assays was confirmed by probing with a β-actin antibody. (C) PBMCs from normal donors (n = 3) and T-LGL patients (n = 4) were treated with DMSO, bortezomib, or ixazomib for 48 hours. Cells were stained for CD3, CD8, CD57 and apoptosis markers. *P < .05, **P < .01, ***P < .001 (1-way ANOVA) significant differences between T-LGL patients and normal donors.
Figure 7.
Figure 7.
Proteasome inhibitors downregulate TRAIL expression in leukemic LGLs. (A-C) TL-1 (A), NKL (B), and LGL PBMCs (C; T-LGL n = 7, NK-LGL n = 3) were treated with bortezomib, ixazomib, or DMSO vehicle for 6 hours. Relative TRAIL mRNA expression was determined by quantitative real-time PCR. Values are presented as mean ± SEM. *P < .05 indicates significant difference between DMSO and proteasome inhibitor treatments (Student t test). In panel C, **P = 1.84E−5 and ***P = .0015. (D-F) LGL leukemia cell line TL-1 (D), NKL (E), or LGL patient PBMCs (F; T-LGL n = 4; NK-LGL n = 2) were treated with bortezomib (5 nM), ixazomib (100 nM), or DMSO, and total protein samples were collected to assess TRAIL protein levels by immunoblotting assay. Equal loading for western blot assay was confirmed by probing with β-actin antibody. Vertical lines within some patient blots indicate regions where lanes were removed from the image in order to show identical time points for all samples.

References

    1. Loughran TP., Jr Clonal diseases of large granular lymphocytes. Blood. 1993;82(1):1-14. - PubMed
    1. Lamy T, Loughran TP Jr. How I treat LGL leukemia. Blood. 2011;117(10):2764-2774. - PMC - PubMed
    1. Yang J, Epling-Burnette PK, Painter JS, et al. . Antigen activation and impaired Fas-induced death-inducing signaling complex formation in T-large-granular lymphocyte leukemia. Blood. 2008;111(3):1610-1616. - PMC - PubMed
    1. Jerez A, Clemente MJ, Makishima H, et al. . STAT3 mutations unify the pathogenesis of chronic lymphoproliferative disorders of NK cells and T-cell large granular lymphocyte leukemia. Blood. 2012;120(15):3048-3057. - PMC - PubMed
    1. Koskela HL, Eldfors S, Ellonen P, et al. . Somatic STAT3 mutations in large granular lymphocytic leukemia. N Engl J Med. 2012;366(20):1905-1913. - PMC - PubMed

Publication types

MeSH terms

Substances