. 2018 Jun 8;293(23):8956-8968.
doi: 10.1074/jbc.RA117.000713. Epub 2018 Apr 26.

Autophagy regulates exosomal release of prions in neuronal cells

Affiliations

Autophagy regulates exosomal release of prions in neuronal cells

Basant A Abdulrahman et al. J Biol Chem. .

Abstract

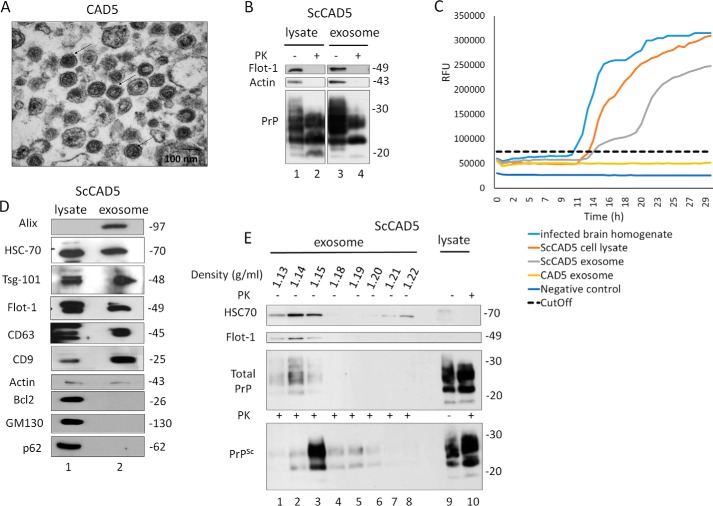
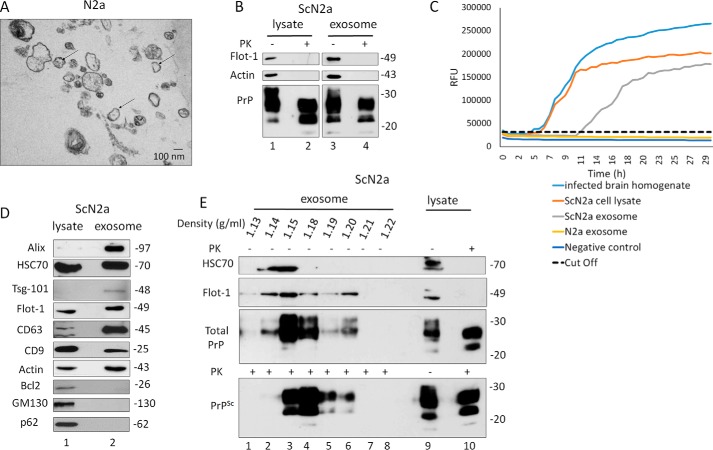
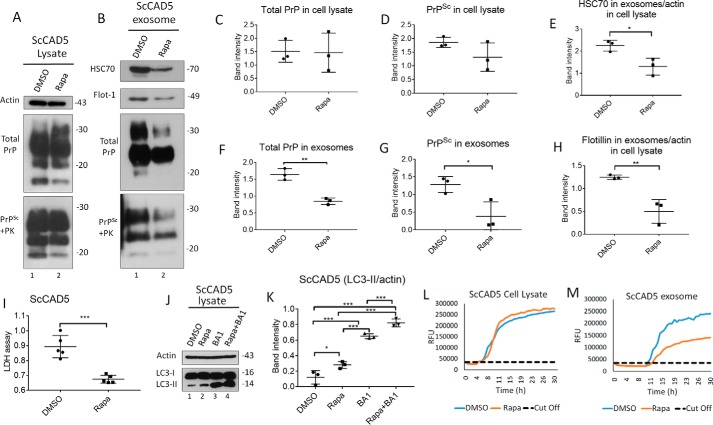
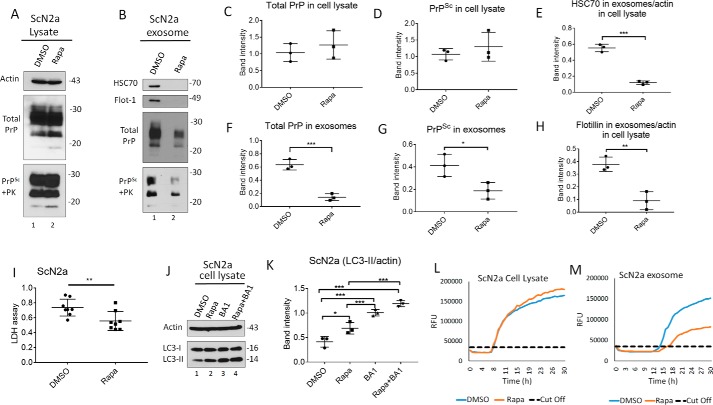
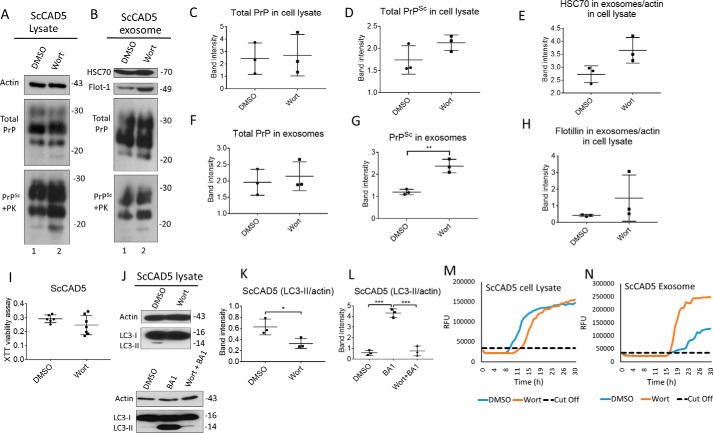
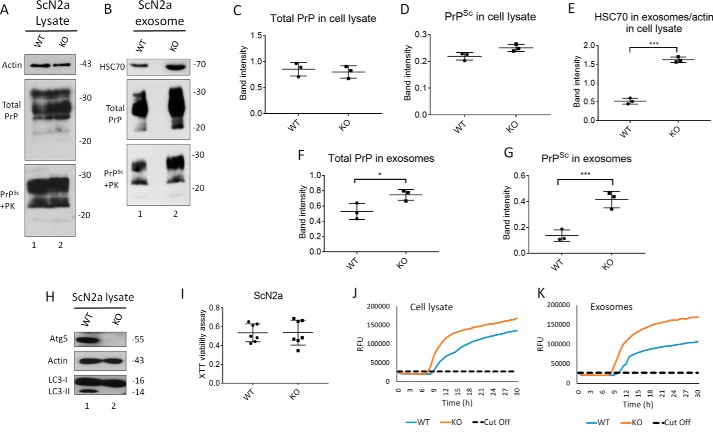
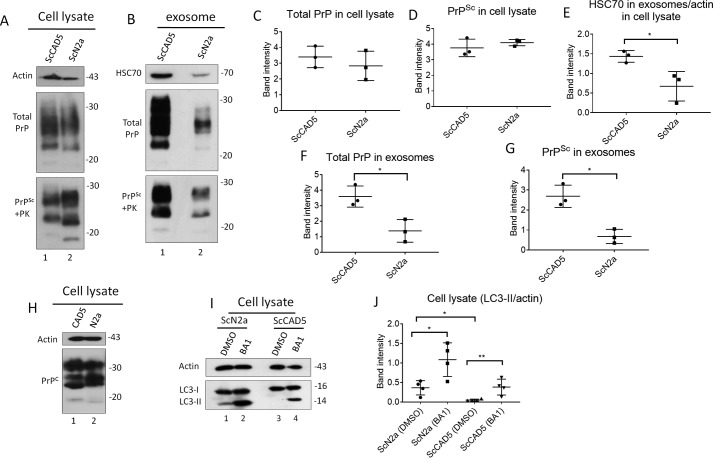
Prions are protein-based infectious agents that autocatalytically convert the cellular prion protein PrPC to its pathological isoform PrPSc Subsequent aggregation and accumulation of PrPSc in nervous tissues causes several invariably fatal neurodegenerative diseases in humans and animals. Prions can infect recipient cells when packaged into endosome-derived nanoparticles called exosomes, which are present in biological fluids such as blood, urine, and saliva. Autophagy is a basic cellular degradation and recycling machinery that also affects exosomal processing, but whether autophagy controls release of prions in exosomes is unclear. Our work investigated the effect of autophagy modulation on exosomal release of prions and how this interplay affects cellular prion infection. Exosomes isolated from cultured murine central neuronal cells (CAD5) and peripheral neuronal cells (N2a) contained prions as shown by immunoblotting for PrPSc, prion-conversion activity, and cell culture infection. We observed that autophagy stimulation with the mTOR inhibitor rapamycin strongly inhibited exosomal prion release. In contrast, inhibition of autophagy by wortmannin or CRISPR/Cas9-mediated knockout of the autophagy protein Atg5 (autophagy-related 5) greatly increased the release of exosomes and exosome-associated prions. We also show that a difference in exosomal prion release between CAD5 and N2a cells is related to differences at the level of basal autophagy. Taken together, our results indicate that autophagy modulation can control lateral transfer of prions by interfering with their exosomal release. We describe a novel role of autophagy in the prion life cycle, an understanding that may provide useful targets for containing prion diseases.

Keywords: CRISPR/Cas; Creutzfeldt–Jakob disease; RT-QuIC; autophagy; exosome (vesicle); extracellular vesicles; neurodegeneration; prion; prion disease; scrapie.


Conflict of interest statement

The authors declare that they have no conflicts of interest with the contents of this article

Figures

Figure 1.
Figure 1.
Characterization of exosomes isolated from CAD5/ScCAD5 neuronal cells. A, representative TEM of exosomes isolated from CAD5 culture medium reveals a homogenous population of vesicles of 100 nm in diameter characteristic for exosomes (some denoted by black arrows). Scale bar, 100 nm. B, immunoblot of ScCAD5 cell lysate and exosome preparations probed for total PrP (−PK) and PrPSc (+PK) (anti-PrP mAb 4H11). Actin was used as loading control. Flotillin-1 (Flot-1) was used as an exosome marker. C, RT-QuIC of CAD5 exosome, ScCAD5 exosome, ScCAD5 cell lysate, 10% brain homogenate from terminally prion-sick mice (22L) or left unseeded (negative control). The average increase of thioflavin-T fluorescence of replicate wells is plotted as a function of time. The y axis represents RFU, and the x axis represents time (h). D, immunoblot analysis of ScCAD5 cell lysate and exosomes isolated from ScCAD5 culture medium. Exosome preparation is positive for exosome markers Alix, HSC70, Tsg-101, flotillin-1, CD63, and CD9 and negative for mitochondrial marker Bcl2, Golgi marker GM130, and nuclear marker nucleoporin p62. Actin was used loading control. E, ScCAD5 exosome pellet loaded on the top of a continuous sucrose gradient and ultracentrifuged. Fractions were analyzed by Western blotting and probed for HSC70, flotillin-1, and mAb 4H11 to detect PrP/PrPSc. Lanes 9 and 10 represent cell lysate before and after PK digestion, respectively.
Figure 2.
Figure 2.
Characterization of exosomes isolated from N2a/ScN2a cells. A, representative TEM of exosomes isolated from N2a culture medium shows a population of vesicles of 100 nm in diameter (some denoted by black arrows). Scale bar, 100 nm. B, immunoblot of ScN2a cell lysate and exosome preparations probed for total PrP (−PK) and PrPSc (+PK) (anti-PrP mAb 4H11). Flotillin-1 (Flot-1) was used as exosome marker. Actin was used as loading control. C, RT-QuIC of N2a exosome, ScN2a exosome, ScN2a cell lysate, and 10% brain homogenate from terminally prion-sick mice (22L) or left unseeded (negative control). The average increase of thioflavin-T fluorescence of replicate wells is plotted as a function of time. The y axis represents RFU, and the x axis represents time in hours. D, immunoblot analysis of ScN2a cell lysate and exosomes isolated from ScN2a cell culture medium. Exosome preparation is positive for exosome markers Alix, HSC70, Tsg-101, flotillin-1, CD63, and CD9 and negative for mitochondrial marker Bcl2, Golgi marker GM130, and nuclear marker nucleoporin p62. Actin was used as loading control. E, ScN2a exosome pallet loaded on the top of a continuous sucrose gradient and ultracentrifuged. The fractions were analyzed by Western blotting and probed for HSC70, flotillin-1, and mAb 4H11 to detect total PrP and PrPSc. Lanes 9 and 10 are cell lysate before and after PK digestion, respectively.
Figure 3.
Figure 3.
Autophagy stimulation decreases exosome secretion and consequently impacts exosomal PrPSc in ScCAD5 neuronal cells. A and B, Western blotting of cell lysate and exosomes from ScCAD5 cells treated with 500 nm of rapamycin (Rapa) or solvent only (DMSO). HSC70 and flotillin-1 (Flot-1) were used as exosome markers. PrP (−/+ PK) was probed with mAb 4H11. C and D, densitometric analysis for either total PrP or PrPSc, respectively, from ScCAD5 cell lysate normalized with actin (± S.D.) after treatment with 500 nm rapamycin or DMSO (n = 3 experiments). E and H, densitometric analysis for exosomal HSC70 and flotillin-1, respectively, normalized with actin in the corresponding cell lysate (± S.D.) after treatment with rapamycin or DMSO (n = 3 experiments). *, p < 0.05; **, p < 0.01. F and G, densitometric analysis for either total PrP or PrPSc, respectively, from ScCAD5 exosomes normalized with actin in the corresponding cell lysate (± S.D.) after treatment with rapamycin or DMSO (n = 3 experiments). **, p < 0.01. *, p < 0.05. I, lactate dehydrogenase (LDH) cytotoxicity assay (OD = 490 nm). Supernatant from ScCAD cells treated with rapamycin or DMSO for 6 days was tested to detect the level of LDH (± S.D.; n = 5 replicates). ***, p < 0.001. J, Western blotting of cell lysate of ScCAD5 cells treated with vehicle only (DMSO), 500 nm of rapamycin, 100 nm of bafilomycin A1 (BA1), or rapamycin + bafilomycin A1 for 4 h. LC3 was used to measure the autophagic flux, and actin was used as loading control. K, densitometric analysis for LC3-II protein levels normalized with actin (± S.D.; n = 3 replicates). *, p < 0.05; ***, p < 0.001. L and M, RT-QuIC for either ScCAD5 cell lysate or exosomes, respectively. The cells were treated with rapamycin or solvent only (DMSO).
Figure 4.
Figure 4.
Autophagy stimulation mitigates exosome secretion and significantly decreases exosomal PrPSc in ScN2a cells. A and B, Western blotting of cell lysate and exosomes from ScN2a cells treated with 500 nm of rapamycin (Rapa) or solvent only (DMSO) for 6 days. HSC70 and flotillin-1 (Flot-1) were used as exosome markers. PrP (−/+ PK) was probed with mAb 4H11. Actin was used as a loading control for cell lysate. C and D, densitometric analysis for either total PrP or PrPSc, respectively, from ScN2a cell lysate normalized with actin (± S.D.) after treatment with rapamycin or DMSO (n = 3 experiments). E and H, densitometric analysis for exosomal HSC70 and flotillin-1, respectively, normalized with actin in the corresponding cell lysate (± S.D.; n = 3 experiments). ***, p < 0.001; **, p < 0.01. F and G, densitometric analysis for either total PrP or PrPSc, respectively, from ScN2a exosomes normalized with actin in the corresponding cell lysate (± S.D.; n = 3 experiments). ***, p < 0.001; *, p < 0.05. I, lactate dehydrogenase (LDH) cytotoxicity assay (OD = 490 nm). Supernatant from ScN2a cells treated with 500 nm rapamycin or DMSO for 6 days was tested to detect the level of LDH (± S.D.; n = 8 replicates). **, p < 0.01. J, Western blotting of cell lysate of ScN2a cells treated with vehicle only (DMSO), 500 nm of rapamycin, 100 nm of bafilomycin A1 (BA1), or rapamycin + bafilomycin A1 for 4 h. LC3 was used to measure the autophagic flux, and actin was used as loading control. K, densitometric analysis for LC3-II protein levels normalized with actin (± S.D.; n = 3 replicates). *, p < 0.05; ***, p < 0.001. L and M, RT-QuIC for either ScN2a cell lysate or exosomes; respectively; the cells were treated with rapamycin or solvent only (DMSO).
Figure 5.
Figure 5.
Inhibition of autophagy increases exosome release and exosomal PrPSc in ScCAD5 cells. A and B, Western blotting of cell lysate and exosomes from ScCAD5 cells, respectively, treated with 4 nm of wortmannin (Wort) for 48 h or solvent only treated (DMSO). HSC70 and flotillin-1 (Flot-1) were used as exosome markers. Actin was used as loading control for cell lysate. PrP (−/+ PK) was probed with mAb 4H11. C and D, densitometric analysis for either total PrP or PrPSc, respectively, from ScCAD5 cell lysate normalized with actin (± S.D.) after treatment with 4 nm of wortmannin or DMSO (n = 3 experiments). E and H, densitometric analysis for exosomal HSC70 and flotillin-1, respectively, normalized with actin in the corresponding cell lysate (± S.D.; n = 3 experiments). F and G, densitometric analysis for either total PrP or PrPSc, respectively, from ScCAD5 exosomes normalized with actin in the corresponding cell lysate (± S.D.; n = 3 experiments). **, p < 0.01. I, XTT viability assay. ScCAD5 cells were treated with 4 nm wortmannin or DMSO for 48 h; then cell viability was detected based on metabolic activity (± S.D.; n = 7 replicates). J, upper panel, Western blotting of cell lysate of ScCAD5 cells treated with vehicle only (DMSO) or 4 nm of wortmannin for 4 h. Lower panel, Western blotting of cell lysate of ScCAD5 cells treated with vehicle only (DMSO), 4 nm of wortmannin, or wortmannin with bafilomycin A1 (Wort + BA1) for 4 h. LC3 was used to measure the autophagic flux and actin was used as loading control. K and L, densitometric analysis for LC3-II protein levels normalized with actin (± S.D.; n = 3 replicates). *, p < 0.05; ***, p < 0.001. M and N, RT-QuIC for either ScCAD5 cell lysate or exosomes, respectively. The cells were treated with wortmannin or solvent only (DMSO).
Figure 6.
Figure 6.
Knockout of Atg5 increases exosome release and exosomal PrPSc in ScN2a cells. A and B, Western blotting of cell lysate and exosomes from ScN2a cells respectively, either WT or KO for Atg5. HSC70 was used as exosomal markers. Total PrP and PrPSc were detected using mAb 4H11 antibody. C and D, densitometric analysis for either total PrP or PrPSc, respectively, from WT or KO ScN2a cell lysate normalized with actin (± S.D.; n = 3 experiments). E, densitometric analysis for exosomal HSC70 normalized with actin in the corresponding cell lysate (± S.D.; n = 3 experiments). ***, p < 0.001. F and G, densitometric analysis for either total PrP or PrPSc, respectively, from WT or KO ScN2a exosomes normalized with actin in the corresponding cell lysate (± S.D.; n = 3 experiments). ***, p < 0.001; *, p < 0.05. H, immunoblot showing complete knockout of Atg5 compared with WT ScN2a cells. Actin was used as loading control. Atg5 KO resulted in complete absence of LC3-II, confirming disruption of autophagy machinery. I, XTT viability assay. (OD = 490 nm). The cells were cultured for 48 h for XTT viability assay (n = 7 replicates). J and K, RT-QuIC for WT or KO ScN2a cells.
Figure 7.
Figure 7.
ScCAD5 cells release more exosomes and PrPSc compared with ScN2a cells, which is inversely correlated to autophagy competence. Comparable numbers of ScN2a and ScCAD5 cells were used in this experiment. A and B, cell lysate and exosomes isolated from conditioned media from ScCAD5 and ScN2a cells were analyzed in immunoblot for HSC70 and PrP. C and D, densitometric analysis for either total PrP or PrPSc respectively from ScCAD5 or ScN2a cell lysate normalized with actin (± S.D.; n = 3 experiments). E, densitometric analysis for exosomal HSC70 normalized with actin in the corresponding cell lysate (± S.D.; n = 3 experiments). *, p < 0.05. F and G, densitometric analysis for either total PrP or PrPSc, respectively, from ScCAD5 or ScN2a exosomes normalized with actin in the corresponding cell lysate (± S.D.; n = 3 experiments). *, p < 0.05. H, immunoblot comparing PrPC levels between CAD5 and N2a cells using mAb 4H11. I, immunoblot comparing the level of LC3-I to LC3-II between ScN2a and ScCAD5 cells with and without treatment with bafilomycin A1 (BA1) for 4 h. Actin was used as a loading control. J, densitometric analysis for LC3-II protein levels normalized with actin (± S.D.; n = 4 replicates). *, p < 0.05, **, p < 0.01.

References

    1. Prusiner S. B. (1982) Novel proteinaceous infectious particles cause scrapie. Science 216, 136–144 10.1126/science.6801762 - DOI - PubMed
    1. Prusiner S. B. (1998) Prions. Proc. Natl. Acad. Sci. U.S.A. 95, 13363–13383 10.1073/pnas.95.23.13363 - DOI - PMC - PubMed
    1. Gilch S., Chitoor N., Taguchi Y., Stuart M., Jewell J. E., and Schätzl H. M. (2011) Chronic wasting disease. Top. Curr. Chem. 305, 51–77 10.1007/128_2011_159 - DOI - PubMed
    1. Telling G. C. (2013) The importance of prions. PLoS Pathog. 9, e1003090 10.1371/journal.ppat.1003090 - DOI - PMC - PubMed
    1. Wadsworth J. D., Hill A. F., Beck J. A., and Collinge J. (2003) Molecular and clinical classification of human prion disease. Br. Med. Bull. 66, 241–254 10.1093/bmb/66.1.241 - DOI - PubMed

Publication types