. 2018 Aug;103(8):1390-1402.
doi: 10.3324/haematol.2017.186619. Epub 2018 Apr 26.

The early expansion of anergic NKG2Apos/CD56dim/CD16neg natural killer represents a therapeutic target in haploidentical hematopoietic stem cell transplantation

Affiliations

The early expansion of anergic NKG2Apos/CD56dim/CD16neg natural killer represents a therapeutic target in haploidentical hematopoietic stem cell transplantation

Alessandra Roberto et al. Haematologica. 2018 Aug.

Abstract

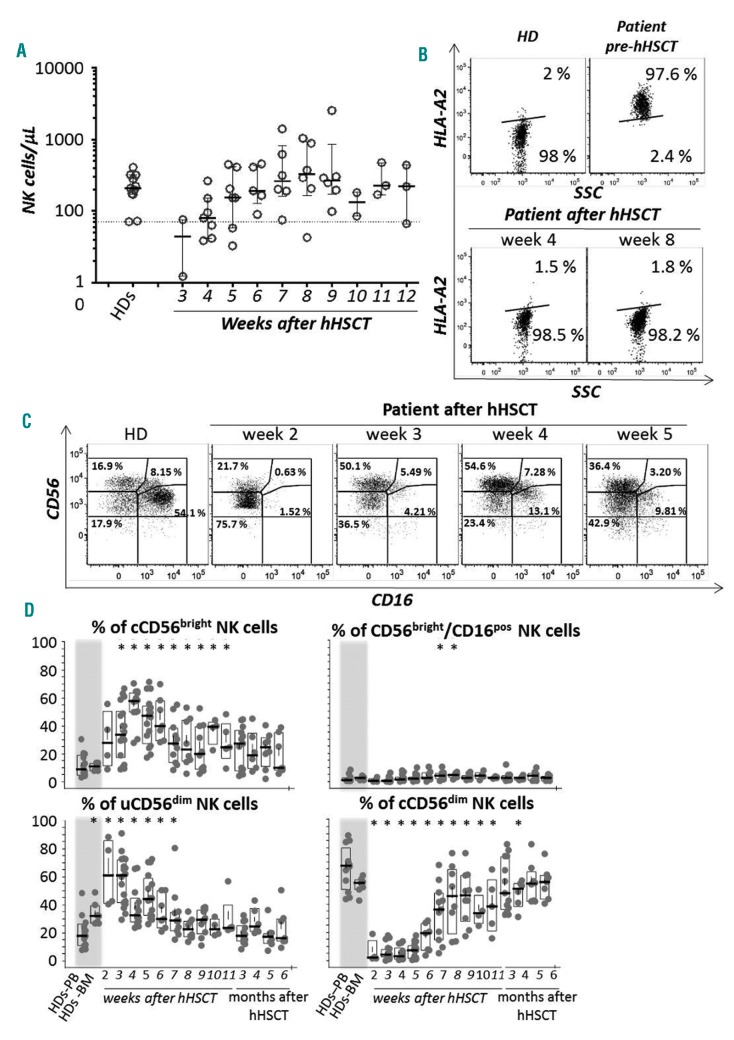
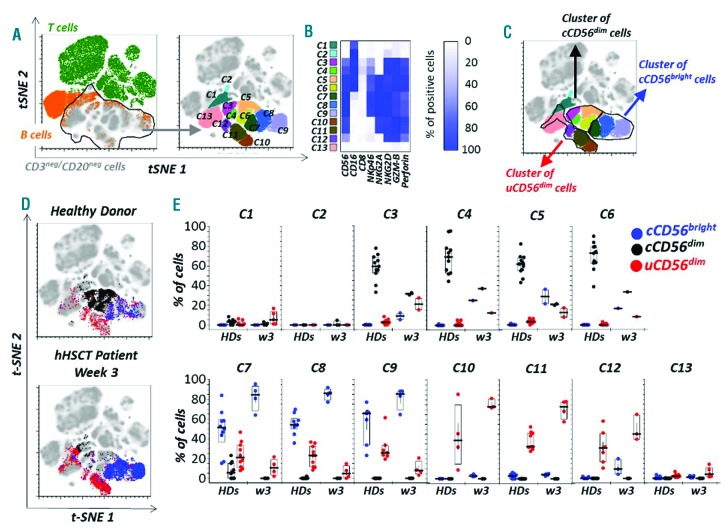
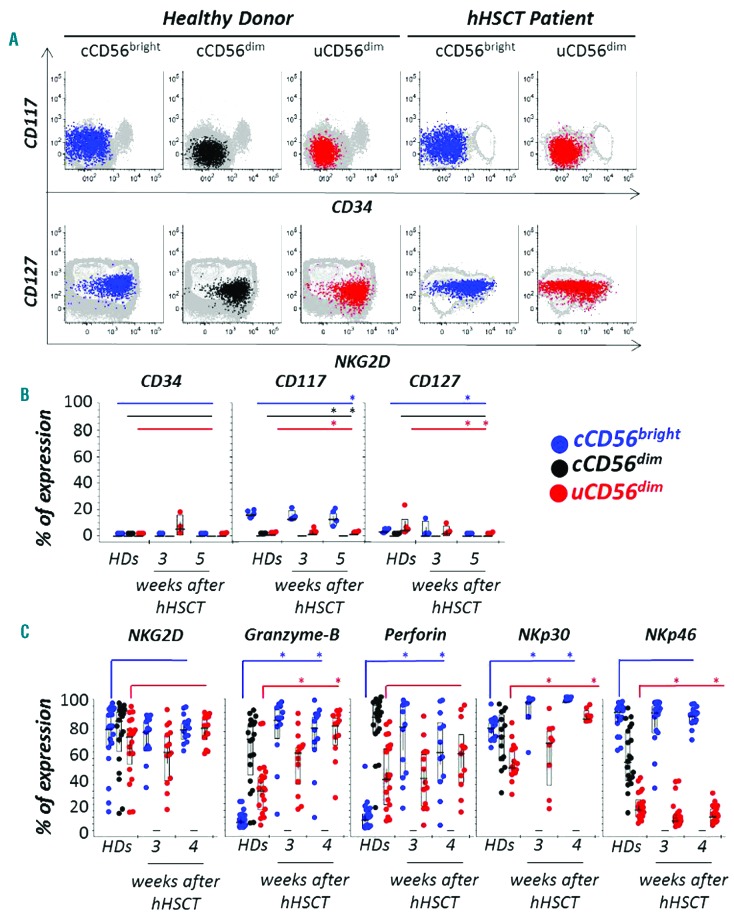
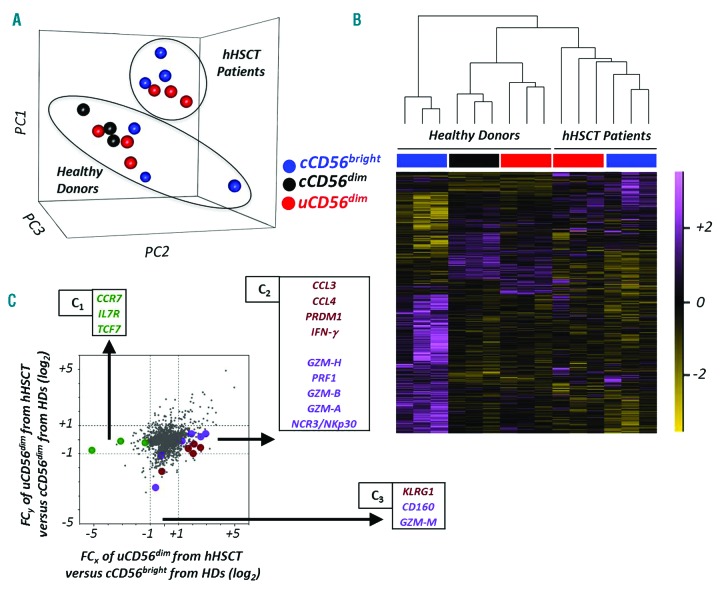
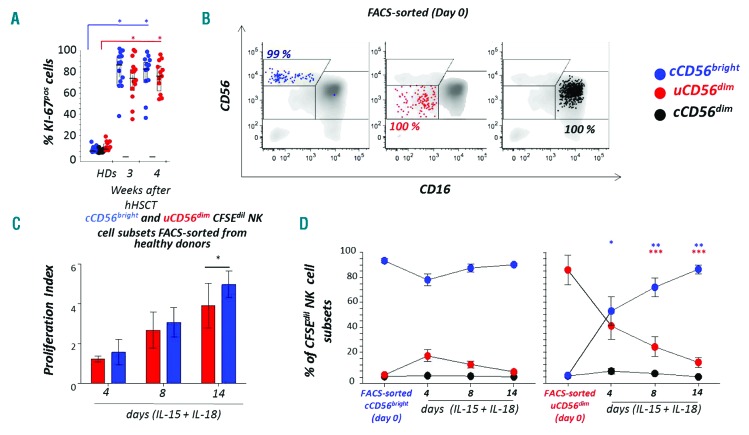
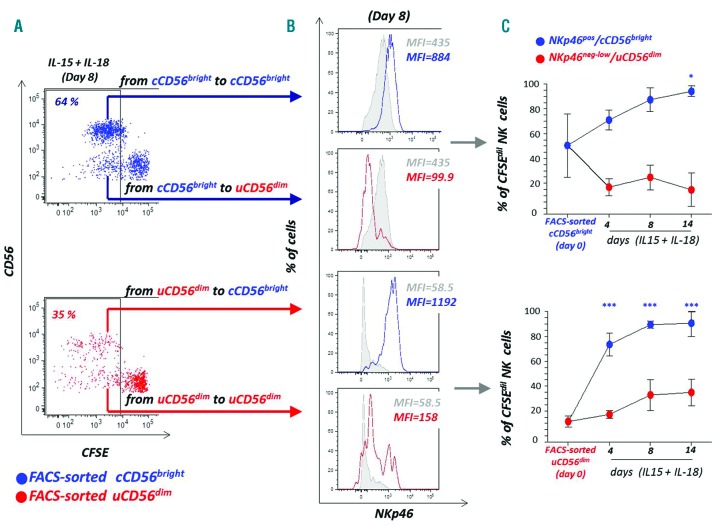
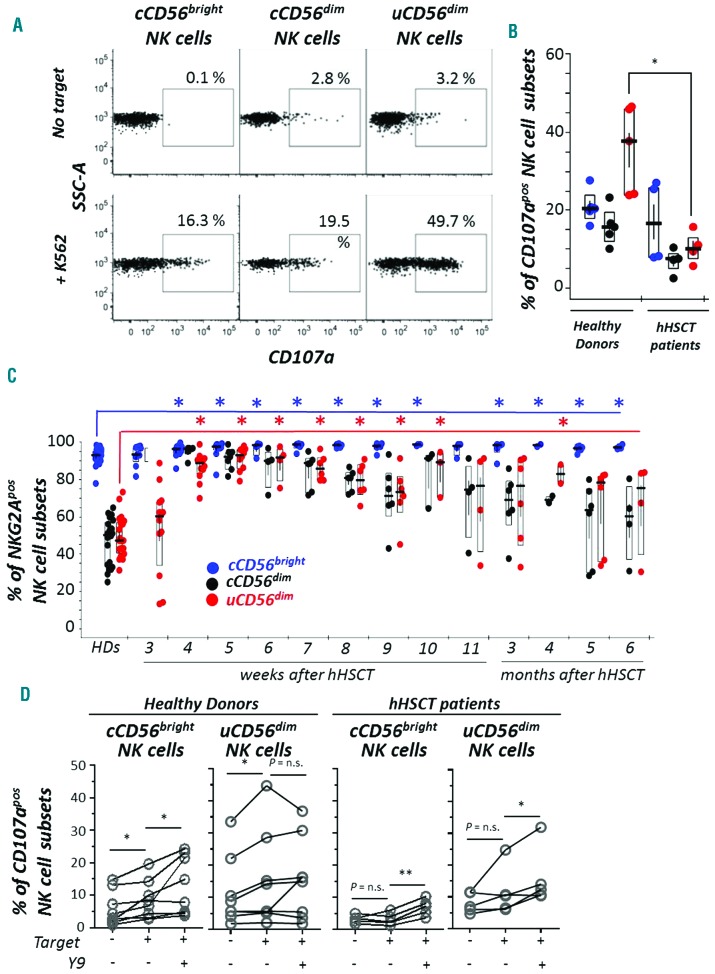
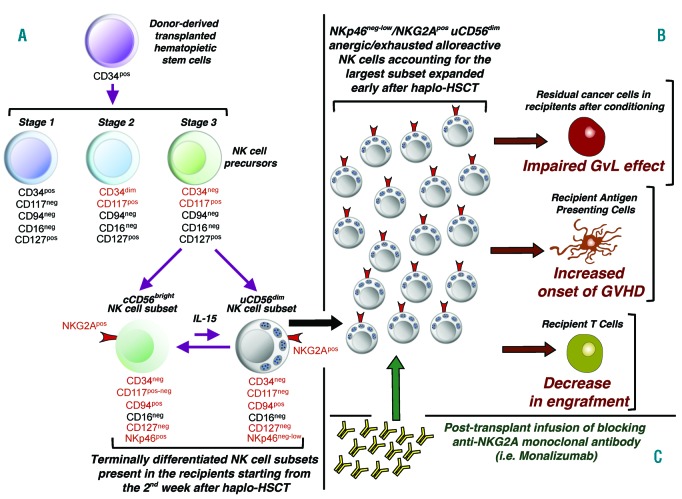
Natural killer cells are the first lymphocyte population to reconstitute early after non-myeloablative and T cell-replete haploidentical hematopoietic stem cell transplantation with post-transplant infusion of cyclophosphamide. The study herein characterizes the transient and predominant expansion starting from the second week following haploidentical hematopoietic stem cell transplantation of a donor-derived unconventional subset of NKp46neg-low/CD56dim/CD16neg natural killer cells expressing remarkably high levels of CD94/NKG2A. Both transcription and phenotypic profiles indicated that unconventional NKp46neg-low/CD56dim/CD16neg cells are a distinct natural killer cell subpopulation with features of late stage differentiation, yet retaining proliferative capability and functional plasticity to generate conventional NKp46pos/CD56bright/CD16neg-low cells in response to interleukin-15 plus interleukin-18. While present at low frequency in healthy donors, unconventional NKp46neg-low/CD56dim/CD16neg cells are greatly expanded in the seven weeks following haploidentical hematopoietic stem cell transplantation, and express high levels of the activating receptors NKG2D and NKp30 as well as of the lytic granules Granzyme-B and Perforin. Nonetheless, NKp46neg-low/CD56dim/CD16neg cells displayed a markedly defective cytotoxicity that could be reversed by blocking the inhibitory receptor CD94/NKG2A. These data open new and important perspectives to better understand the ontogenesis/homeostasis of human natural killer cells and to develop a novel immune-therapeutic approach that targets the inhibitory NKG2A check-point, thus unleashing natural killer cell alloreactivity early after haploidentical hematopoietic stem cell transplantation.

Trial registration: ClinicalTrials.gov NCT02459301.


Figures

Figure 1.
Figure 1.
Kinetic of NK cell subset immune reconstitution after haploidentical HSCT. (A) Summary graph showing the absolute counts (cells/μL) of circulating natural killer (NK) cells (mean ± SEM) from hematopoietic stem cell healthy donors (HDs) and their related recipients at different time-points after haploidentical HSCT (hHSCT). (B) Representative example of flow cytometry dot plots showing the complete chimerism of HD-derived HLA-A2neg NK cells reconstituting an HLA-A2pos recipient (upper line) after four and eight weeks from hHSCT (lower line). (C) Representative example of flow cytometry dot plots showing the kinetic of HD-derived NK cell subset distribution in the recipient after two, three, four and five weeks from hHSCT. (D) Summary statistical graph showing the frequency (median ± SEM) of conventional CD56bright/CD16neg-low (cCD56bright), CD56bright/CD16pos, conventional CD56dim/CD16pos (cCD56dim) and unconventional CD56dim/CD16neg (uCD56dim) NK cell subsets in the peripheral blood (PB) and bone marrow (BM) of 30 hematopoietic stem cell HDs compared to their counterparts in the blood of the related recipients up to six months after hHSCT. *P<0.05.
Figure 2.
Figure 2.
Clustering of uCD56dim NK cells. (A) t-distributed Stochastic Neighbor Embedding (t-SNE) plot of lymphocytes from 11 healthy donors (HDs) and five recipients at three weeks after haploidentical HSCT (hHSCT). CD3pos T (green on the left plot) and CD20pos B (orange on the left plot) cells are grouped within the t-SNE map. Within the CD3neg/CD20neg gate (gray within the left plot), 13 (from C1 to C13) different clusters of lymphocytes were defined based on the population boundaries (right plot). (B) Heatmap showing the degree of expression of CD56, CD16, CD8, NKp46, NKG2A, NKG2D, Granzyme-B (GRM-B) and Perforin on the 13 clusters of non-T and non-B lymphocytes defined in the right t-SNE plot of panel A. (C–D) t-SNE plots showing, within the 13 CD3neg/CD20neg clusters of lymphocytes presented in panel B, the clusters of cCD56bright (blue), cCD56dim (black) and uCD56dim (red) NK cell subsets from HDs and from hHSCT-patients three weeks after HSCT together (C) or separately (D). (E) Graphs showing the frequencies (median ± SEM) of cCD56bright, cCD56dim and uCD56dim from HDs and patients at three weeks after hHSCT (w3) out of the total cells in each of the 13 clusters of CD3neg/CD20neg lymphocytes.
Figure 3.
Figure 3.
Phenotype of NK cell subsets in healthy donors and haploidentical HSCT patients. (A) Representative example of flow cytometry dot plots from a healthy donors (HDs) and a patient after three weeks from haploidentical HSCT (hHSCT) showing the surface expression of CD117, CD34, CD127 and NKG2D on cCD56bright (blue), cCD56dim (black) and uCD56dim (red) NK cells. The phenotypes of these representative NK cell subsets are overlaid with those of their viable lymphocytes (gray background) used as positive controls. (B) Summary statistical graph showing the expression of CD34, CD117 and CD127 on cCD56bright (blue), cCD56dim (black) and uCD56dim (red) from three HSC HDs and their recipients at three and five weeks after hHSCT. (C) Summary statistical graph showing the expression of NKG2D, Granzyme-B, Perforin, NKp30, NKp46 on cCD56bright (blue), cCD56dim (black) and uCD56dim (red) from HSC HDs and their recipients after three and four weeks from hHSCT. *P<0.05
Figure 4.
Figure 4.
Transcriptional profiles of NK cell subsets from healthy donors and patients three weeks after haploidentical HSCT. (A) Principal component analysis (PCA) showing the gene expression profiles of cCD56bright, cCD56dim and uCD56dim NK subsets from healthy donors (HDs) and of cCD56bright and uCD56dim from patients after three weeks from haploidentical HSCT (hHSCT). (B) Hierarchical clustering of NK cell subsets from healthy donors and patients three weeks after hHSCT. Sample grouping, obtained from the expression levels of 3072 genes that are differentially expressed between cCD56bright, uCD56dim and cCD56dim NK cells from HDs. Yellow and violet colors indicate decreased and increased expression, respectively. (C) Log2 expression fold-change (FC) in uCD56dim from hHSCT patients versus cCD56bright cells (x-axis), and versus cCD56dim cells (y-axis) from HDs. C1 and C2 boxes indicate the genes similarly expressed with cCD56dim from HDs but downregulated (C1) and upregulated (C2) in uCD56dim from hHSCT versus cCD56bright from HDs. C3 box indicates the genes downregulated in uCD56dim from hHSCT versus cCD56dim from HDs and similarly expressed with cCD56bright from HDs. Downmodulated genes highlighted in green and upmodulated genes highlighted in red are associated with NK cell maturation, genes highlighted in violet are associated with NK cell activation or cytotoxicity.
Figure 5.
Figure 5.
FACS-sorted uCD56dim NK cells generate cCD56br NK cells under IL-15 and IL-18 stimulation. (A) Summary statistical graph showing the expression of Ki67 on cCD56bright (blue), cCD56dim (black) and uCD56dim (red) from HSC healthy donors (HDs) and their recipients after three and four weeks from hHSCT. (B) Representative example from a HD of flow cytometry dot plots showing the purity of fluorescence-activated cell sorting (FACS)-sorted cCD56bright (blue), cCD56dim (black) and uCD56dim (red) (left column) natural killer (NK) cell subsets. Highly pure and FACS-sorted NK cell subsets are overlaid with the phenotype of purified CD3neg/CD20neg NK cells expressing CD56 and CD16 (gray). (C) Summary statistical graphs showing the proliferation index of FACS-sorted cCD56bright (blue) and uCD56dim (red) NK cell subsets from six HDs at four, eight and 14 days of culture with interleukin (IL)-15+ IL-18. (D) Summary statistical graph showing the kinetic of CFSE-diluting (CFSEdil) cCD56bright (blue), cCD56dim (black) and uCD56dim (red) NK cell subsets generated from FACS-sorted cCD56bright (upper panel) and uCD56dim (lower panel) from seven HDs. No data are available for the cCD56dim NK cells, as they were not proliferating in response to IL-15 and IL-18. Data are expressed as means ± S.D. *P<0.05; **P<0.01; ***P<0.001.
Figure 6.
Figure 6.
Proliferating NKp46neg-low/uCD56dim NK cells differentiate in NKp46pos/cCD56bright NK cells. A) Representative example from a HD of flow cytometry dot plots showing the expression of CD56 on fluorescence-activated cell sorting (FACS)-sorted and CFSE-diluting (CFSEdil) cCD56bright (blue) and uCD56dim (red) from a HD after eight days in culture with interleukin (IL) -15 + IL-18. (B) Representative example from the same HD shown in panel A of flow cytometry histograms showing the level of NKp46 expression, expressed as mean fluorescence intensity (MFI), after eight days in culture with IL-15 + IL+18 (MFI) on cCD56bright (blue line) and uCD56dim (red line) natural killer (NK) cells derived either from FACS-sorted cCD56bright NK cells (blue) or from FACS-sorted uCD56dim NK cells (red). Overlaid gray histograms represent the level of NKp46 expression on the relative freshly purified and FACS-sorted parental NK cells. (C) Summary statistical graph showing the kinetic of NKp46pos/cCD56bright (blue) and of NKp46neg-low/uCD56dim (red) NK cell subsets generated from FACS-sorted cCD56bright (upper graph) and uCD56dim (lower graph) from seven healthy donors. No data are available in panels B and C for cCD56dim NK cells, as they were not proliferating in response to IL-15 and IL-18. Data are expressed as means ± S.D. *P<0.05; ***P<0.001.
Figure 7.
Figure 7.
Cytotoxicity of NKp46neg-low/uCD56dim from hHSCT patients expressing transient high levels of NK2A early after hHSCT. A) Representative example from a healthy donor (HD) (lower line) of flow cytometry dot plots showing the expression of CD107a (i.e., cytotoxic natural killer [NK] cells) on cCD56bright (left), cCD56dim (middle) and uCD56dim (right) (left column) either in the absence (upper line) or in the presence (lower line) of K562. (B) Summary statistical graph showing the percentage of CD107apos (median ± SEM) on cCD56bright (blue), cCD56dim (black) and uCD56dim (red) from five HDs and four patients after six weeks from haploidentical HSCT (hHSCT). The background of CD107apos NK cells present in the spontaneous degranulation has been subtracted for the analyses performed in the presence of K562 cell line. (C) Summary statistical graph showing the expression of NKG2A on cCD56bright (blue), cCD56dim (black) and uCD56dim (red) from HSC HDs and their recipients at different time points up to six months after hHSCT (medians ± SEM). (D) Summary statistical graph showing the percentage of CD107apos (median ± SEM) on cCD56bright and uCD56dim NK cells from eight HDs and five patients after six weeks from hHSCT alone (−) or incubated (+) with 721.221G cell line, and either in the absence (−) or in the presence (+) of the masking anti-CD94/NKG2A mAb (Y9). *P<0.05; **P<0.01. ns: not significant.
Figure 8.
Figure 8.
NK cell immune-reconstitution after haploidentical HSCT. (A) Natural killer (NK) cell ontogenesis (left): after the infusion of unmanipulated graft in non myeloablative haplo-hematopoietic stem cells transplant (hHSCT), the reconstitution of NK cells in recipients is completely donor-dependent and starts from CD34pos hematopoietic stem cells. Indeed, mature NK cells infused with the graft do not survive the PT infusion of cyclophosphamide. The first NK cell subsets to be detected starting from the second week after hHSCT are the cCD56bright and uCD56dim NK cells, with the latter population being by far the largest one, expanded early in the first weeks after the transplant. cCD56bright and uCD56dim cells are not NK cell precursors and are able to exert a bi-directional differentiation following stimulation with IL-15, a pro-inflammatory cytokine present at high levels in the sera of lymphopenic recipients in the first weeks after allogeneic transplant., (B) Clinical impact (lower right): due to the high constitute expression of the inhibitory receptor NKG2A, uCD56dim NK cells are exhausted in their cytolic potential, and this impairment greatly affects: i) the clearance of residual malignant cells in the recipient that survived the conditioning regimens (i.e., decreased graft-versus-leukemia (GvL) effect), ii) the killing of recipient antigen presenting cells (APCs) presenting host antigens to donor T cells (i.e., increase in the onset of graft-versus-host disease [GvHD]), and iii) the elimination of recipient immune T cells that survived the conditioning regimens (i.e., decrease in engraftment). (C) Therapeutic insights (upper right): the blocking of the NKG2A inhibitory checkpoint unleashes donor-derived NK cell cytotoxicity and increases their alloreactive potential. Hence, the PT infusion of the humanized anti-NKG2A monoclonal antibody (i.e., Monalizumab) represents a potential novel therapeutic approach to improve the clinical outcome of hHSCT.

Similar articles

Cited by

References

    1. Patriarca F, Luznik L, Medeot M, et al. Experts’ considerations on HLA-haploidentical stem cell transplantation. Eur J Haematology. 2014;93(3):187–197. - PubMed
    1. Luznik L, O’Donnell PV, Symons HJ, et al. HLA-haploidentical bone marrow transplantation for hematologic malignancies using nonmyeloablative conditioning and high-dose, posttransplantation cyclophosphamide. Biol Blood Marrow Transplant. 2008;14(6):641–650. - PMC - PubMed
    1. Brunstein CG, Fuchs EJ, Carter SL, et al. Alternative donor transplantation after reduced intensity conditioning: results of parallel phase 2 trials using partially HLA-mismatched related bone marrow or unrelated double umbilical cord blood grafts. Blood. 2011;118(2):282–288. - PMC - PubMed
    1. Castagna L, Crocchiolo R, Furst S, et al. Bone marrow compared with peripheral blood stem cells for haploidentical transplantation with a nonmyeloablative conditioning regimen and post-transplantation cyclophosphamide. Biol Blood Marrow Transplant. 2014;20(5):724–729. - PubMed
    1. Imamura M, Tanaka J. Immunoregulatory cells for transplantation tolerance and graft-versus-leukemia effect. Int J Hematol. 2003;78(3):188–194. - PubMed

Publication types

MeSH terms

Associated data