. 2018 Jun 1;360(6392):eaar3131.
doi: 10.1126/science.aar3131. Epub 2018 Apr 26.

Single-cell reconstruction of developmental trajectories during zebrafish embryogenesis

Affiliations

Single-cell reconstruction of developmental trajectories during zebrafish embryogenesis

Jeffrey A Farrell et al. Science. .

Abstract

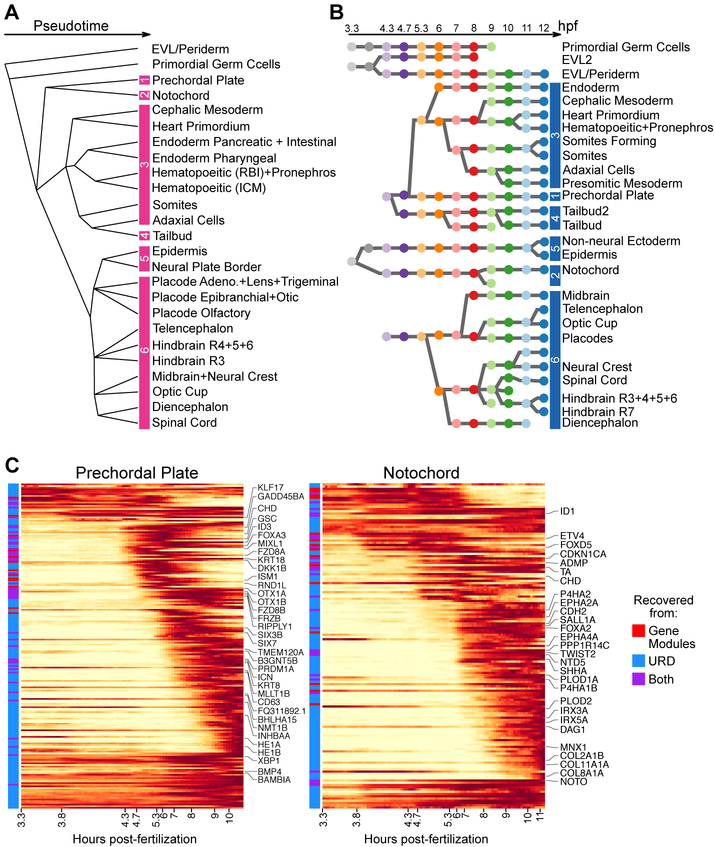
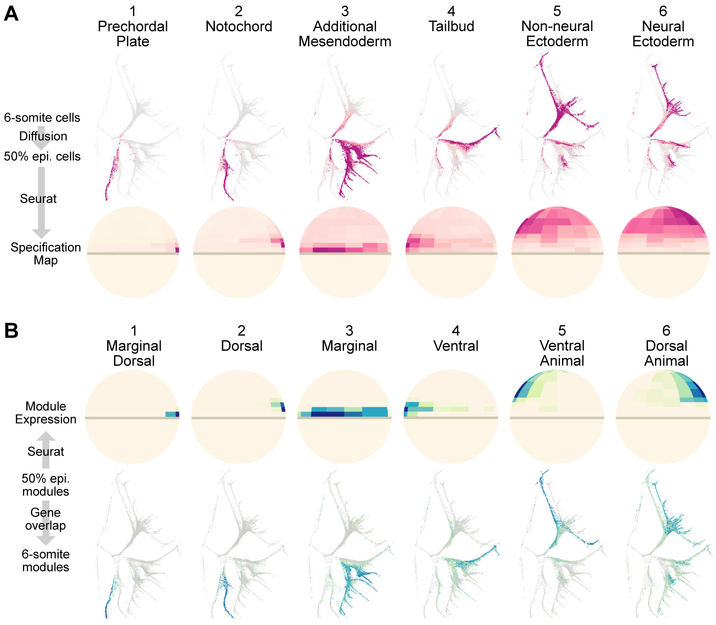
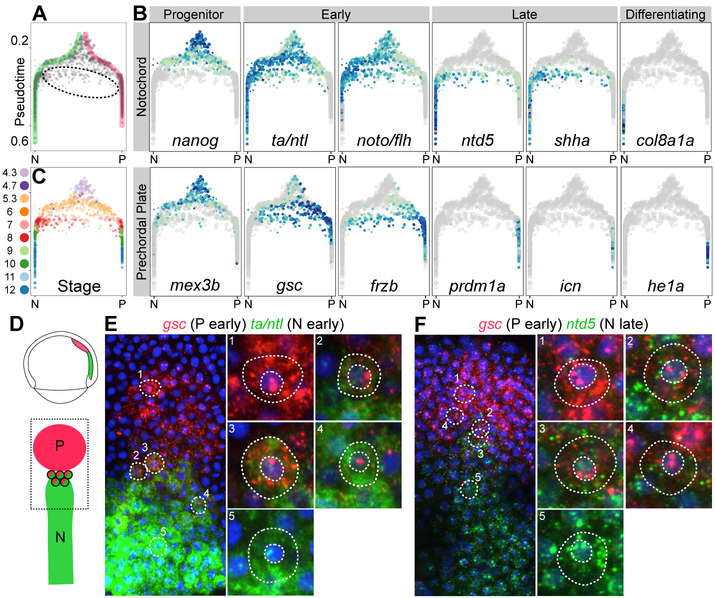
During embryogenesis, cells acquire distinct fates by transitioning through transcriptional states. To uncover these transcriptional trajectories during zebrafish embryogenesis, we sequenced 38,731 cells and developed URD, a simulated diffusion-based computational reconstruction method. URD identified the trajectories of 25 cell types through early somitogenesis, gene expression along them, and their spatial origin in the blastula. Analysis of Nodal signaling mutants revealed that their transcriptomes were canalized into a subset of wild-type transcriptional trajectories. Some wild-type developmental branch points contained cells that express genes characteristic of multiple fates. These cells appeared to trans-specify from one fate to another. These findings reconstruct the transcriptional trajectories of a vertebrate embryo, highlight the concurrent canalization and plasticity of embryonic specification, and provide a framework with which to reconstruct complex developmental trees from single-cell transcriptomes.


Figures

Fig 1.
Fig 1.. Generation of a developmental specification tree for early zebrafish embryogenesis using URD.
(A) Single-cell transcriptomes were collected from zebrafish embryos at 12 developmental stages (colored dots) spanning 3.3–12 hours post-fertilization (hpf). (B) tSNE plot of the entire data, colored by stage (as in Fig. 1A). Developmental time is a strong source of variation, and the underlying developmental trajectories are not immediately apparent. (C) tSNE plot of data from two stages (top: 50% epiboly, bottom: 6-somite). Clusters are more discrete at the later stage. (D) URD’s approach for finding developmental trajectories: (1) Transition probabilities are computed from the distances between transcriptomes and used to connect cells with similar gene expression. (2) From a user-defined ‘root’ (e.g. cells of the earliest timepoint), pseudotime is calculated as the average number of transitions required to reach each cell from the root. (3) Trajectories from user-defined ‘tips’ (e.g. cell clusters in the final timepoint) back to the root are identified by simulated random walks that are biased towards transitioning to cells younger or equal in pseudotime. (4) To recover an underlying branching tree structure, trajectories are joined agglomeratively at the point where they contain cells that are reached from multiple tips. (5) The data is visualized using a force-directed layout based on cells’ visitation frequency by the random walks from each tip. (E) Force-directed layout of early zebrafish embryogenesis, optimized for 2D visualization (fig. S2, Methods, movie S1), colored by stage (as in Fig. 1A) with terminal populations labeled. Abbreviations: EVL (Enveloping Layer), P (Placode), Adeno. (Adenohypophyseal), Trig. (Trigeminal), Epi. (Epibranchial), Panc.+Int. (Pancreatic + Intestinal), RBI (Rostral Blood Island), ICM (Intermediate Cell Mass). (F–I) Cell populations downstream of early and intermediate branchpoints recovered by URD.
Fig 2.
Fig 2.. Developmental trajectories, genes, and connected gene modules overlaid on the force-directed layout.
From top to bottom: (1) the trajectories identified by URD from the root to a given population (or group of populations), (2) gene expression of a classical marker of that population, and (3) expression of a 6-somite gene module active in the population and its connected modules from earlier stages. (The remainder are presented in fig. S3).
Fig 3.
Fig 3.. Association of developmental trajectories with temporal gene expression patterns.
(A) The underlying branching structure found by URD. Pink bars demarcate collections of cell types used in Fig. 4A. (B) The structure of connected gene modules. Each circular node represents a module and is colored by the developmental stage the module was computed from (as in Fig. 1A). Blue bars demarcate collection of modules downstream of each 50% epiboly (5.3 hpf) gene module used in Fig. 4B. (C) Gene expression cascades during specification of the prechordal plate and notochord. Expression is displayed as a moving-window average in pseudotime (along the x-axis), scaled to the maximum observed expression. Selected genes are labeled along the y-axis. Genes are annotated with whether they were identified as a differentially expressed gene, as a top ranking member of a differentially expressed connected gene module, or both. Cascades for all trajectories (with all genes labeled) are presented in Fig. S5.
Fig 4.
Fig 4.. Molecular specification maps relate cell position at 50% epiboly to cell fate at 6-somite.
(A) Visitation by random walks from given tip(s) (as proportion of visitation from all tips), and the spatial location of visited 50% epiboly cells (ventral side to the left). The six tip groups are marked in Fig. 3A. (B) Spatial expression of 50% epiboly gene modules; expression of connected gene modules plotted on the force-directed layout highlight populations that will emerge from the 50% epiboly module’s expression domain. The six groups of connected gene modules are marked in Fig. 3B.
Fig 5.
Fig 5.. Characterization of Nodal signaling mutant by scRNA-seq and developmental specification tree.
(A) Spatial assignment of wild-type and MZoep transcriptomes using a wild-type landmark map indicates an absence of wild-type marginal fates in MZoep (ventral, left). 311 wild-type transcriptomes are shown at random (to match MZoep cell number). (B) Top: wild-type expression domain of spatially restricted gene modules identified in Smart-seq data (ventral to left). Bottom: Violin plot of the maximum-scaled gene module levels in wild-type and MZoep mutant cells. The marginal dorsal, dorsal, and marginal gene modules are absent or strongly reduced in MZoep. (C) Expression of gene modules connected to those missing in MZoep (marginal dorsal, dorsal, and marginal, red) and connected to those remaining in MZoep (blue). (D) Hierarchical clustering of wild-type and MZoep mutant transcriptomes, based on the scaled expression of gene modules. Number of clusters is determined by the Davies-Bouldin index. Genotype is indicated beneath the heatmap (wild type, green; MZoep, red). Clusters 3 and 8 contain only wild-type cells. All other clusters contain a mixture of wild-type and MZoep cells. This clustering analysis was sufficiently sensitive to detect computationally simulated altered states (Fig. S10).
Fig 6.
Fig 6.. Hybrid state of cells in the axial mesoderm.
(A) Branchpoint plot, showing pseudotime (y-axis) and random walk visitation preference from the notochord (N, left) and prechordal plate (P, right) tips (x-axis), defined as the difference in visitation from the two tips divided by the sum of visitation from the two tips. Direct trajectories to notochord (green) and prechordal plate (pink) are highlighted, and intermediate cells are circled. (B) Gene expression of notochord markers (top row) and prechordal plate markers (bottom row) at the axial mesoderm branchpoint. Intermediate cells express early (ta/ntl, noto) and late (ntd5, shha) notochord markers, but only early prechordal plate markers (gsc, frzb). (C) Cells at the branchpoint, colored by developmental stage. Intermediate cells have the same developmental stage as fully bifurcated cells with similar pseudotimes. (D) Cartoon of the prechordal plate (P) and notochord (N) in the 75% epiboly embryo. (E–F) Double fluorescent in situ expression of the early prechordal plate marker gsc (red) and either the early notochord marker ta/ntl (E, green) or the late notochord marker ntd5 (F, green) at 75% epiboly (8 hpf). Most cells contain only prechordal plate marker mRNA (e.g. 1) or notochord marker mRNA (e.g. 5). Cells with both prechordal plate and notochord marker mRNA are observed at the boundary of the two tissues, with red nuclear transcription dots, indicating active transcription of gsc (e.g. 2–4) (fig. S11). Cells that contained both ntd5 and gsc mRNA were identified and scored for their nuclear transcription foci, which indicate active transcription (see Methods); 56% had 1 or more observable nuclear transcription dots, of which 80% showed only active gsc transcription, 7% showed both active gsc and active ntd5 transcription, and 13% showed active ntd5 transcription alone.

Comment in

References

    1. Davis RL, Weintraub H, Lassar AB, Expression of a single transfected cDNA converts fibroblasts to myoblasts. Cell. 51, 987–1000 (1987). - PubMed
    1. Tapscott SJ et al., MyoD1: a nuclear phosphoprotein requiring a Myc homology region to convert fibroblasts to myoblasts. Science. 242, 405–411 (1988). - PubMed
    1. Takahashi K, Yamanaka S, Induction of Pluripotent Stem Cells from Mouse Embryonic and Adult Fibroblast Cultures by Defined Factors. Cell. 126, 663–676 (2006). - PubMed
    1. Wagner A, Regev A, Yosef N, Revealing the vectors of cellular identity with single-cell genomics. Nat Biotechnol. 34, 1145–1160 (2016). - PMC - PubMed
    1. Cannoodt R, Saelens W, Saeys Y, Computational methods for trajectory inference from single-cell transcriptomics. Eur. J. Immunol 46, 2496–2506 (2016). - PubMed

Publication types

Substances